In [2]:
from numpy import *
%pylab inline
11.1
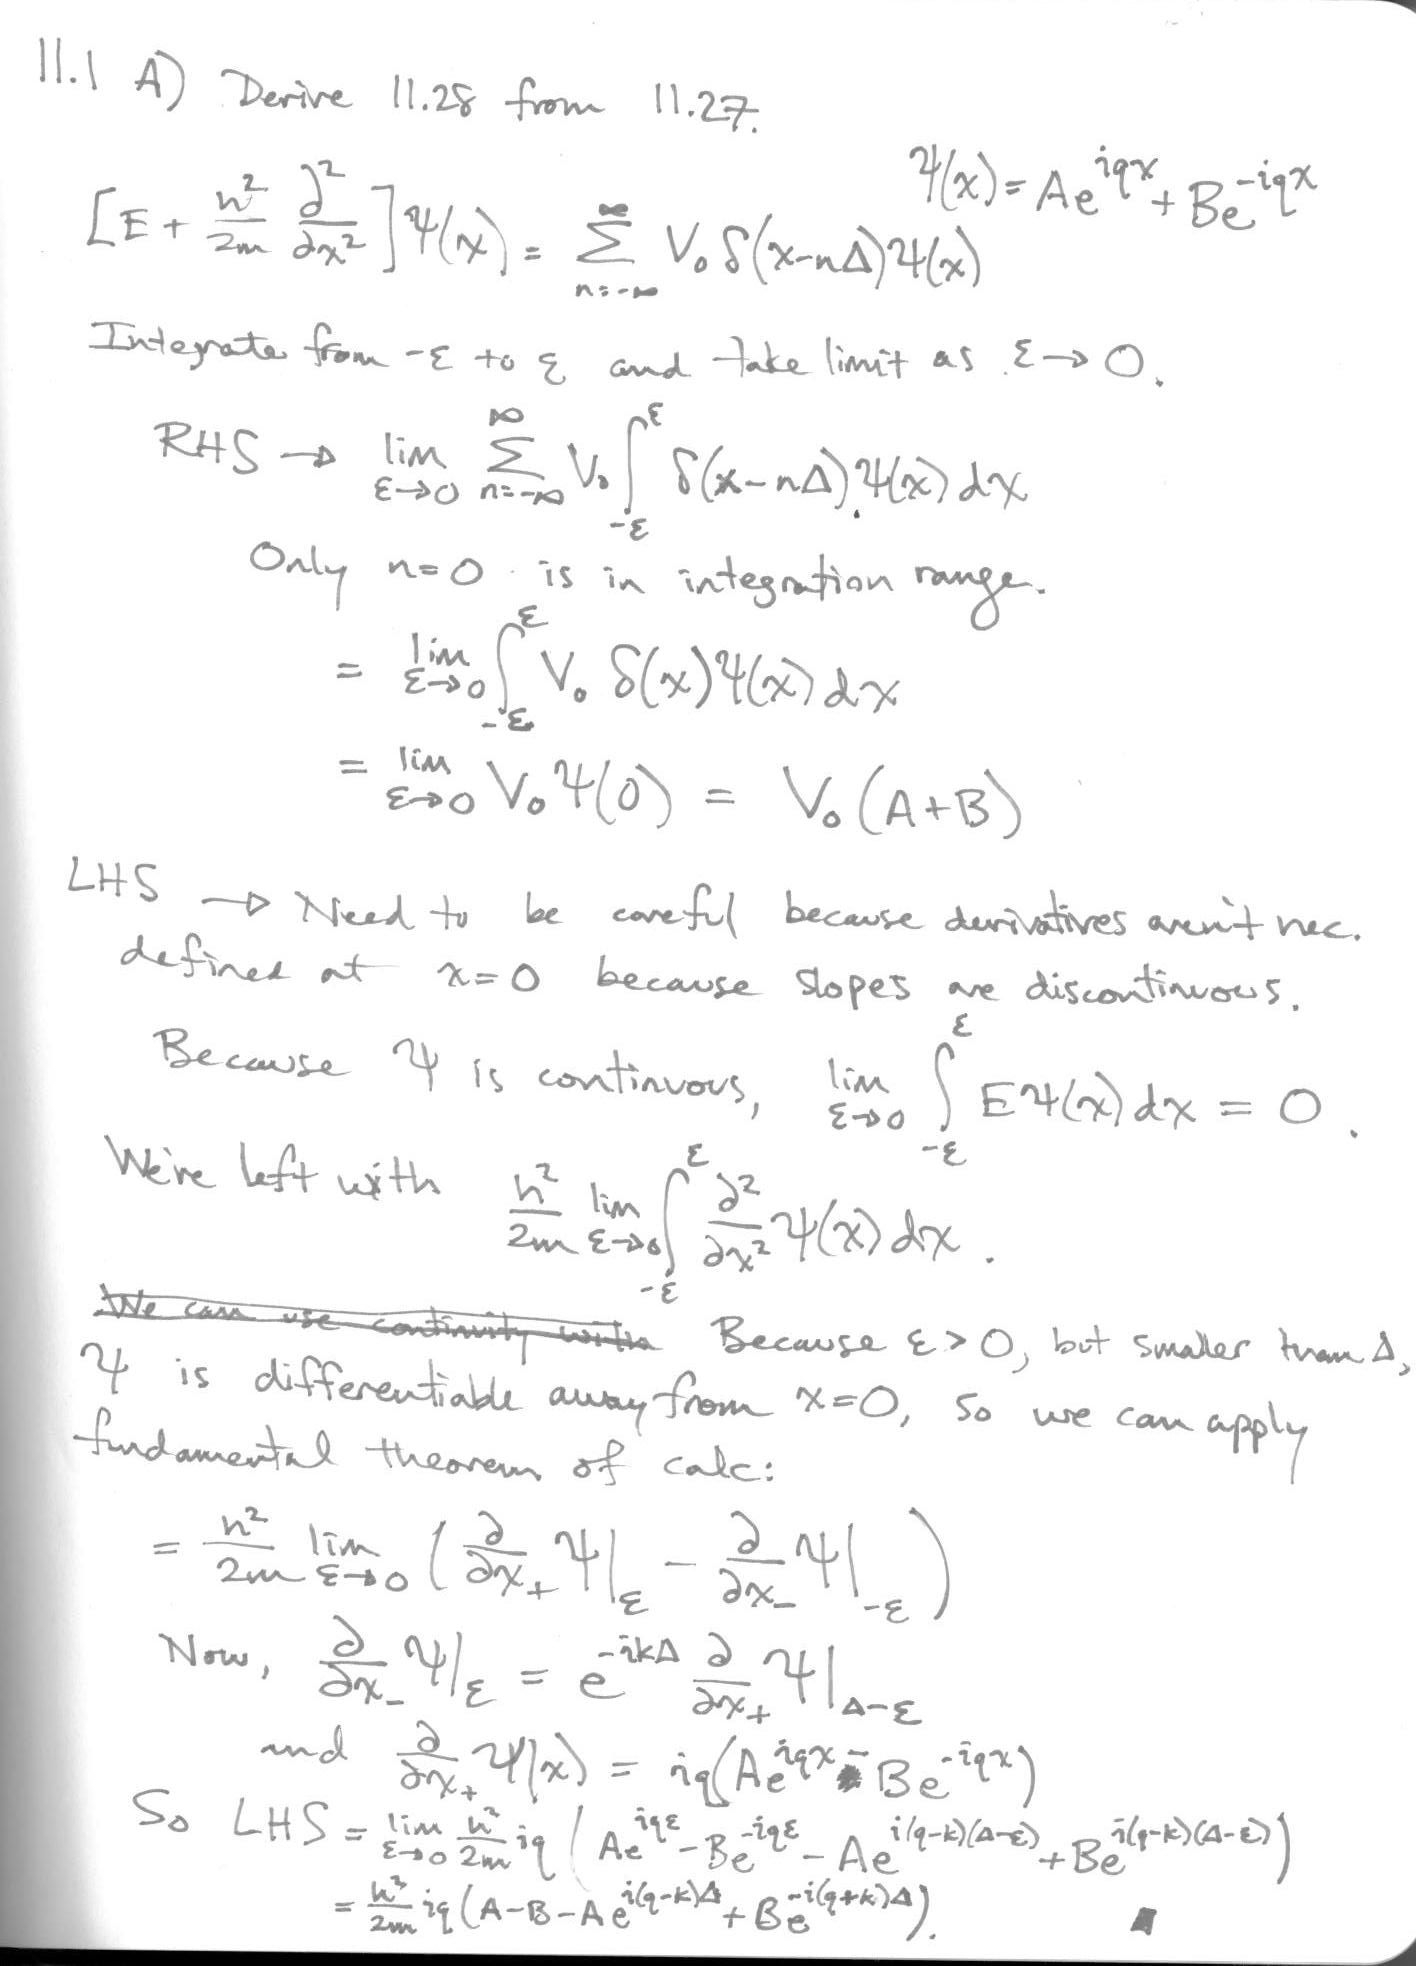
In [1]:
import sympy as s
A,B,q,k,d,h,m = s.symbols('A B q k d h m')
h*h/2/m
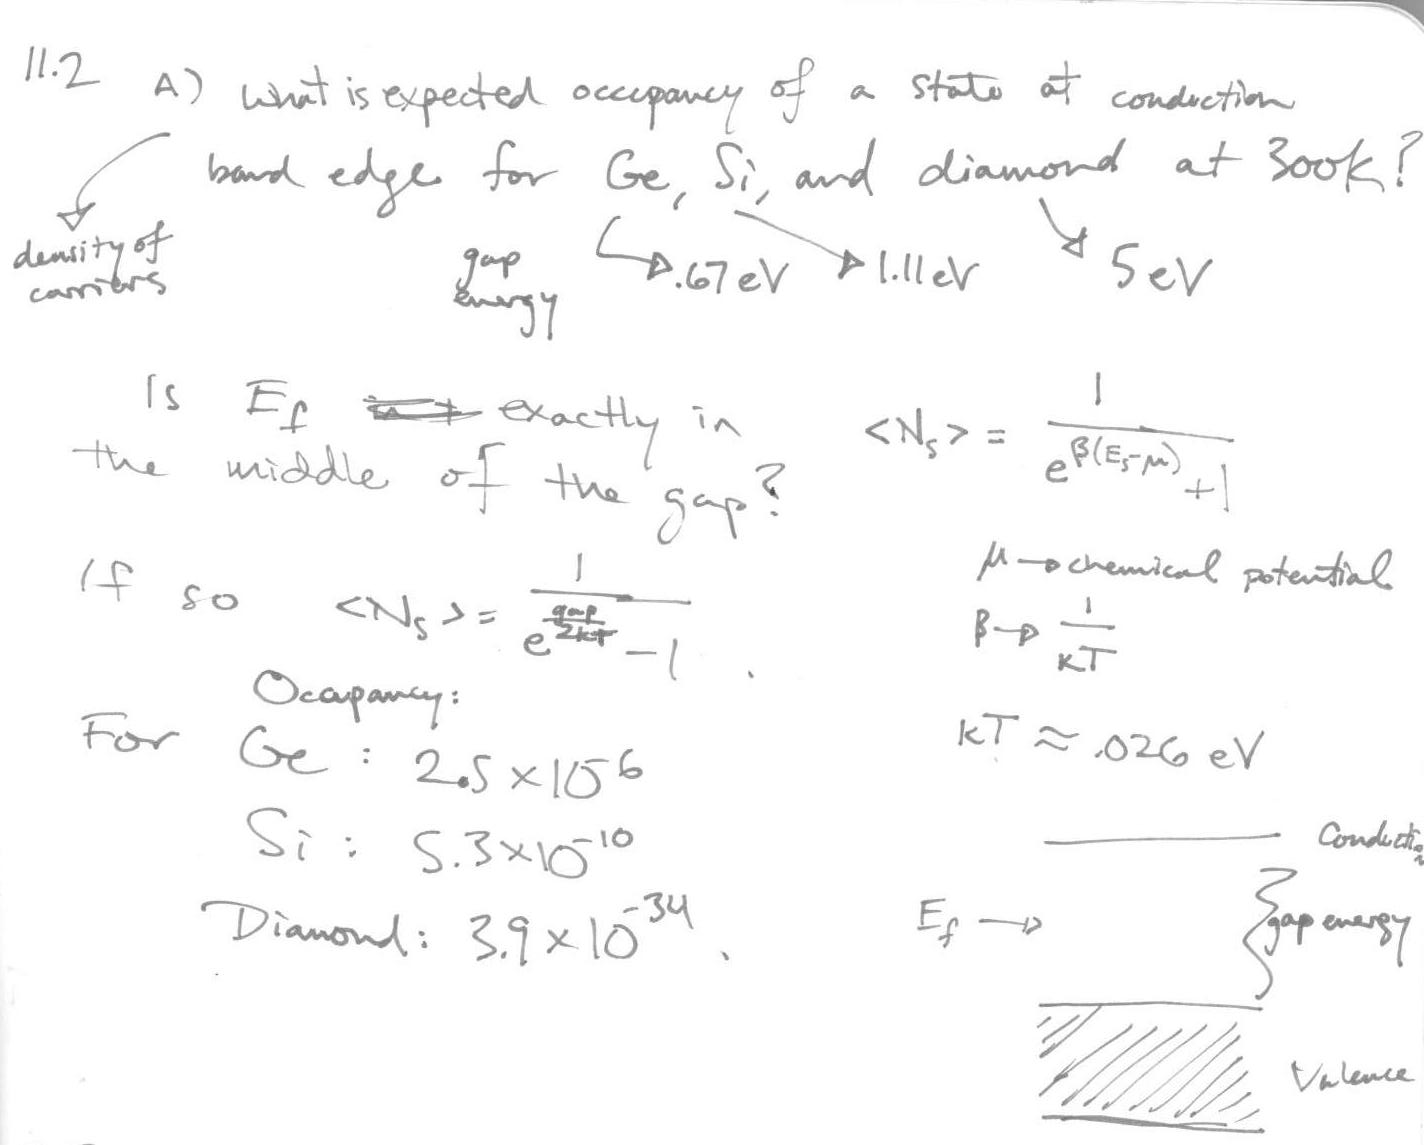
11.2
In [3]:
def ns_expectation(dE):
    # dE = E-mu -- energy difference from Fermi energy
    # For an insulator, is the Fermi energy halfway between valence and conduction band edges?
    kt = .026 #ev, at roomt temperature
    return 1/(exp(dE/kt)+1)
In [10]:
print "Ge expected occupancy at conduction band edge: %.3e"%ns_expectation(.67/2)
print "Si expected occupancy at conduction band edge: %.3e"%ns_expectation(1.11/2)
print "Diamond expected occupancy at conduction band edge: %.3e"%ns_expectation(5/2)
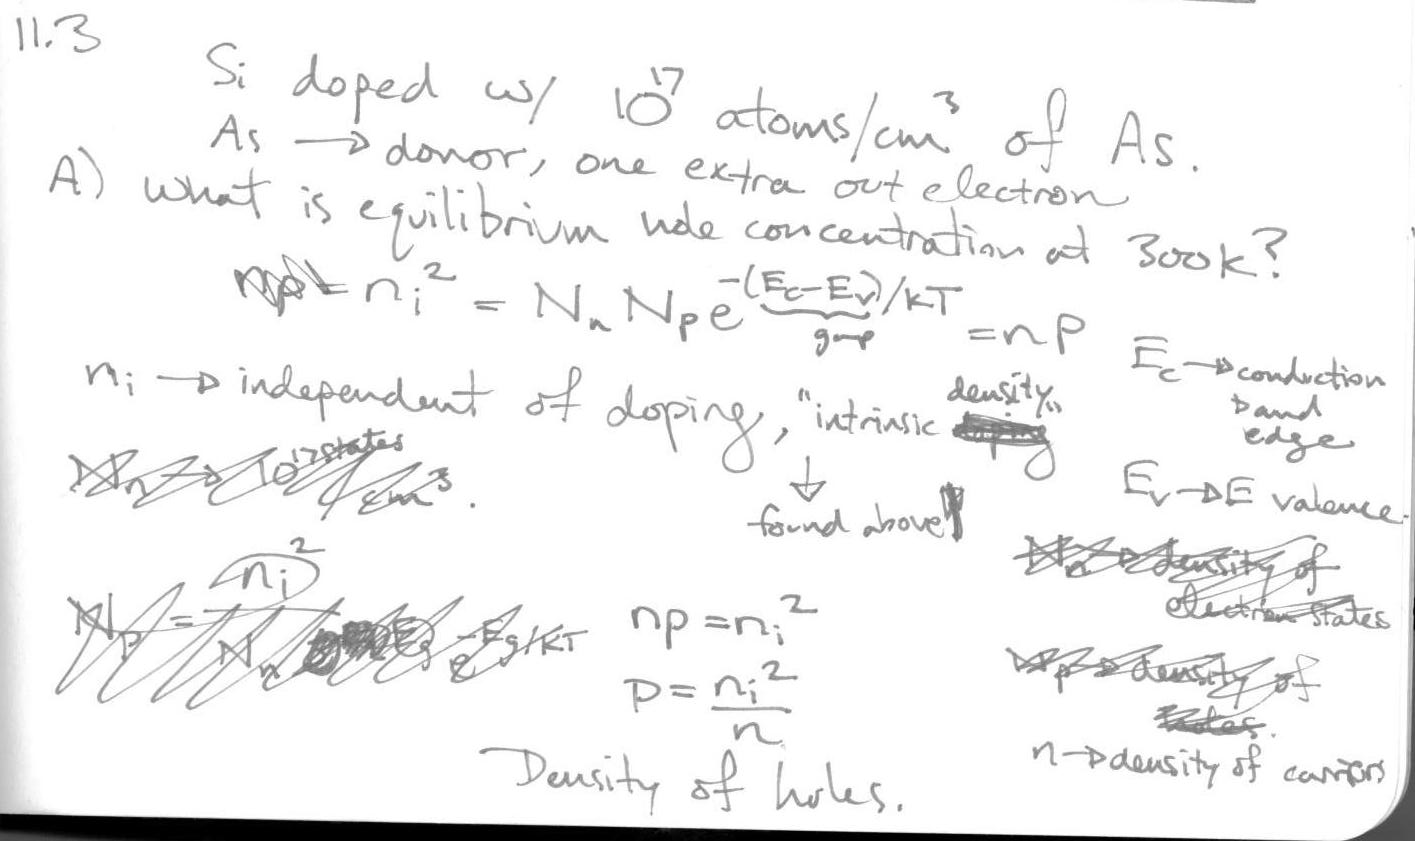
11.3
In [19]:
ni = ns_expectation(1.11/2) #intrinsic density
n = 1e17
def p(ni,n):
    return ni**2/n
print "Equilibrium hole concentration in Si with %.0e As atoms/cm^3: %.2e holes/cm^3"%(n,p(ni,n))
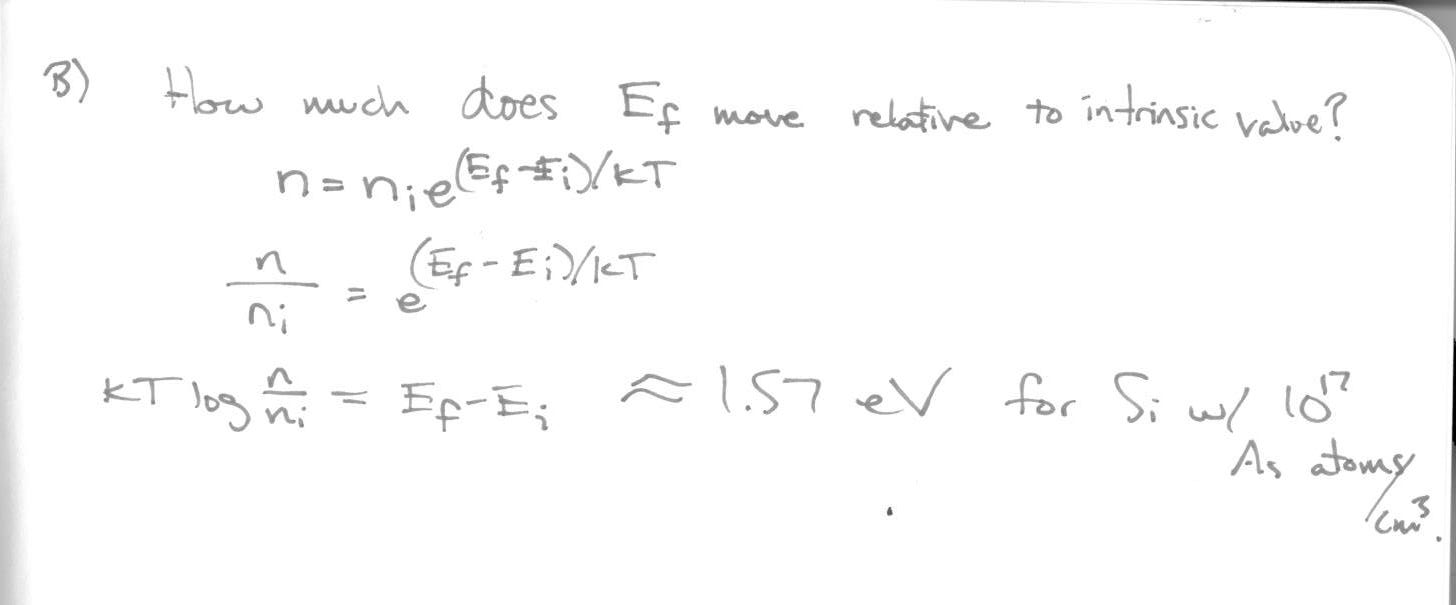
In [23]:
def E_shift(ni,n):
    kt = .026 #ev, at roomt temperature
    return kt*log(n/ni)
print "Fermi energy shift in Si with %.0e As atoms/cm^3: %.2e eV"%(n,E_shift(ni,n))
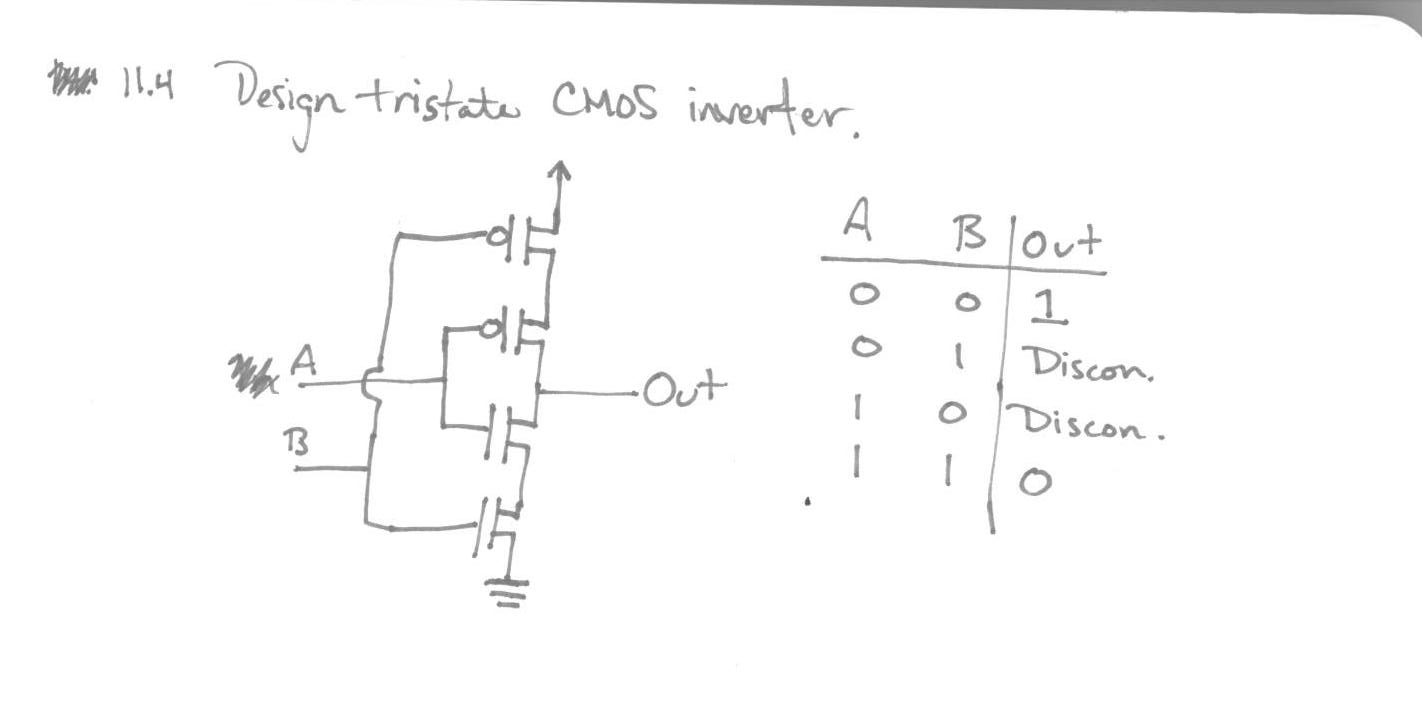
11.4
In [ ]: