Project 4: Make a printed circuit board, stuff it, and program it using Neil's program. Modify the assembly code to measure something different, and then modify the python GUI accordingly.
-- making the board (the easy part) --
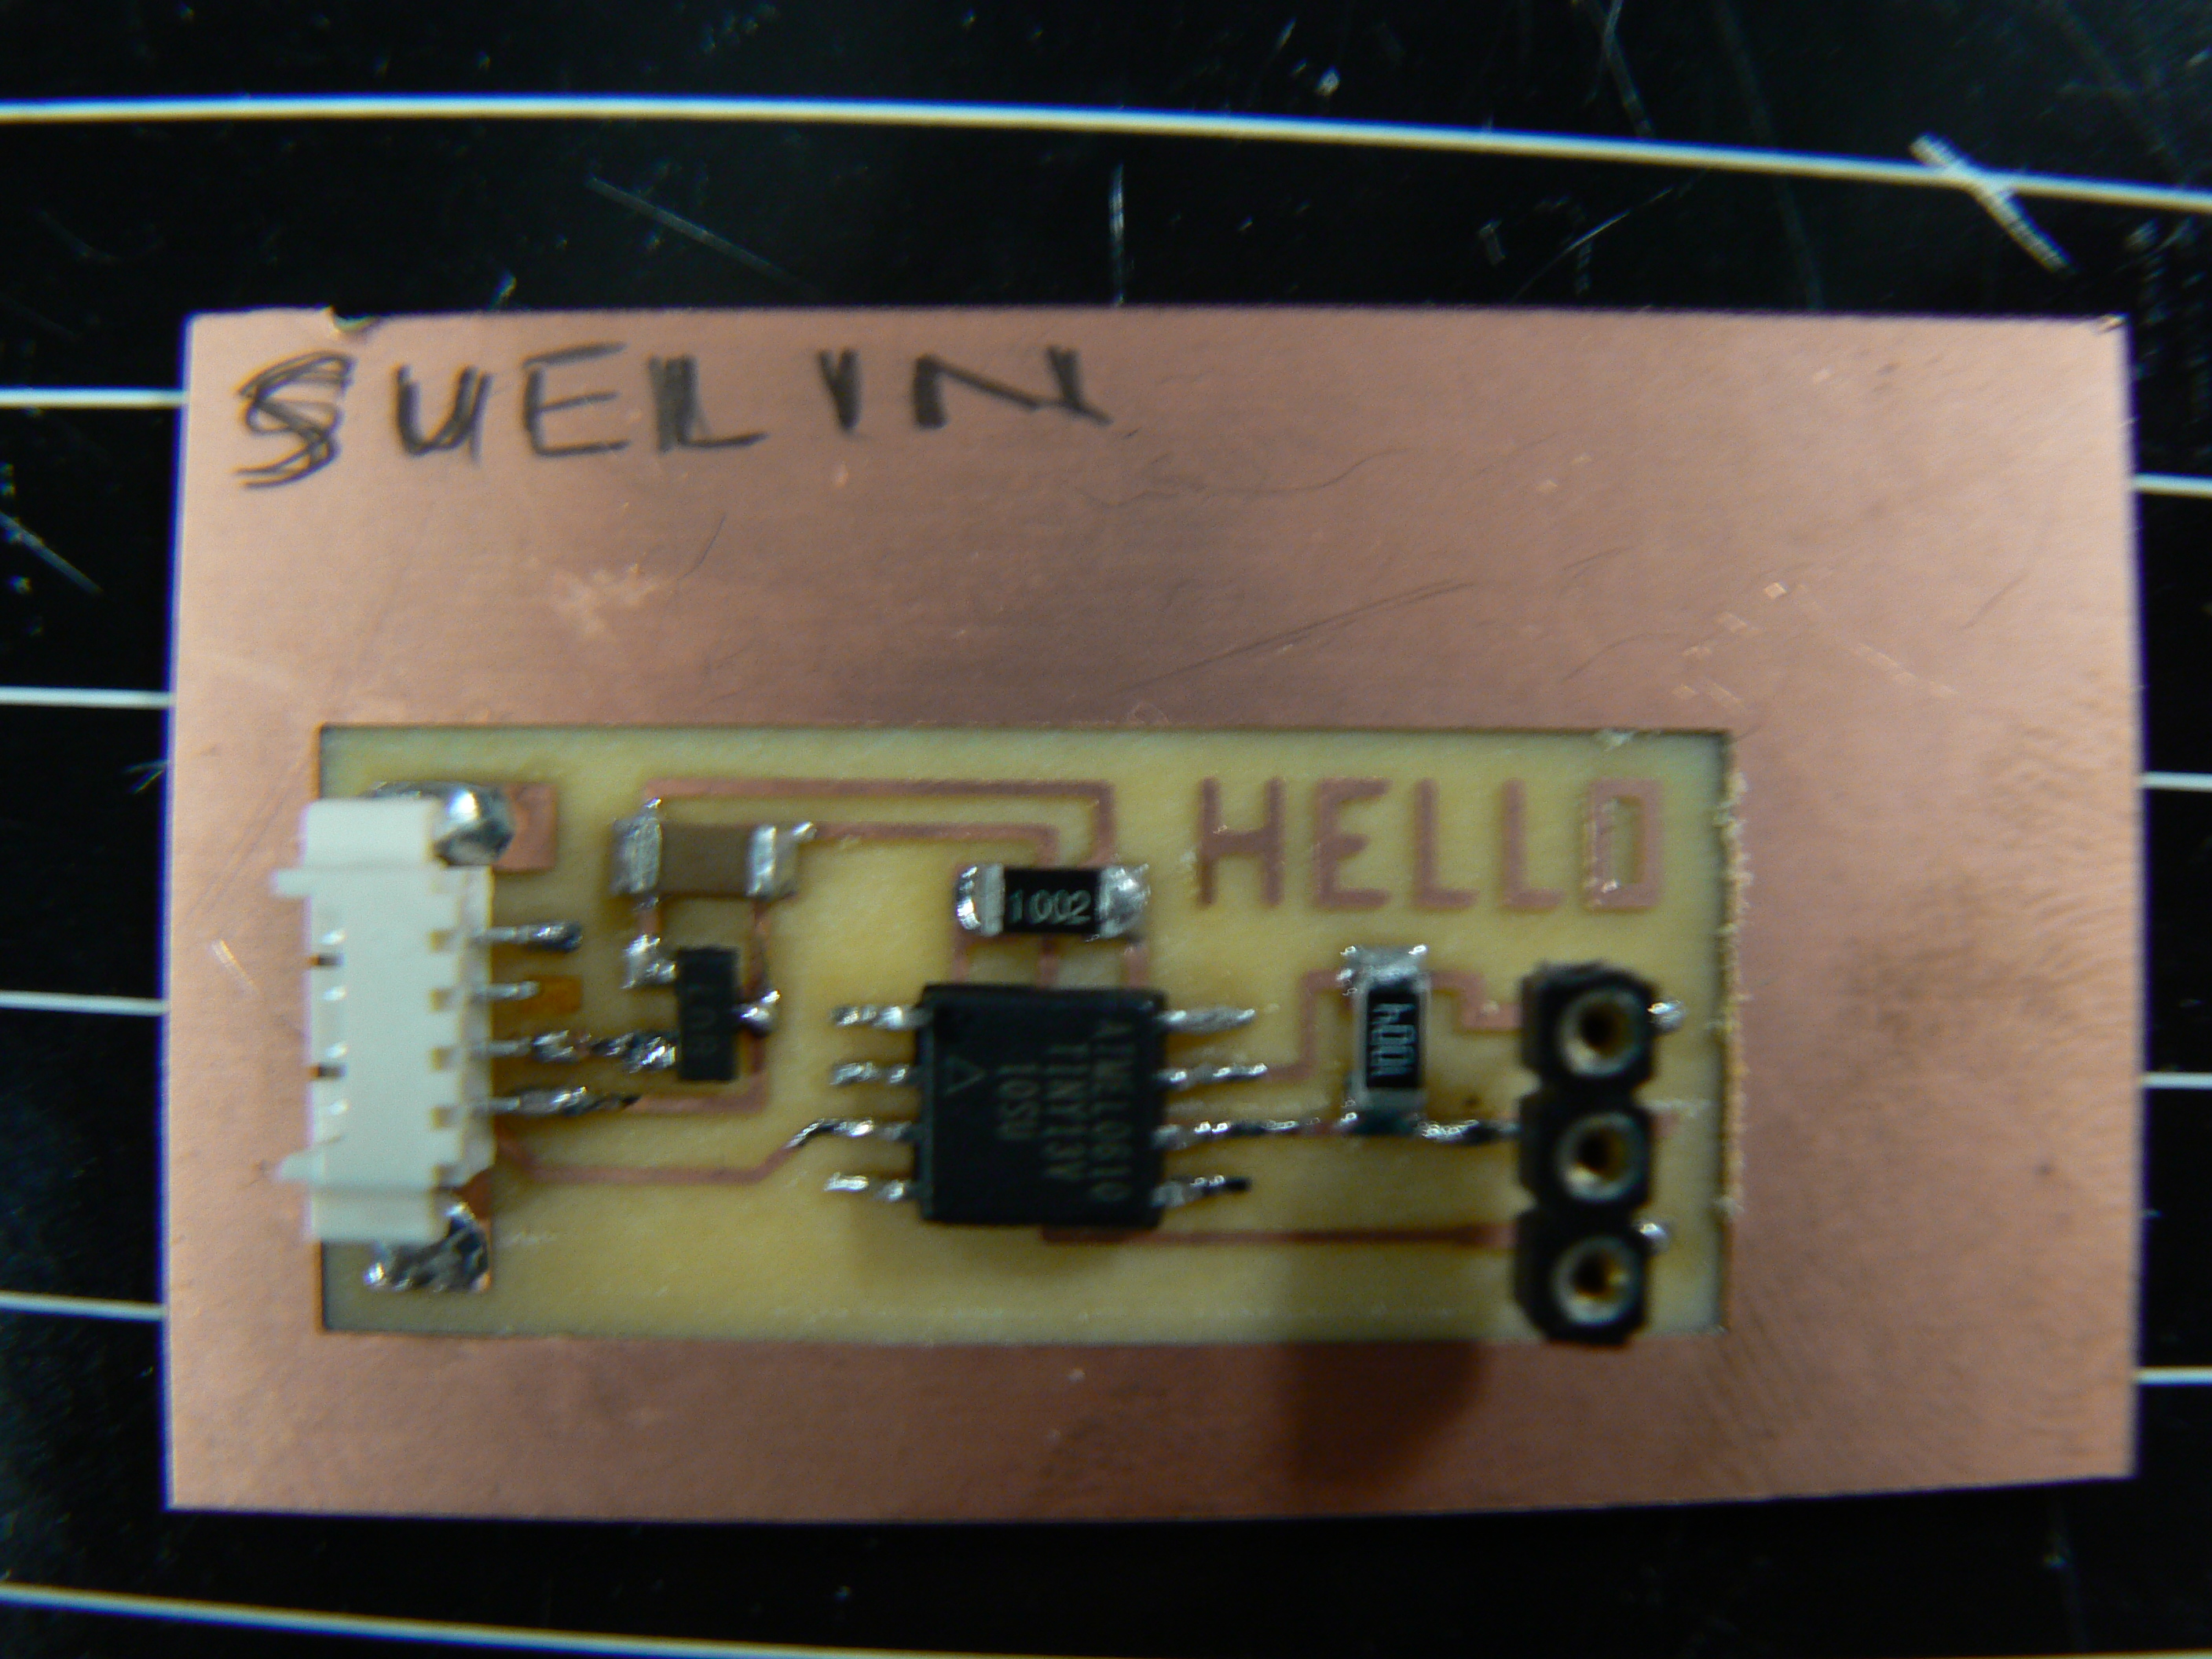
I machined the circuit board "Hello3" using the Modela mini mill and stuffed the board with all the parts.
The soldering took a lot less time than the last couple of boards. YES!
-- programming the board --
In one terminal rx.py is run to power the circuit board.
In another terminal window the command line
avrdude -p t13 -c bsd -U flash:w:hello3.step.hex
is run to program the board.
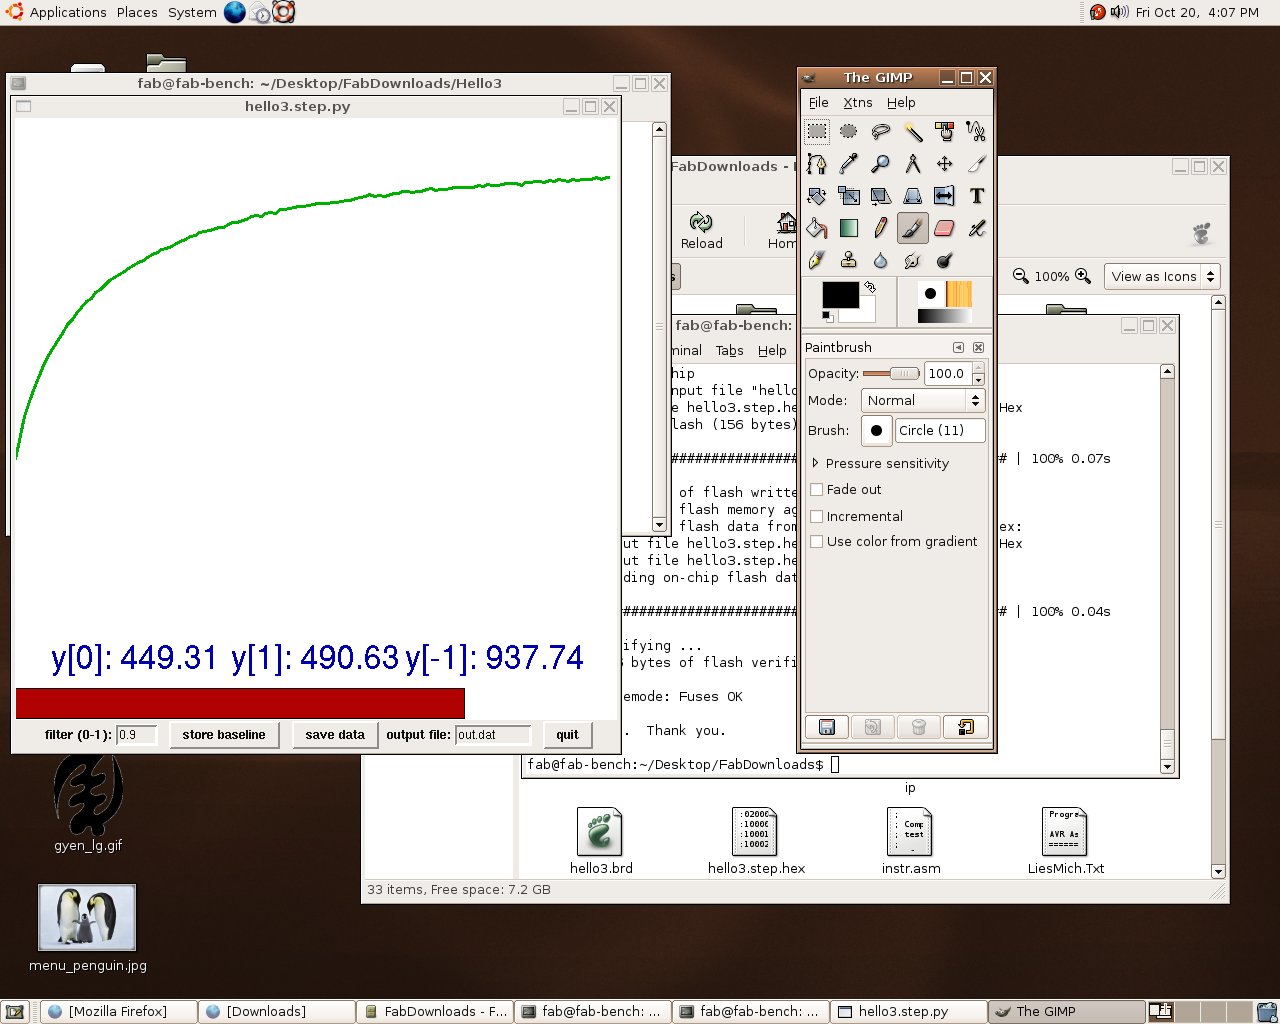
Then hello3.step.py is run to display the GUI.
Amazingly, it worked on the first try! I am in shock.
Here is a screenshot:
-- going through hello3.step.asm --
With Alyssa as our fearless leader, a bunch of us met and went through the assembly code.
This was extremely helpful because by the end of the session we were:
- familiar with assembly language
- had some understanding of how the program works
- learned how to look things up in the data sheet, instruction set, and the AVR assembler user guide
- understood some parts of the microcontroller architecture
- learned how to count in binary!
-- trying to measure other stuff --
A group of us met again to try to modify the code to make our hello3 boards measure something other than capacitance.
This turned out not to be as easy as it sounded.
We started out by watching as David modified the original assembly code to make the circuit into a logic analyzer.
It did not work at first but by trying several different serial cables and board combinations, we got it to work.
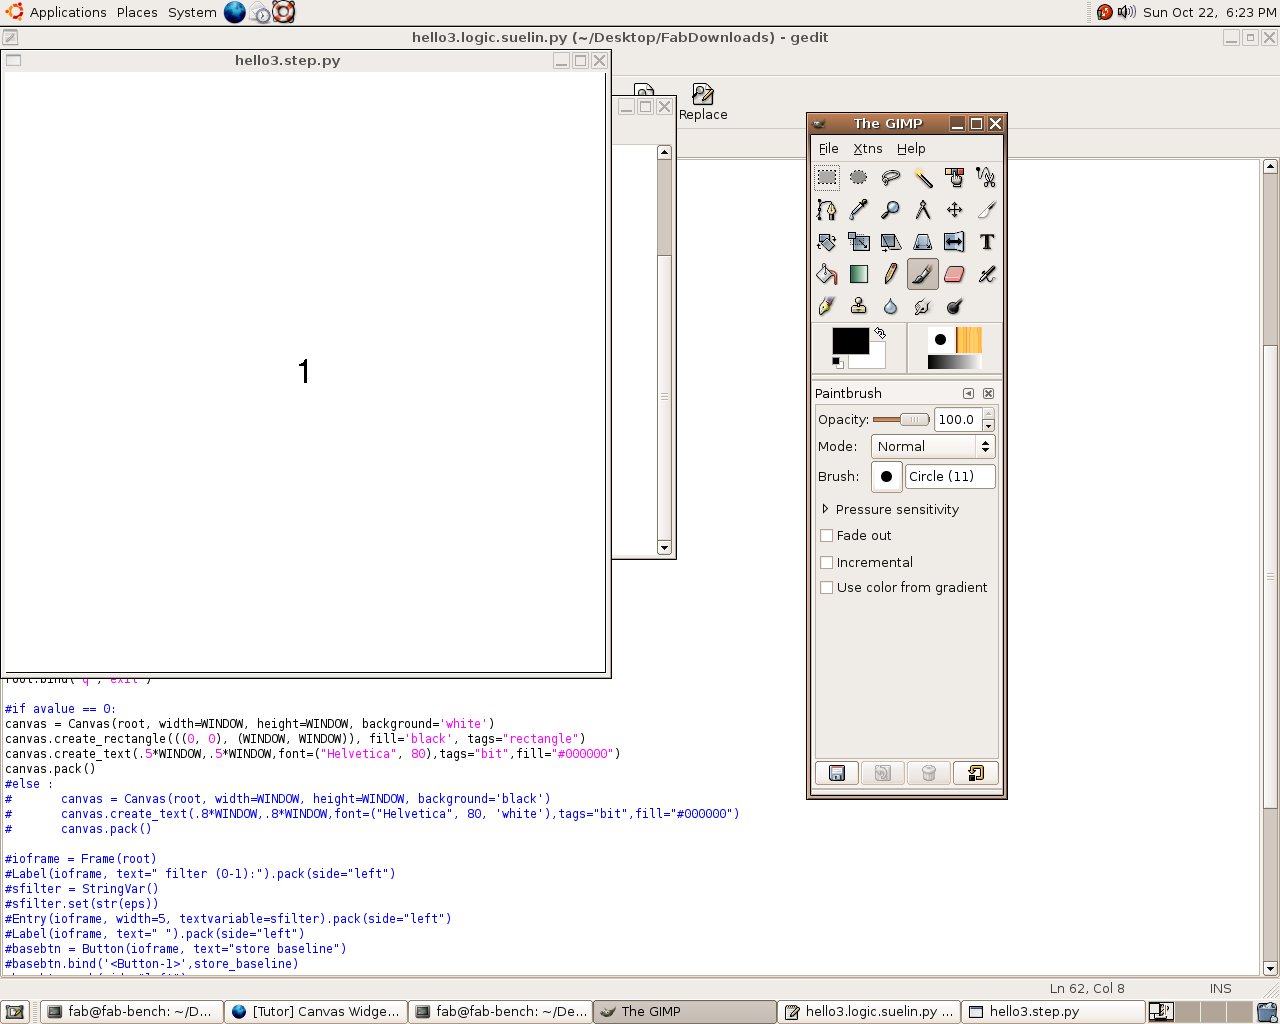
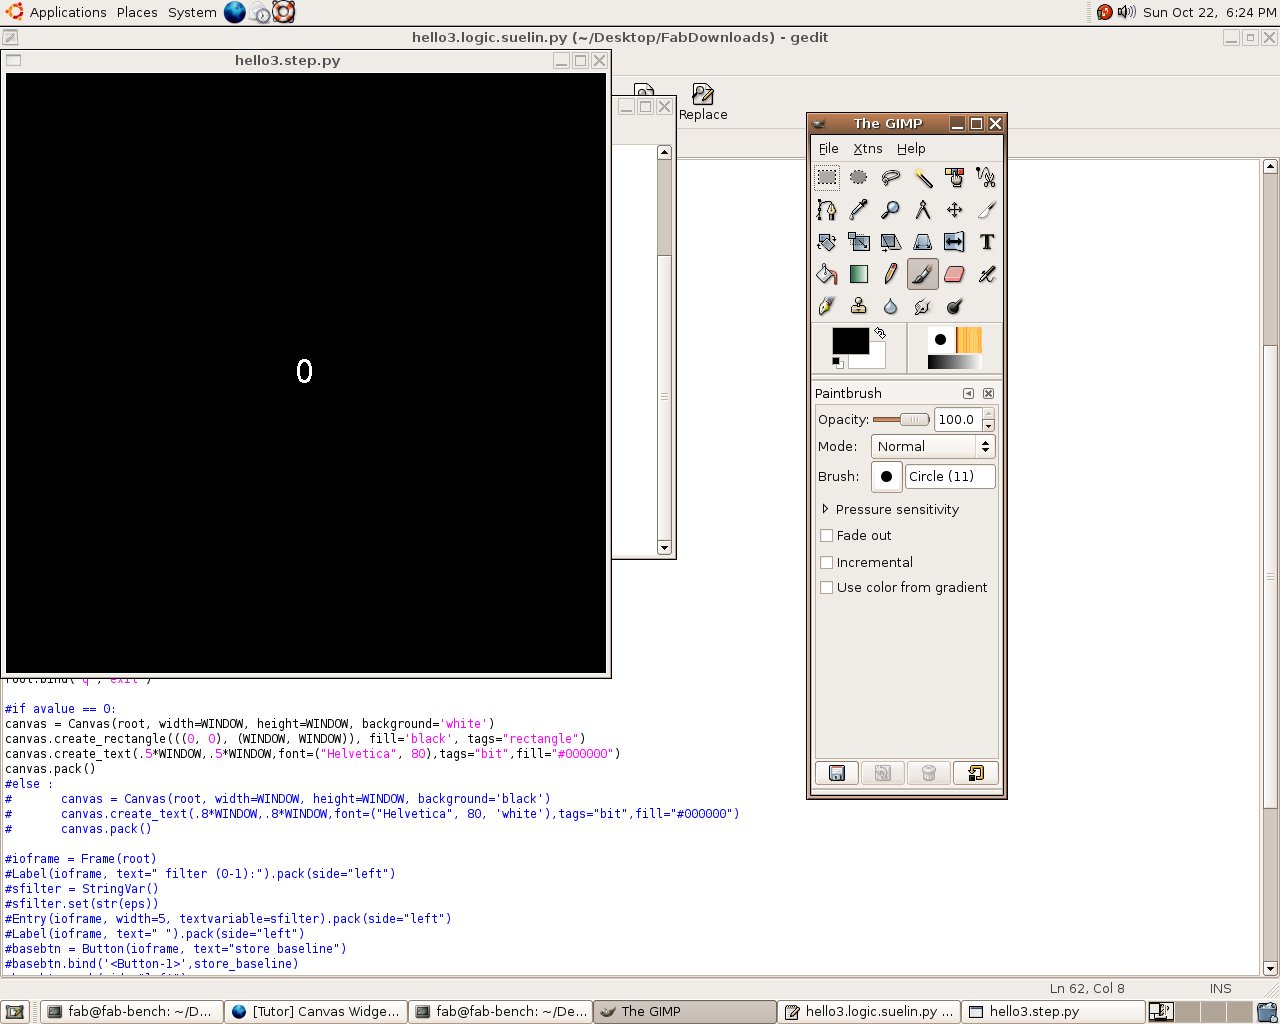
-- logic analyzer GUI --
I modified David's logic analyzer GUI to make the screen change color depending on whether the output is 1 or 0. This was no easy feat--in the end, I had to draw a rectangle the size of the canvas and delete it each time. This was not super satisfying, but it familiarized me with the python code and I began to feel more comfortable with it.
-- voltmeter --
A bunch of us collaborated to modify the assembly code to make a voltmeter.
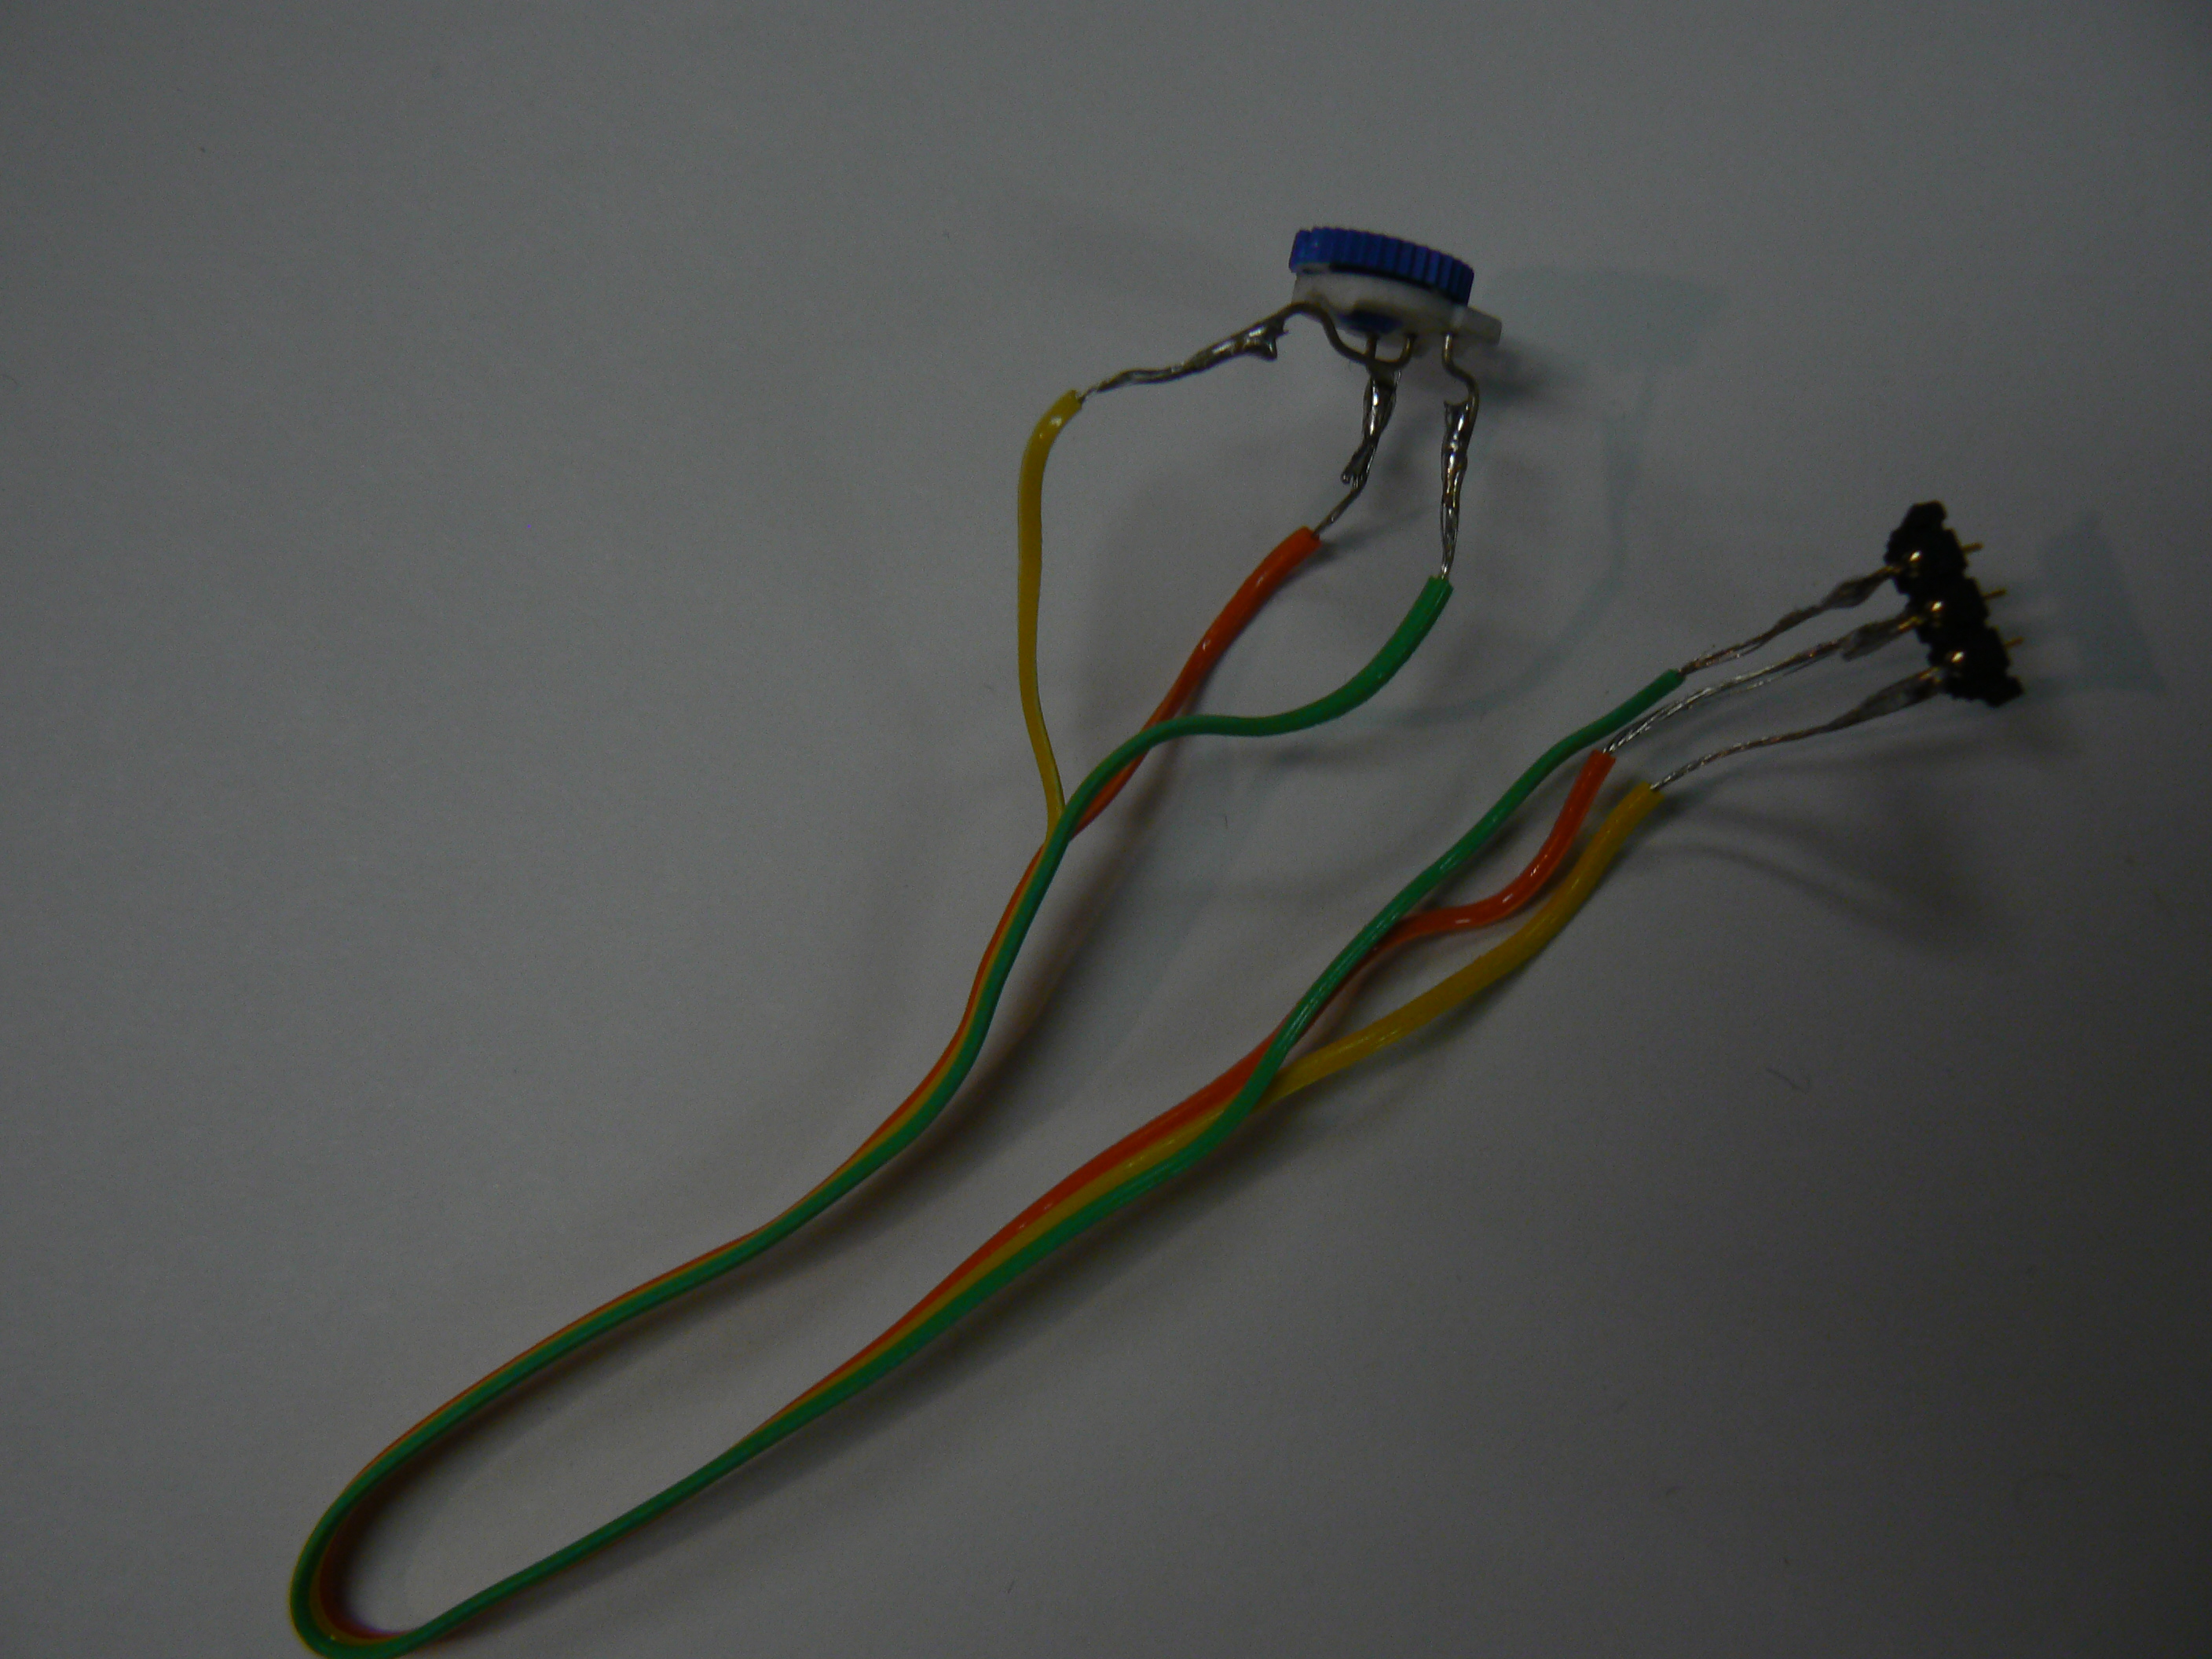
We also made a trimpot ('trim' refers to the trimming of the circuit, 'pot' refers to potentiometer) which allows you to change the resistance and thus the voltage with the twist of a knob. Critically, two of the wires needed to be switched because the original voltmeter program did not assign the top pin, which connects to the analog to digital converter, as the sensepin.
The voltmeter GUI was designed to make the number go across the screen horizontally to the right if it was high and to the left if it was low. It also changed font size and color accordingly!
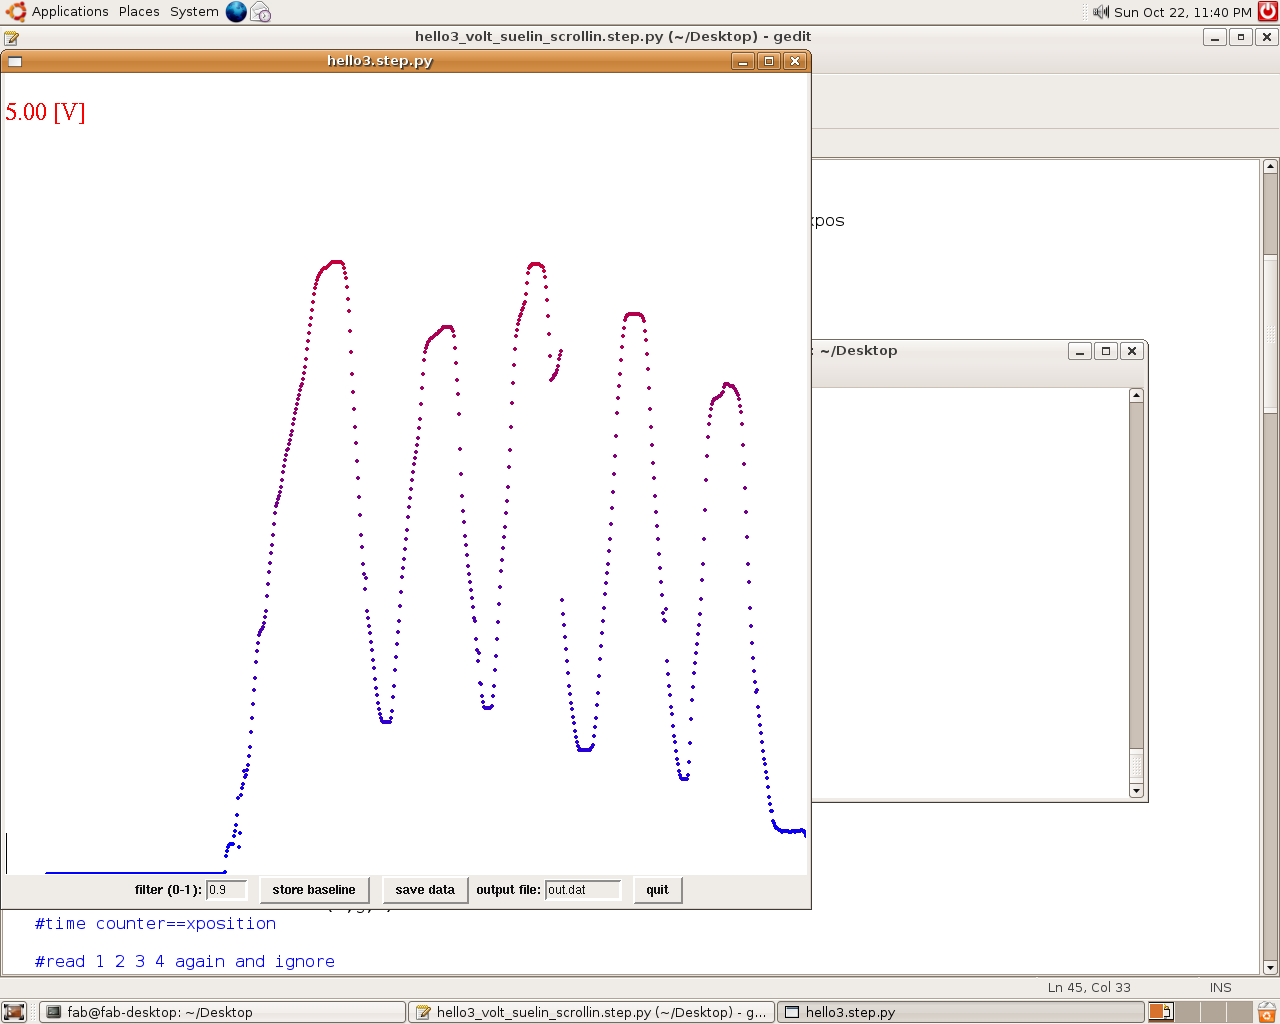
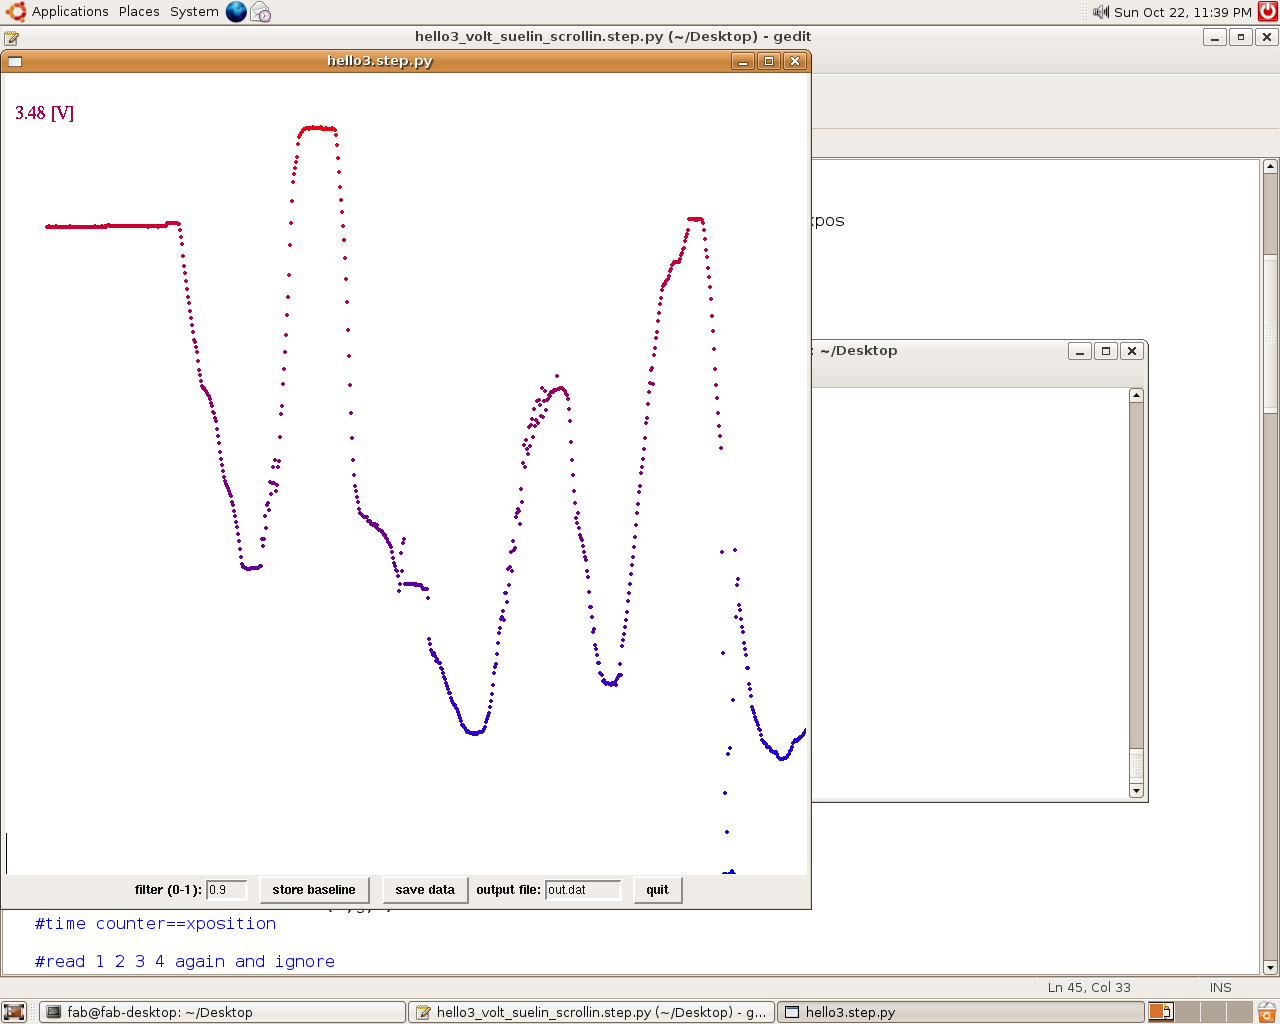
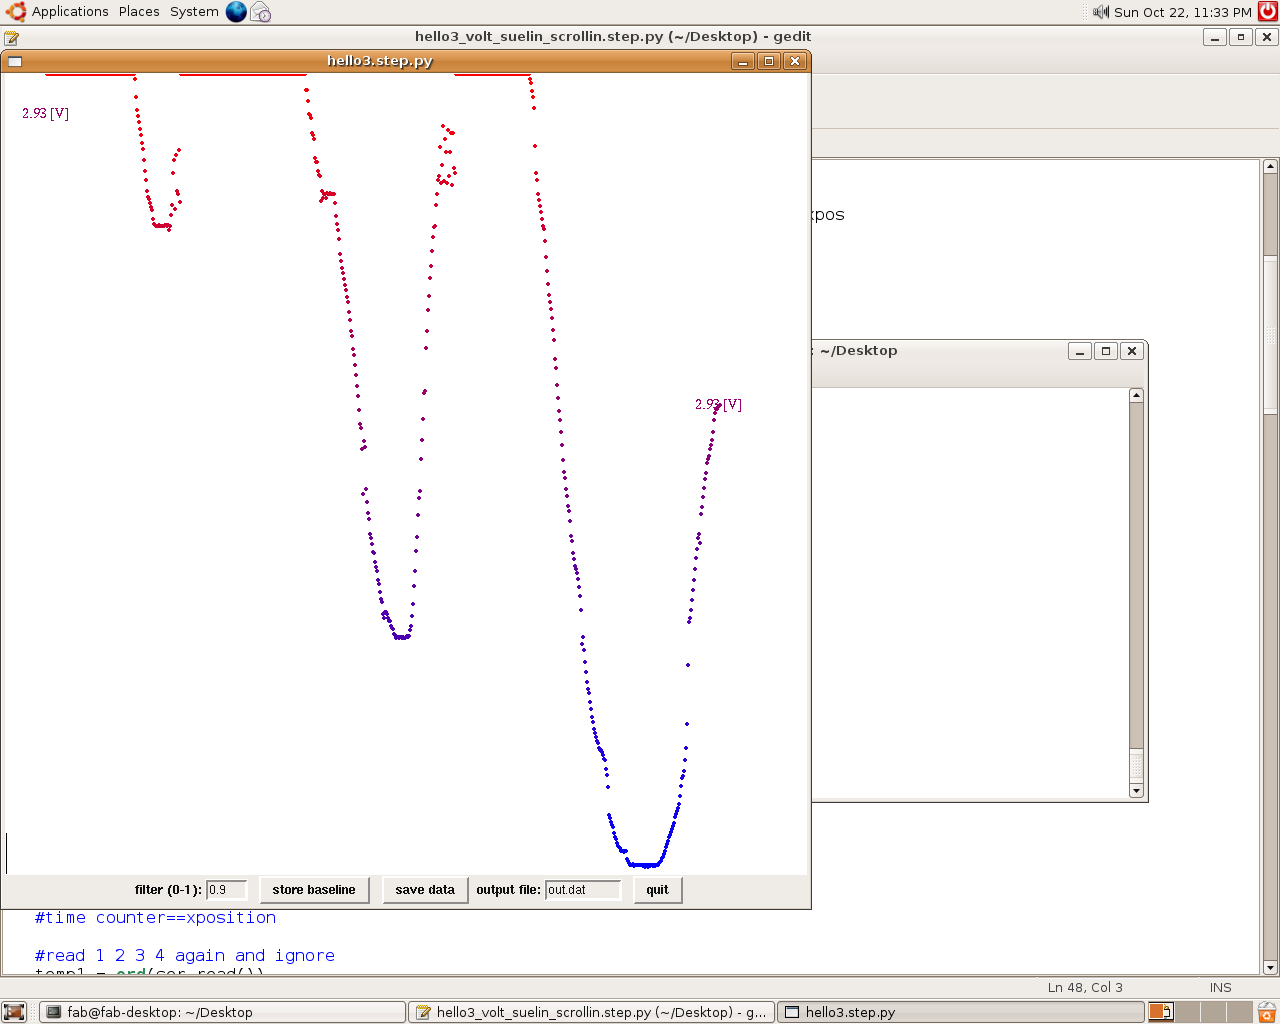
-- altering the GUI to make an oscilloscope --
I first modified the number going back and forth to go up and down. I also needed to flip the y-coordinate so that the high voltage was on top and the low voltage was on the bottom.
I then added a dot with "create_oval" in python. I made the dot have the same y coordinates as the voltage shown and I modified the dot color to match that of the number, which was confusing because the dot outline is rather thick and thus when the dot is that small (width=3) the outline color is what matters.
I then wanted to track the voltage with respect to time. This was fairly simple to do; I just had to replace the x-coordinate with a variable. I increased this variable by 1 within the main loop, and initialized it outside. I did the same with the x-coordinate of the voltage display.
The next step was to restart the screen each time the dot reached the end. I did this by creating an if statement that uses the canvas_delete command to get rid of the dot trace at the end of each screen.
I also displayed the actual numerical value in the upper corner (since it is hard to follow the number moving with the eye.)
Below is the python code I used:
#
# hello3_volt_suelin_scrollin.step.py
# voltmeter/oscilloscope GUI
# 10.21.06
#
from Tkinter import *
import serial

WINDOW = 800
NSAMPLES = 254
MAX = 1040
MAX_VOLTAGE = 5.0
eps = .9
saveflag = 0
index = 0
path = []
step = []
path_filt = []
step_filt = []
baseline = []

xpos = .05*WINDOW

def idle(parent,canvas):
   global index, channel, baseline, path, path_filt, step, step_filt, saveflag, xpos
   #
   # idle routine
   #
   eps = float(sfilter.get())
 #  lo_dn = ord(ser.read())
 #  hi_dn = ord(ser.read())
   uplo = ord(ser.read())
   uphi = ord(ser.read())

 #to make the window start over
   #if xpos == WINDOW:
    #  xpos = .05*WINDOW
     # canvas.delete("dot")
   #else:

   #convert these two to one number
   voltage_value = 256*uphi + uplo # this number is between 0-1023
   #convert to 0-5 volt values

   #taking care of invalid voltage readings from chip
   if voltage_value < 0:
      voltage_value = 0
   if voltage_value > 1023:
      voltage_value = 1023

   voltage_value_normalized = float( voltage_value / 1023.0 ) # range [0,1]
   voltage_value_volts = voltage_value_normalized * MAX_VOLTAGE # range [0,5]
   vvsn = int ( voltage_value / 50 ) # correlate voltage value to text size
   # vvsn stands for voltage value size normalized
   r=int (voltage_value_volts * 51)
   b=int (255 - r)
   g=0
   vvcn =  "#%02x%02x%02x"% (r,g,b)

   # vvsn stands for voltage value color normalized
   dotcolor =  "#%02x%02x%02x"% (r,g,b)
   #time counter==xposition

   #read 1 2 3 4 again and ignore
   temp1 = ord(ser.read())
   temp2 = ord(ser.read())
   temp3 = ord(ser.read())
   temp4 = ord(ser.read())

   print "-------"
   print temp1, temp2, temp3, temp4
   print uphi, uplo, voltage_value, voltage_value_volts

   #show convetred value on screen


   canvas.delete("voltage")
   canvas.delete("voltagestatic")
   canvas.create_text(xpos, (1-voltage_value_normalized)*WINDOW,font=("Times New Roman", vvsn),tags="voltage",fill=vvcn)
   canvas.create_text(.05*WINDOW,.05*WINDOW, font=("Times New Roman", vvsn),tags="voltagestatic", fill=vvcn)
   canvas.itemconfigure("voltage",text="%.2f [V]"%voltage_value_volts)
   canvas.itemconfigure("voltagestatic",text="%.2f [V]"%voltage_value_volts)
 #  canvas.delete("oval")
   xpos = xpos + 1
   canvas.create_oval(xpos, (1-voltage_value_normalized)*WINDOW, xpos, (1-voltage_value_normalized)*WINDOW, width=3, tags="dot", fill=vvcn, outline=vvcn)
   parent.after_idle(idle,parent,canvas)

"""
   lo_dn =0
   hi_dn =0
   lo_up =0
   hi_up =0


   if ((lo_dn == 1) & (hi_dn == 2) & (lo_up == 3) & (hi_up == 4)):
      if (path_filt == []):
         path_filt = path
	 step_filt = step
      else:
         for i in range(len(path_filt)):
	    path_filt[i] = (1-eps)*path_filt[i] + eps*path[i]
         for i in range(len(step_filt)):
	    step_filt[i] = (1-eps)*step_filt[i] + eps*step[i]
      canvas.delete("path")
      canvas.create_line(path_filt,tag="path",width=3,fill="#00b000")
      if (baseline != []):
         canvas.delete("baseline_path")
         canvas.create_line(baseline,tag="baseline_path",width=3,fill="#b00000")
      canvas.itemconfigure("y0",text="y[0]: %.2f"%step_filt[0])
      canvas.itemconfigure("y1",text="y[1]: %.2f"%step_filt[1])
      canvas.itemconfigure("y-1",text="y[-1]: %.2f"%step_filt[-1])
      canvas.coords('x0',0,.95*WINDOW,step_filt[0],WINDOW)
      if (saveflag == 1):
         file = open(soutfile.get(),"w")
	 for i in range(len(step_filt)):
	    file.write("%f\n"%(step_filt[i]))
	 file.close()
	 print 'saved to '+soutfile.get()
         saveflag = 0
      index = 0
      path = []
      step = []
   else:
      value_up = 256*hi_up + lo_up
      value_dn = 256*hi_dn + lo_dn
      value = (value_up + (1023-value_dn))/2.0
      index += 2
      step.insert(0,value)
      path.insert(0,WINDOW-value*WINDOW/float(MAX))
      path.insert(0,WINDOW-index*WINDOW/float(NSAMPLES))
"""
   #parent.after_idle(idle,parent,canvas)


def save_data(parent):
   global saveflag
   saveflag = 1

def store_baseline(parent):
   global path_filt, baseline
   baseline = []
   for i in range(len(path_filt)):
      baseline.append(path_filt[i])

#
# open serial port
#
#ser = serial.Serial('/dev/ttyUSB0',9600)

ser = serial.Serial('/dev/ttyS0',9600)
#ser = serial.Serial('COM6',9600)
ser.setDTR()
#
# find framing
#
print "finding framing ..."
byte2 = 0
byte3 = 0
byte4 = 0
while 1:
   byte1 = byte2
   byte2 = byte3
   byte3 = byte4
   byte4 = ord(ser.read())
   if ((byte1 == 1) & (byte2 == 2) & (byte3 == 3) & (byte4 == 4)):
      print "start plotting"
      break
#
# start plotting
#
root = Tk()
root.title('hello3.step.py')
root.bind('q','exit')

canvas = Canvas(root, width=WINDOW, height=WINDOW, background='white')
canvas.create_text(.5*WINDOW,.5*WINDOW,font=("Helvetica", 24),tags="voltage",fill="#000000")
canvas.create_text(.2*WINDOW,.9*WINDOW,font=("Helvetica", 24),tags="y0",fill="#0000b0")
canvas.create_text(.5*WINDOW,.9*WINDOW,font=("Helvetica", 24),tags="y1",fill="#0000b0")
canvas.create_text(.8*WINDOW,.9*WINDOW,font=("Helvetica", 24),tags="y-1",fill="#0000b0")
canvas.create_rectangle(0,.95*WINDOW,0,WINDOW, tags='x0', fill='#b00000')
canvas.pack()

ioframe = Frame(root)
Label(ioframe, text=" filter (0-1):").pack(side="left")
sfilter = StringVar()
sfilter.set(str(eps))
Entry(ioframe, width=5, textvariable=sfilter).pack(side="left")
Label(ioframe, text=" ").pack(side="left")
basebtn = Button(ioframe, text="store baseline")
basebtn.bind('',store_baseline)
basebtn.pack(side="left")
Label(ioframe, text=" ").pack(side="left")
savebtn = Button(ioframe, text="save data")
savebtn.bind('',save_data)
savebtn.pack(side="left")
Label(ioframe, text=" output file:").pack(side="left")
soutfile = StringVar()
soutfile.set("out.dat")
Entry(ioframe, width=10, textvariable=soutfile).pack(side="left")
Label(ioframe, text=" ").pack(side="left")
quitbtn = Button(ioframe, text="quit")
quitbtn.bind('','exit')
quitbtn.pack(side="left")
ioframe.pack()

root.after(100,idle,root,canvas)
root.mainloop()