Victor Vina
Fab Lab Bcn
<- Home
Input Devices -> In the Air
Assignment: Measure and display something.
Interactive visualization of sensor data.
Collaboration for Nerea Calvillo. Medialab Prado, Madrid
This page documents the interactive system. For further info please refer to the project's website. As part of a team of eight people, I coded the application and set up the control system, networking and lighting of the physical prototype.
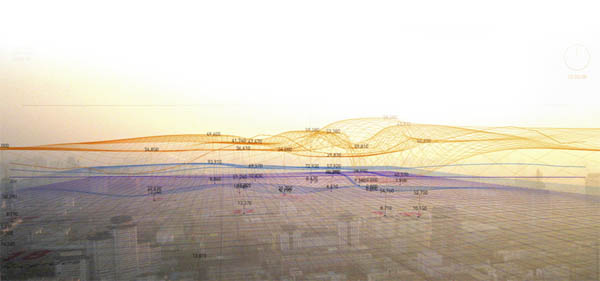
Visualization tool which aims to make visible the microscopic and invisible agents of Madrid's air (gases, particles, pollen, diseases, etc), to see how they perform, react and interact with the rest of the city. The visualization tool is a web-based dynamic model which builds up the space the components generate, where through data crossing behavior patterns emerge. The results of these data feed a physical prototype of what we have called a 'diffuse facade', a massive indicator of the air's components through a changing cloud, blurring architecture with the atmosphere it has invaded and mediating the activity of the participants it envelops.
The project proposes a platform for individual and collective awareness and decision making, where the interpretation of results can be used for real time navigation through the city, opportunistic selection of locations according to their air conditions and a base for political action.
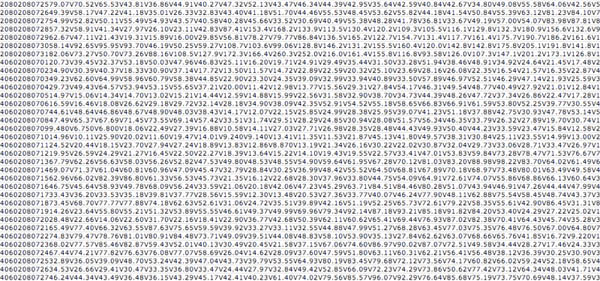
Real time data from 18 sensor stations is obtained hourly from the Madrid city council's webpage, using an open-source PHP script written by Bit Carrier.
Hourly data for the year of 2008 has been obtained from the environmental department of Madrid city council.
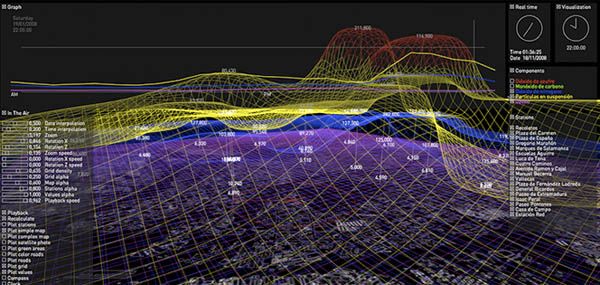
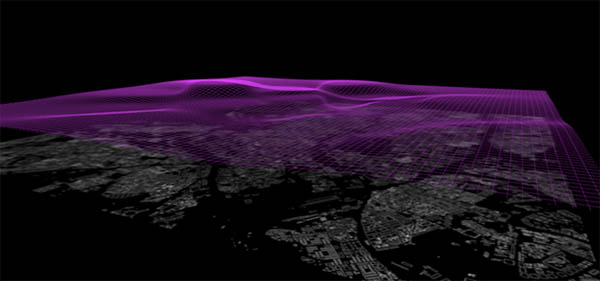
A Java web-based application (using the Processing core and OPENGL within Eclipse environment) was developed to parse the data and visualize it in an interactive way. The system allows rotation and zooming of the mapped space, plotting individual stations and components, and generating a surface using interpolation.
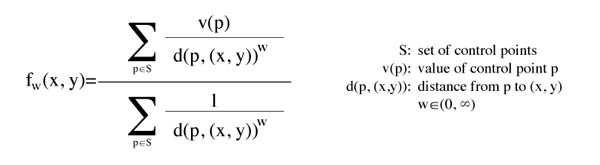
In the Air uses an interpolation function to fill the information gaps of pollutant levels in the Madrid atmosphere between sensor stations. This yields an approximate value for points that are close or not so close to the 15 stations informing this prototype. It is very important to understand that the data obtained by the interpolation is approximate, and its main purpose is to help users understand what happens throughout the city. There are several ways to obtain approximate values on points that are close to sensors. All "good" interpolations should derive a value of a point in proportion to the proximity to "known" data points.
In the Air uses an infinite set of formulas depending on a parameter w that can be specify by the (expert) user. The way the value of the parameter changes the behavior of the interpolation is directly related to how intense the influence of a value given by a data point at a specific moment on the approximation value on the whole plane. For low values of w (close to 0) the influence is lower and the approximation tends to be closer to the global average. For higher values of w (bigger than 1) approximative values are close to the value of the closest data point. (So, at the limit, it creates a Voronoy partition of the plane). Which is the best value of w that determines the best approximation? It is complicated because this value might change in time and also among gases.
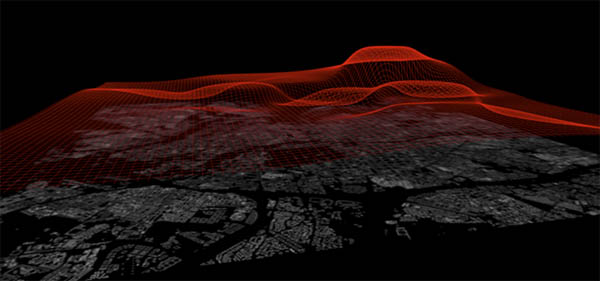
Sulfur Dioxide
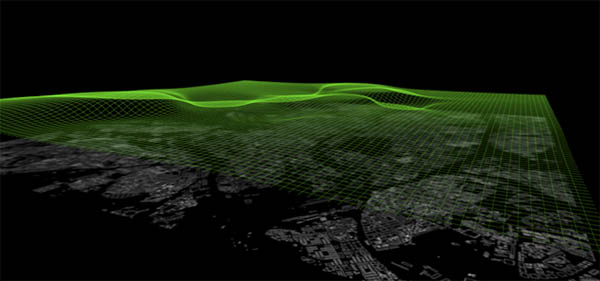
Carbon monoxide
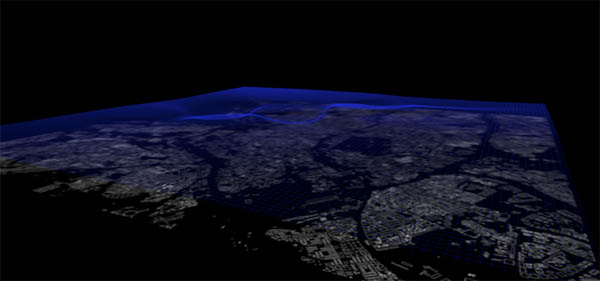
Nitrogen Dioxide
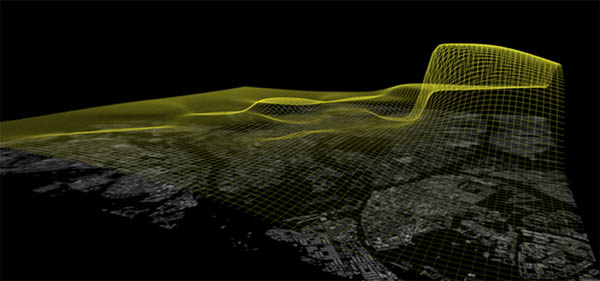
Particulae.
Ozone.
The application allows to playback evolution of hourly data at higher framerates, thus offering a tool to detect emergent patterns (because of traffic conditions, weather change, etc). The web app is located here.
-> Java source code: InTheAir.zip (8mb)
(includes database and several background satellite images) (upcoming)