Interface and Application Programming
Assignment: write an application that interfaces with an input &/or output device
For this assignment, I learned and reviewed
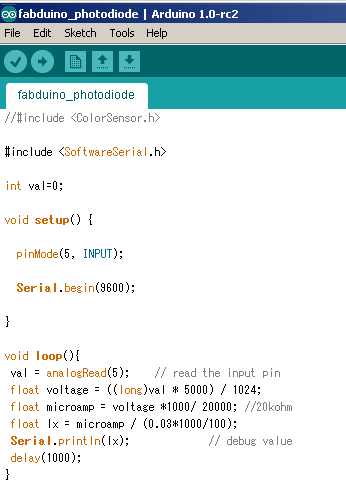
- a)how to connect values from sensors to application
- b)how to use processing and python
I decided to visualize values from phototransisor using processing and python.
[Processing]
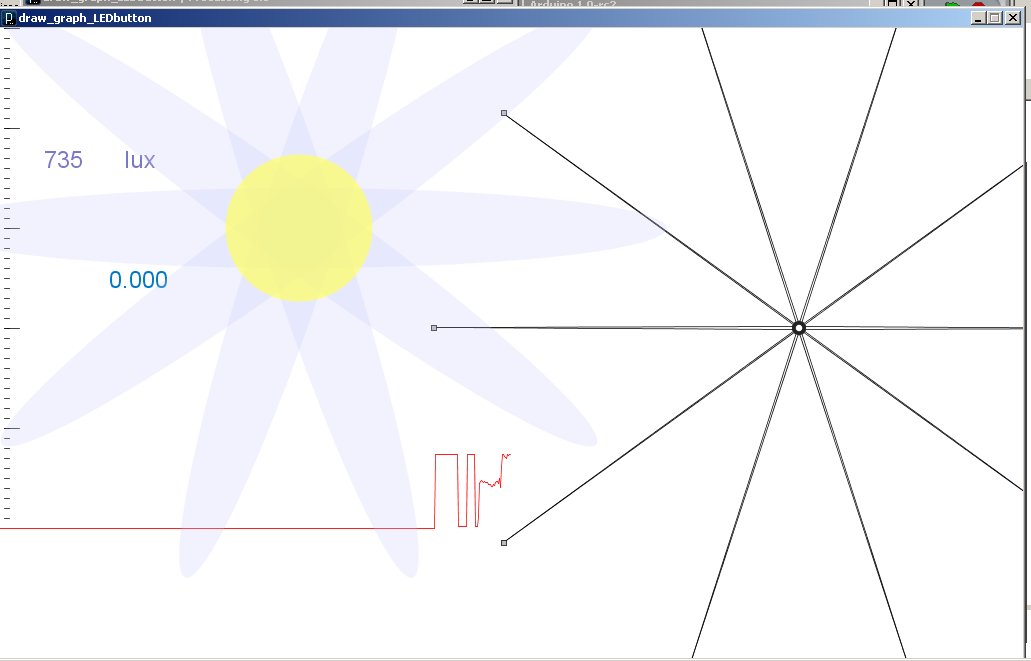
Connected a phototransistor with fabduino, I wanted to draw graphs
and flowers based on the intensity of light that is converted values from phototransistor.
Higher intensity of the light inreases # of petals and the size of flowers.
==========================================================================
//draw_graph_phototransistor
//draw graph, flowers with values from a phototransistor

import processing.serial.*;
Serial port;

// arrays to hold ellipse coordinate data
float[] px, py, cx, cy, cx2, cy2;

// global variable-points in ellipse
int pts = 4;

color controlPtCol = #222222;
color anchorPtCol = #BBBBBB;


int THSD_MNG=5000;
PFont fontA;
int NEWLINE = 10;
int GMulti = 2;
float filterX;
boolean mousePressBtn = true;
float[] valsA = new float[512];

int lux;
int i_max;

double lx_msum;
float bynd_thsd_m=0;
int byhn_thsd_n;
float theta;
float r;

void setup()
{
  size(512*2, 512*2);
  PFont fontA =createFont("SansSerif",24);
  textFont(fontA, 24);

  println("Available serial ports:");
  println(Serial.list());

  port = new Serial(this, "COM25", 9600);
  port.clear();
  port.bufferUntil(NEWLINE);

  setEllipse(50);
  frameRate(2);

}

void draw(){
  int drawheight = 250 * GMulti;
  background(255);

  fill(0, 120, 200);
  if( mousePressBtn ){
  }

  stroke(0);
  for( int i = 0; i < drawheight; i += 10 )
    line(5, i, 10, i);
  for( int i = 0; i < drawheight; i += 100 )
    line(5, i, 20, i);

 fill(120, 120, 200);

 text(int(valsA[511]),45,140);
 text(" lux",120,140);

 fill(0, 120, 200);
  stroke(255, 0, 0);
  for( int i = 0; i < 511; i++ )
    line(i, drawheight - valsA[i]/10, (i + 1), drawheight - valsA[i + 1]/10);

  int j;
  float x, y;

    drawEllipse();
    //setEllipse(int(random(3, 12)), random(-100, 150), random(-100, 150));
   // setEllipse(int(random(3, 12)), lux, random(-100, 150));
     setEllipse(lux);

    flower();
}

void serialEvent(Serial p){
  String stringData = port.readStringUntil(NEWLINE);

  port.write(65);

 println(stringData);

  if( stringData != null ){
    stringData = trim(stringData);
    float data[] = float(split(stringData, ','));
 lux=int(data[0]);
    for( int i = 0; i < 511; i++ ){
      valsA[i] = valsA[i + 1];
    }
    valsA[511] = lux;

    if( mousePressBtn ){
      port.write(65);
    }
  }
}

void mousePressed(){
  if( !mousePressBtn ){
    port.write(65);
    mousePressBtn = true;
  } else {
    mousePressBtn = false;
  }
}

// draw ellipse with anchor/control points
void drawEllipse(){
  strokeWeight(1.125);
  stroke(255);
  noFill();
  // create ellipse
  for (int i=0; i0){
      line(px[i], py[i], cx2[i-1], cy2[i-1]);
    }
    line(px[i], py[i], cx[i], cy[i]);
  }

  for ( int i=0; i< pts; i++){
    fill(controlPtCol);
    noStroke();
    //control handles
    ellipse(cx[i], cy[i], 4, 4);
    ellipse(cx2[i], cy2[i], 4, 4);

    fill(anchorPtCol);
    stroke(0);
    //anchor points
    rect(px[i], py[i], 5, 5);
  }
}

// fill up arrays with ellipse coordinate data
//void setEllipse(int points, float radius, float controlRadius){
  void setEllipse(int lux){
   int points;
    if(lux<500)
    points=5;
    else if(lux<2500)
    points=10;
    else
    points=15;

    float radius=lux/2;
    float controlRadius=random(0, 50);

  pts = points;
  px = new float[points];
  py = new float[points];
  cx = new float[points];
  cy = new float[points];
  cx2 = new float[points];
  cy2 = new float[points];
  float angle = 360.0/points;
  float controlAngle1 = angle/3.0;
  float controlAngle2 = controlAngle1*2.0;
  for ( int i=0; i2500)
i_max=8;
else
i_max=5;

for(int i = 0; i < i_max; i++) {

fill(195, 200, 250, 60);
pushMatrix();
// rotate each petal 62 degrees
rotate(radians(i*360/i_max));
ellipse(0,0,lux,80);
popMatrix();

}

fill(255, 255, 100, 180);
ellipse(0,0,lux/5,lux/5);
==========================================================================
[Python]
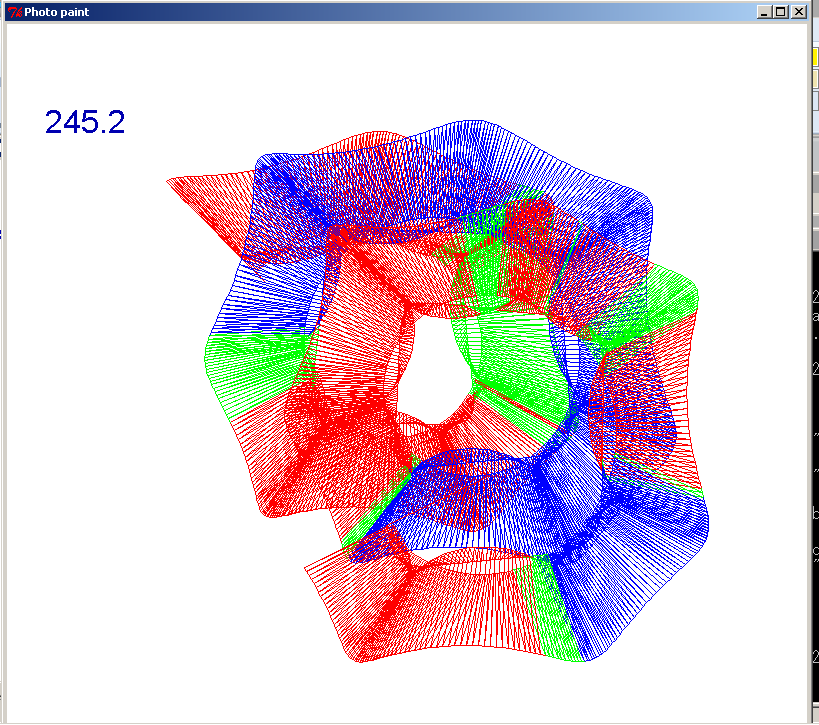
I also tried python to visualize the values from a phototransistor on the ATtiny45 board.
The color of drawing the function of cosine and sine changes based on the intensity of light.
==========================================================================
#
# photodiode.py
#
# visualize values from phototransistor using graphis
# the intensity of light change the color of the graphics
#

from Tkinter import *
import serial
import math
WINDOW = 800 # window size
eps = 0.5 # filter time constant
filter = 0.0 # filtered value

def idle(parent,canvas):
   global filter, eps
   #
   # idle routine
   #
   byte2 = 0
   byte3 = 0
   byte4 = 0
   ser.flush()
   p0_x = 400.0
   p0_y = 400.0

   p1_x = 330.0
   p1_y = 330.0

   p2_x = 250.0
   p2_y = 250.0

   p3_x = 260.0
   p3_y = 260.0

   p4_x = 250.0
   p4_y = 250.0

   p5_x = 180.0
   p5_y = 180.0

   alpha_0 = math.atan((p0_y - p1_y)/(p0_x - p1_x))
   length_0_1 = math.sqrt((p0_y - p1_y)*(p0_y - p1_y) + (p0_x - p1_x)*(p0_x - p1_x))
   alpha_1 = math.atan((p1_y - p2_y)/(p1_x - p2_x))
   length_1_2 = math.sqrt((p2_y - p1_y)*(p2_y - p1_y) + (p2_x - p1_x)*(p2_x - p1_x))

   alpha_2 = math.atan((p2_y - p3_y)/(p2_x - p3_x))
   length_2_3 = math.sqrt((p3_y - p2_y)*(p3_y - p2_y) + (p3_x - p2_x)*(p3_x - p2_x))

   alpha_3 = math.atan((p3_y - p4_y)/(p3_x - p4_x))
   length_3_4 = math.sqrt((p4_y - p3_y)*(p4_y - p3_y) + (p4_x - p3_x)*(p4_x - p3_x))

   alpha_4 = math.atan((p3_y - p5_y)/(p3_x - p5_x))
   length_4_5 = math.sqrt((p5_y - p4_y)*(p5_y - p4_y) + (p5_x - p4_x)*(p5_x - p4_x))

   for i in range(1,2000):

      while 1:
      #
      # find framing
      #
        byte1 = byte2
        byte2 = byte3
        byte3 = byte4
        byte4 = ord(ser.read())
        if ((byte1 == 1) & (byte2 == 2) & (byte3 == 3) & (byte4 == 4)):
          break
      low = ord(ser.read())
      high = ord(ser.read())
      value = 256*high + low
      filter = ((1-eps)*filter + eps*value)
      x = int(.2*WINDOW + (.9-.2)*WINDOW*filter/1024.0)
      canvas.itemconfigure("text",text="%.1f"%filter)
      alpha_0 += 0.003
      alpha_1 += 0.018
      alpha_2 -= 0.054
      alpha_3 -= 0.108
      alpha_4 += 0.018

      p0_x = 400.0
      p0_y = 400.0

      p1_x = p0_x - length_0_1 * math.cos(alpha_0)
      p1_y = p0_y - length_0_1 * math.sin(alpha_0)

      tip_locus_2_x = p2_x
      tip_locus_2_y = p2_y
      p2_x = p1_x - length_1_2 * math.cos(alpha_1)
      p2_y = p1_y - length_1_2 * math.sin(alpha_1)

      tip_locus_3_x = p3_x
      tip_locus_3_y = p3_y
      p3_x = p2_x - length_2_3 * math.cos(alpha_2)
      p3_y = p2_y - length_2_3 * math.sin(alpha_2)

      tip_locus_4_x = p4_x
      tip_locus_4_y = p4_y
      p4_x = p3_x - length_3_4 * math.cos(alpha_3)
      p4_y = p3_y - length_3_4 * math.sin(alpha_3)

      tip_locus_5_x = p5_x
      tip_locus_5_y = p5_y
      p5_x = p4_x - length_4_5 * math.cos(alpha_4)
      p5_y = p4_y - length_4_5 * math.sin(alpha_4)


      color= 'red'

      if(value>400):
        color= 'green'

      if(value>800):
        color='blue'


      canvas.create_line(p1_x, p1_y, p0_x, p0_y, tag='line_1', fill=color)
      canvas.create_line(p2_x, p2_y, p1_x, p1_y, tag='line_2', fill=color)
      canvas.create_line(p3_x, p3_y, p2_x, p2_y, tag='line_3', fill=color)
      canvas.create_line(p4_x, p4_y, p3_x, p3_y, tag='line_4', fill=color)
      canvas.create_line(p5_x, p5_y, p4_x, p4_y, tag='line_5', fill=color)
      canvas.create_line(tip_locus_2_x, tip_locus_2_y, p2_x, p2_y, fill=color)
      canvas.create_line(tip_locus_3_x, tip_locus_3_y, p3_x, p3_y, fill=color)
      canvas.create_line(tip_locus_4_x, tip_locus_4_y, p4_x, p4_y, fill=color)
      canvas.create_line(tip_locus_5_x, tip_locus_5_y, p5_x, p5_y, fill=color)
      canvas.create_line(tip_locus_2_x, tip_locus_2_y, p5_x, p5_y, fill=color)
      canvas.create_line(tip_locus_3_x, tip_locus_3_y, p4_x, p4_y, fill=color)
      canvas.update()

 # canvas.
      canvas.delete('line_1', 'line_2', 'line_3', 'line_4') # Erase

#
#  check command line arguments
#
if (len(sys.argv) != 2):
   print "command line: hello.light.45.py serial_port"
   sys.exit()
port = sys.argv[1]
#
# open serial port
#
ser = serial.Serial(port,9600)
ser.setDTR()
#
# set up GUI
#
root = Tk()
root.title('Photo paint')
root.bind('q','exit')
canvas = Canvas(root, width=WINDOW, height=WINDOW, background='white')
canvas.create_text(.1*WINDOW,.125*WINDOW,text=".33",font=("Helvetica", 24),tags="text",fill="#0000b0")
canvas.pack()
#
# start idle loop
#
root.after(100,idle,root,canvas) #loop
root.mainloop()
==========================================================================