I found in week 2 that the svg format is easy to understand. It consists of a header, which looks, in its simplest form, like this:
<svg xmlns="http://www.w3.org/2000/svg">,
followed by statements like this one:
<line x1="200" y1="200" x2="100" y2="100" stroke-width="2" stroke="black" />
which describes a line drawn from the point (200,100) to (100,100).
and ending with:
</svg>
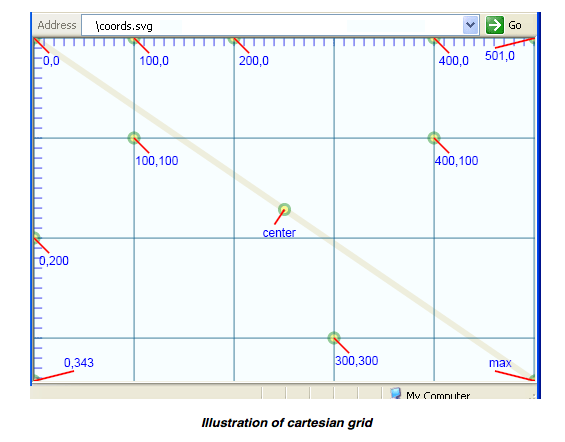
Below is the coordinate system used.
Copied from Week2: 9/24/13:
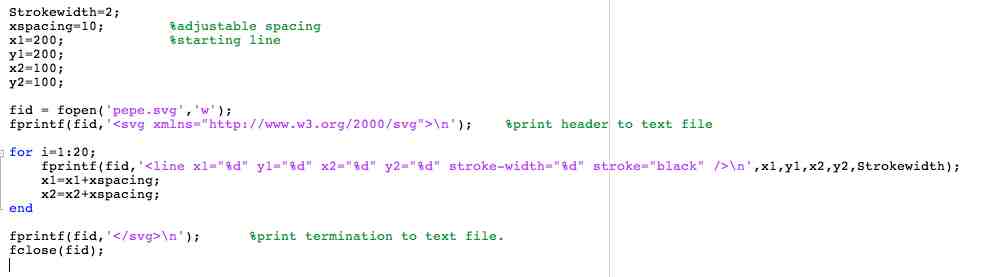
Here is a simple way to make *.svg files. Refer to the *svg Primer on the w3c.org website. Also use the kokopelli output files which give an example of setting a scale. My Matlab script writes a text file, "pepe.svg". Nice thing is that between editing and seeing the result in a browser is about two clicks.
Here is the svg file:
<svg xmlns="http://www.w3.org/2000/svg">
<line x1="200" y1="200" x2="100" y2="100" stroke-width="2" stroke="black" />
<line x1="210" y1="200" x2="110" y2="100" stroke-width="2" stroke="black" />
<line x1="220" y1="200" x2="120" y2="100" stroke-width="2" stroke="black" />
<line x1="230" y1="200" x2="130" y2="100" stroke-width="2" stroke="black" />
<line x1="240" y1="200" x2="140" y2="100" stroke-width="2" stroke="black" />
<line x1="250" y1="200" x2="150" y2="100" stroke-width="2" stroke="black" />
<line x1="260" y1="200" x2="160" y2="100" stroke-width="2" stroke="black" />
<line x1="270" y1="200" x2="170" y2="100" stroke-width="2" stroke="black" />
<line x1="280" y1="200" x2="180" y2="100" stroke-width="2" stroke="black" />
<line x1="290" y1="200" x2="190" y2="100" stroke-width="2" stroke="black" />
<line x1="300" y1="200" x2="200" y2="100" stroke-width="2" stroke="black" />
<line x1="310" y1="200" x2="210" y2="100" stroke-width="2" stroke="black" />
<line x1="320" y1="200" x2="220" y2="100" stroke-width="2" stroke="black" />
<line x1="330" y1="200" x2="230" y2="100" stroke-width="2" stroke="black" />
<line x1="340" y1="200" x2="240" y2="100" stroke-width="2" stroke="black" />
<line x1="350" y1="200" x2="250" y2="100" stroke-width="2" stroke="black" />
<line x1="360" y1="200" x2="260" y2="100" stroke-width="2" stroke="black" />
<line x1="370" y1="200" x2="270" y2="100" stroke-width="2" stroke="black" />
<line x1="380" y1="200" x2="280" y2="100" stroke-width="2" stroke="black" />
<line x1="390" y1="200" x2="290" y2="100" stroke-width="2" stroke="black" />
</svg>
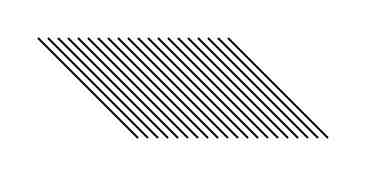
Here is the output as seen by a browser:
I need to learn how this translates to real units. An example is in the kokopelli output *.svg file.
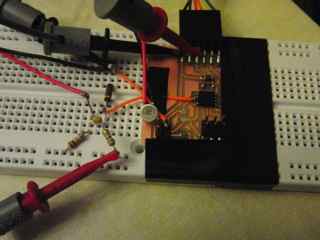
Below is the tiny45 board from the input devices week that I modified with components offboard for microphone, including the microphone. The microphone is on the lower left of the board.
Sung vowel (ee) at ~450 Hz. Time per point is determined by the AVR program.
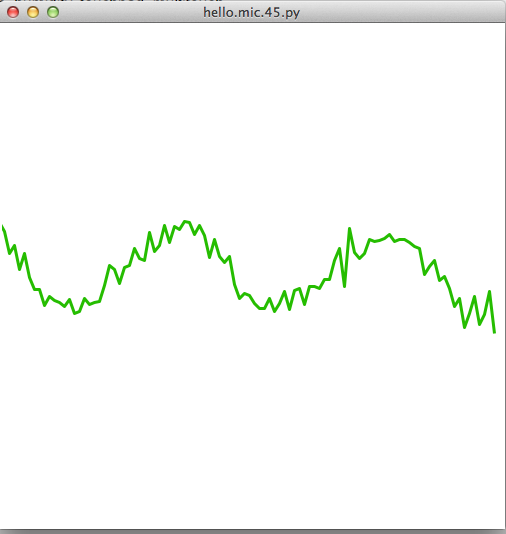
This works. It uses Tkinter, which I downloaded with the standard installation of Python from the Python website. Now I would like to learn enough Python to modify this code for my own purposes. Neil has pointed out the Python tutorial on the python.org website. Looks good. For plotting and data manipulation, looks like I will want to use:
3. NumPy and matplotlib, which are two extensions that are said to create Matlab-like environment.
and matplotlib.