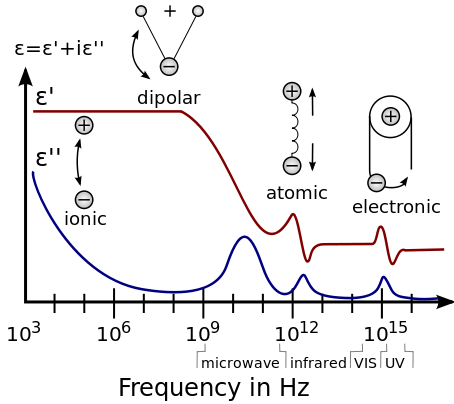
Dielectric spectroscopy (sometimes called impedance spectroscopy), and also known as electrochemical impedance spectroscopy (EIS), measures the dielectric properties of a medium as a function of frequency. It is based on the interaction of an external field with the electric dipole moment of the sample, often expressed by permittivity/impedance.
This week I will try to do impedance measurements on liquids. To be more specific, I will use two electrodes and perform capacitance and
resistance measurements in DC mode. My goal is to be able to discriminate between different liquids, like water and coffee. This readout
will be a test for my final project, where I will try to get the frequency response out of a very fast step response.
Step 1: Creating a capacitive sensing board
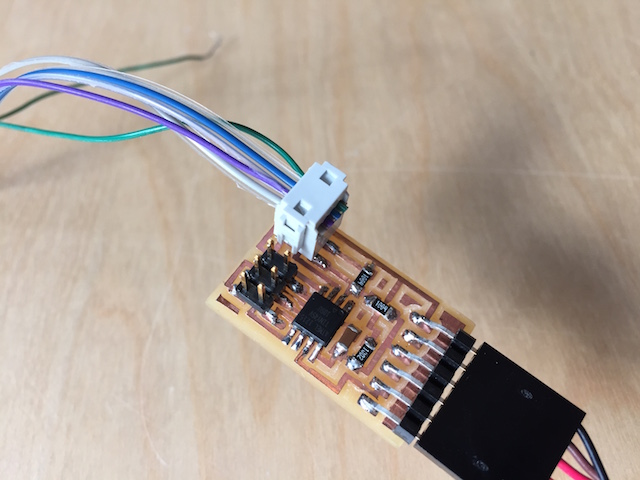
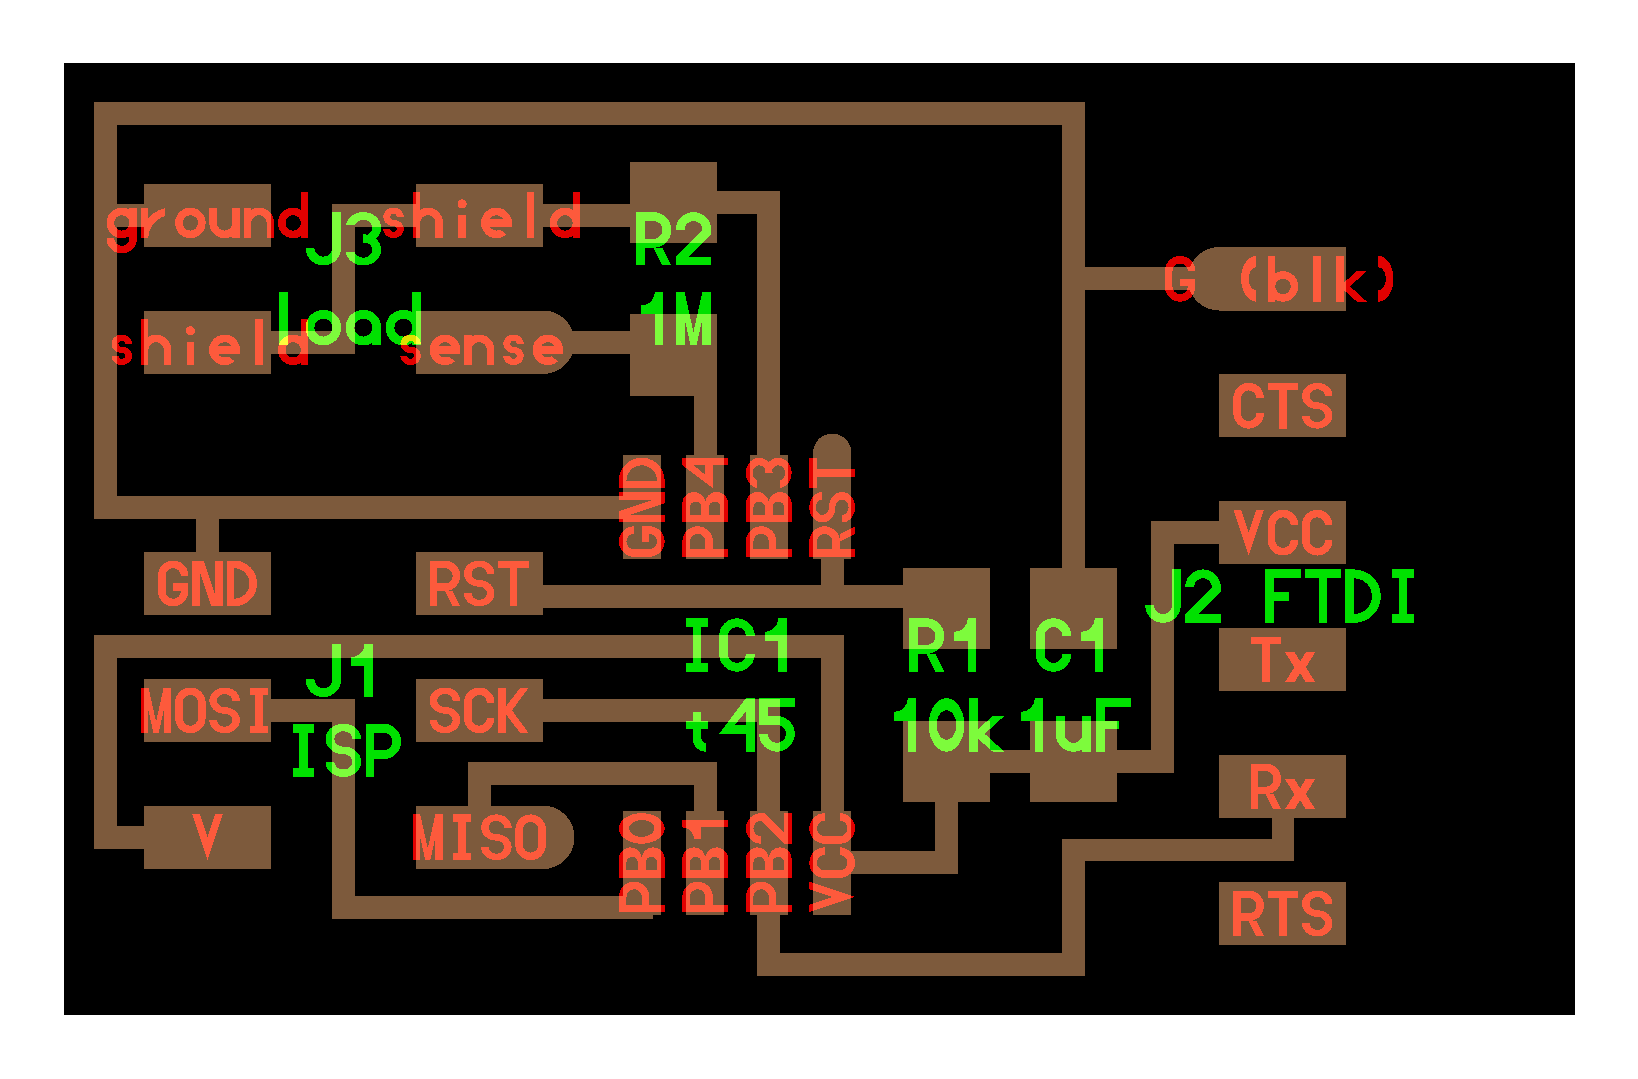
I wanted to move to the measurement phase as fast as possible, so I decided to replicate the pre-designed capacitance measurement
board from the fab archive. The fabrication
was straightforward using the 1/64 and 1/32 inch endmills. I find it very interesting that with such a minimalistic design you can
do measuerments that you can couple them with interesting phenomenae as touch and proximity sensing. For the interface with the electrodes
I used a 2x2 header joining the two ground (shield) pins with a blob of solder. The other two pins where connected to the electrodes with wires.
Step 2: Serial Communication between attiny and Matlab
Thinking forward, I will have to run classification algorithms on the extracted data from the measurements, so that I can classify
the different materials or state of materials presented to the device. Thus, I decided to get the data from the device straight to
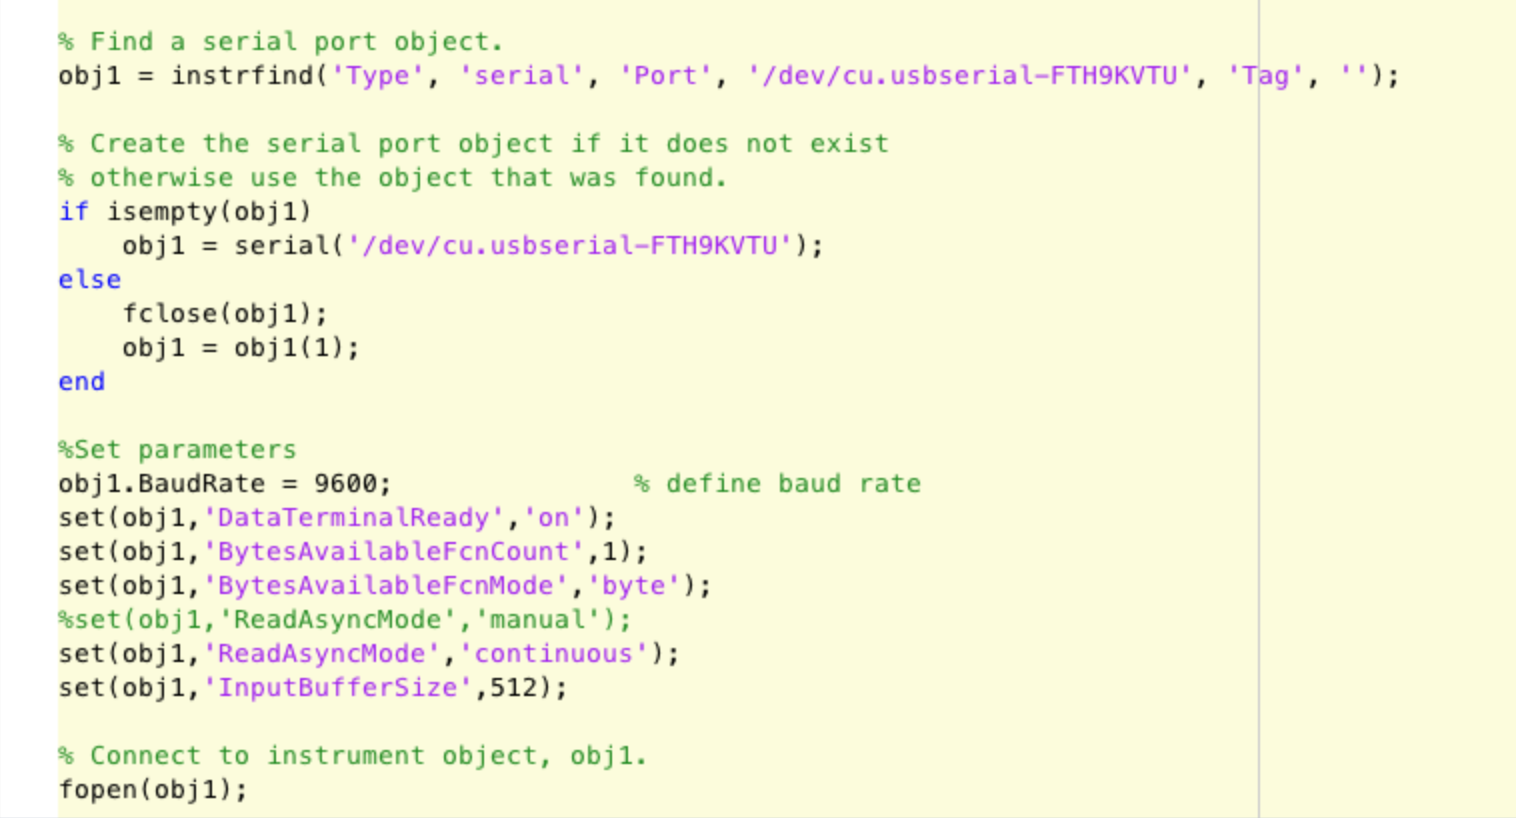
Matlab, where my classification algorithms will run. In order to communicate with the device in Matlab, you have to create a serial instrument, using the
command serial and specifying the port on which the instrument is connected. It was a bit tricky, at first, to find the correct settings for the buffer
and the reading mode (asychronous vs synchronous) but in the
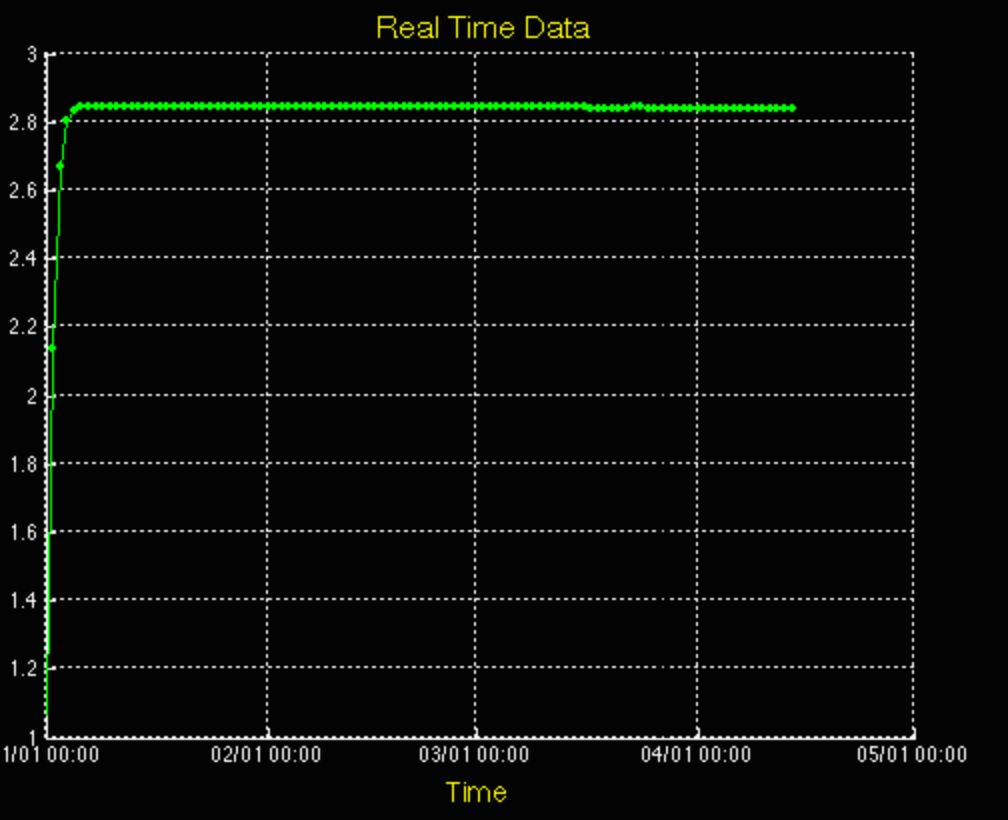
end everything worked happily. Having a big buffer of 512 bytes and reading continuously, I had enough time to plot the incoming
measurements on a graph and do some rudimentary processing. I will elaborate on the plotting in the applications week as it is more relevant there.
One thing I noticed was that running the python application at the same time is not possible, as they read both from the same
serial buffer.
** Click the image to see the port from python to Matlab **
Benchmark: Rise Time, Fall time and capacitance
** Click the image to toggle between single vs time .**
Step 3: Creating the measurment device.
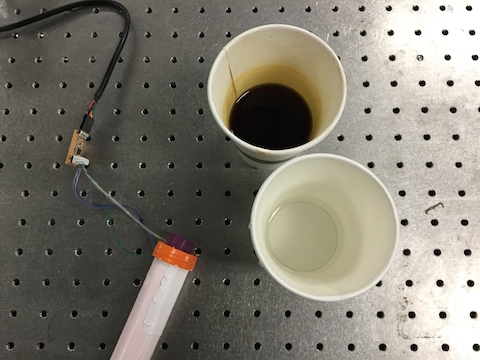
To perform capacitance measurements you need two electrodes, inbetween which the material to be tested is placed. I decided to
make the simples device I could in order to be able to measure liquids and ultimately came up with the design you can see in the
image on the right. Two test tubes of different sizes, one into the other, with a copper coating on the surfaces. As I didn't care about
the exact dielectric constant value, I disregarded the excess plastic between the material and the electrode. All I have to do is to
carefully calculate the volume of liquid that would enter the created chamber, which I did with a third test tube. I performed empty (air)
measurements and the capacitance indicator was stable over the course of 1 hour.
Step 4: Is it coffee, or is it water ?
Finally it was time to see if I can actually discriminate between liquids using this simple measurement coupled with this primitive
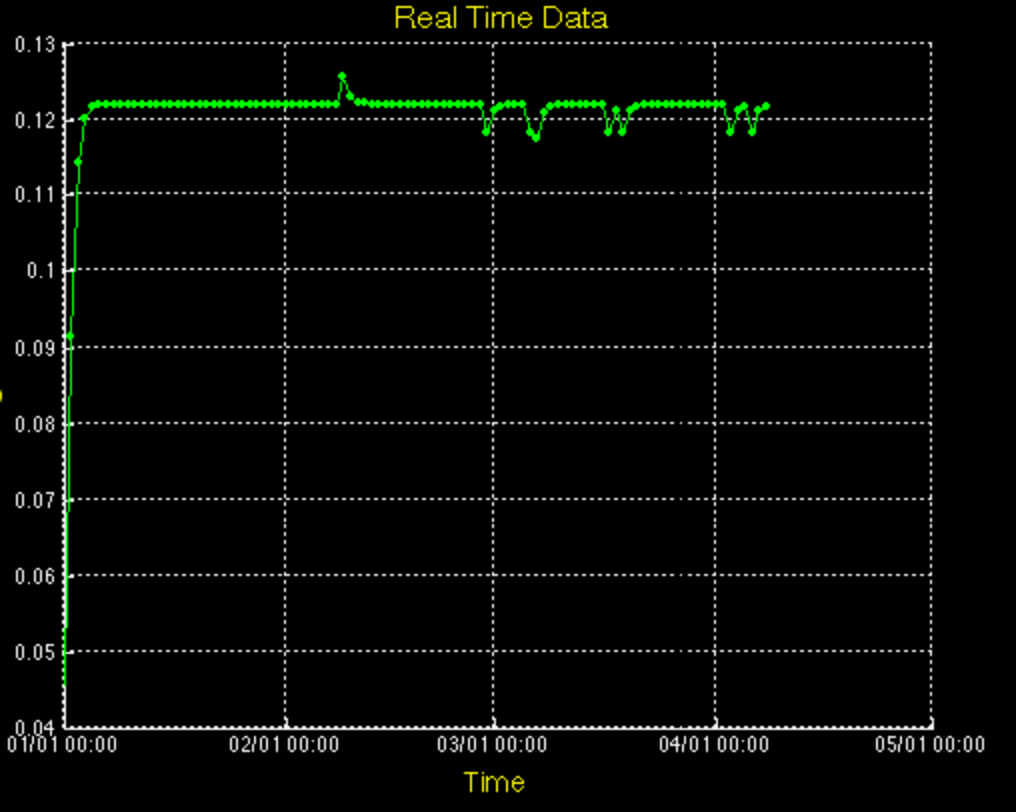
electrode design. At first I poured 10ml of water (room temperature) and closed the cap. I left the measurement runing for about half an hour, and the value was
stable at 0.12V (arbitrary volt difference, analogous to capacitance). Afterwards, I emptied the vials and dried them, and then filled them with
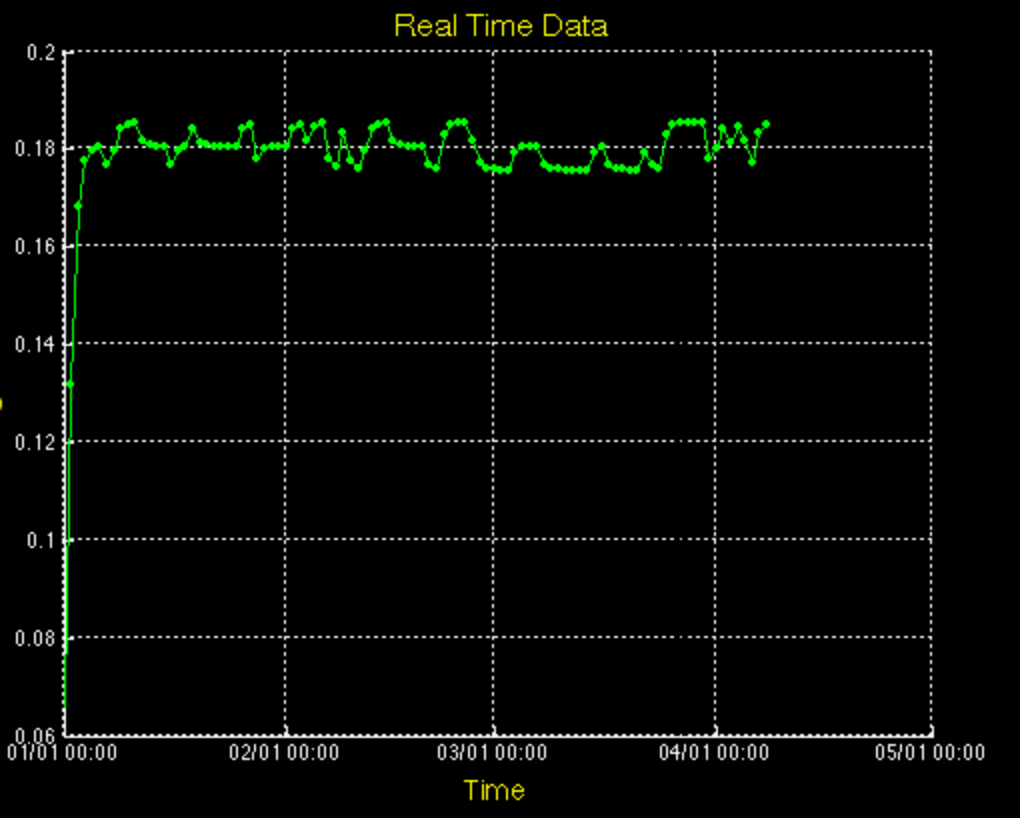
10ml American coffee at room temperature. After again half an hour of running time, the value was stable at 0.18V! Voila! Water is different from coffee! Actually coffee
has bigger, non-polar molecules in its composition, thus probably lowering the ability of water to store electrical energy.
Yet, in order for me to built a classification algorithm, there must be consistency between the water vs coffee measurements. After trying again
with the same quantities of coffe and water, the results were almost identical (2%, 4% deviation from initial values for water,coffee respectively), which is
hopeful. I will continue the measurements and expand the list with different liquids.
