3D Accelerometer animated globe
11. Interface and Application Programming
For this week, I wanted to be able to animate and rotate in 3D a globe representing the Earth with a 3D accelerometer. I wanted to use a nice d3 code that can be seen at the top of this page. It is a code that uses the mouse input to rotate the globe:
<script align-center>

					var width = 960,
					    height = 500;

					var projection = d3.geo.orthographic()
					    .scale(250)
					    .translate([width / 2, height / 2])
					    .clipAngle(90);

					var path = d3.geo.path()
					    .projection(projection);

					var λ = d3.scale.linear()
					    .domain([0, width])
					    .range([-180, 180]);

					var φ = d3.scale.linear()
					    .domain([0, height])
					    .range([90, -90]);

					var svg = d3.select("body").append("svg")
					    .attr("width", width)
					    .attr("height", height);

					svg.on("mousemove", function() {
					  var p = d3.mouse(this);
					  projection.rotate([λ(p[0]), φ(p[1])]);
					  svg.selectAll("path").attr("d", path);
					});

					d3.json("world-110m.json", function(error, world) {
					  if (error) throw error;

					  svg.append("path")
					      .datum(topojson.feature(world, world.objects.land))
					      .attr("class", "land")
					      .attr("d", path);
					});
					</script>
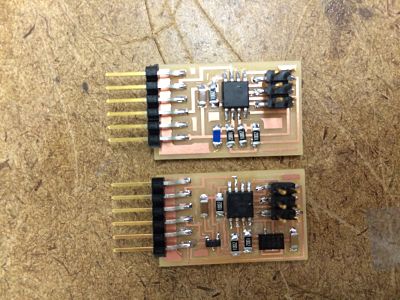
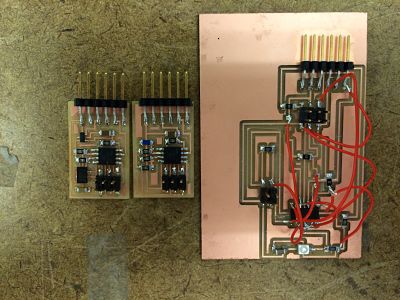
I thus wanted to replace the mouse input by a 3D accelerometer. The first step was to actually mill and stuff a 3D accelerometer board to be able to control de globe. With that, I also wanted to familiarize with the temperature sensor that I would probably use for the final project, so I also printed it. In case the accelerometer board would not work I could have a back-up. I could also use my light sensor board I designed (and hacked a lot) last week.
The next step was to get familiarize with the interface language. The workflow for using the accelerometer board to pilot the d3 animation was:
JavaScript on web page → WebSocket → node.js server → npm serial module → FTDI Driver → AVR chip
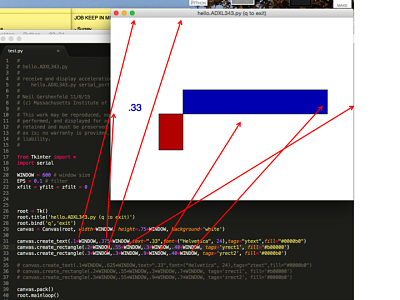
But first, I wanted to gain some insight into different graphic and interface program. I first looked at the python code written during the input device week and played with it: played with the Canvas function of rectangle, location, etc... The following figure shows some characteristics of those functions
Then, I wanted to get familiar with Processing to actually code an interface for my bike seat project. Basically, I wanted to use the different sensors that would be on the board (light, temperature and pressure) to pilot the seat heater and LED of the bike. I thus designed a very quick (and not nice) application that I started to pilot with the mouse (instead of with a board): when I clicked on the different button materializing the sensors, it would turn the seat "on" (marking it red) if I cliked on the seat, representing pressure. The following video shows a demonstration of it. It did not worked very well and the application was not very clean.
Then, I really wanted to get familiar with the d3 interface. Here are the different steps:
- Install node (tutorial)
- Install npm, node's package manager
- Install node serialport
- Install node ws (websocket)
- Navigate to the folder where you have both your project_name.js and your project_name.html and type "node project_name.js"
Unfortunately, I had to leave and the accelerometer board I had broke in the plane so I could not use it anymore as an input. I also focused a lot on the final project and thus did not have a lot of time to dedicate on finalizing the interface project