from __future__ import division
from numpy import *
%pylab inline
style.use('bmh')
cols = ['#348ABD', '#A60628', '#7A68A6', '#467821','#D55E00','#CC79A7', '#56B4E9', '#009E73', '#F0E442', '#0072B2']
Stiffness vs. Resin type
from IPython.display import HTML
HTML("""
<video width="640" height="480" controls>
  <source src="springback-small.mp4" type="video/mp4">
</video>
""")
l0 = 86*1e-3 #m
w0 = 35*1e-3 #mm
m = [11.17, 11.03, 10.71, 10.33, 11.32, 11.16, 22.57, 21.83, 26.23, 23.96] #grams
thickness = [2.58, 2.56, 2.49, 2.45, 2.49, 2.58, 3.57, 3.38, 4.1, 3.66] #thickness
thickness = [1e-3*t for t in thickness] #scale to m
resin = [
    'Boatyard Polyester','Boatyard Polyester',
    'Super Sap','Super Sap',
    'West Systems 205','West Systems 205',
    'Aqua Resin, Painted','Aqua Resin, Painted',
    'Aqua Resin, Dipped','Aqua Resin, Dipped'
]
tests = [1, 1, 2, 3, 4, 5, 6, 7, 8, 9]
colors = [0,0,1,1,2,2,3,3,4,4]
fn = lambda i: 'instron/Specimen_RawData_%d.csv'%(i+2)
data = []
for i in range(10):
    ind = tests[i]-1
    record = {'name': resin[ind], 'mass':m[ind], 'thickness':thickness[ind],'color':cols[colors[ind]]}
    with open(fn(i), 'r') as f:
        f.readline();f.readline(); #strip header
        spec_data = []
        for l in f.readlines():
             spec_data.append(map(float,l.strip('\n').split(',')))
        spec_data = asarray(spec_data)
        spec_data[:,1] -= spec_data[0,1] #subtract initial displacement
        spec_data[:,1] *= -1 #make positive
        spec_data[:,2] *= -1 #make positive
        spec_data[:,1] *= 1e-3 #scale displacement to meters
        spec_data[:,1] *= (1/l0) #scale displacement by l0 to get unitless
        spec_data[:,2] *= (l0**2)/(4*w0*thickness[ind]**3) #scale force to get pressure
        record['data'] = spec_data

    data.append(record)
Plotting Bending stiffness
figure(figsize=(8,6))
used_labels = []
for record in data:
    plot( record['data'][:,1], record['data'][:,2], c=record['color'], label=record['name'] if record['name'] not in used_labels else '')
    used_labels.append(record['name'])
xlim([0,.1])
ylim([0,3e8])
#by_label = OrderedDict(zip(gca().get_legend_handles_labels())) #reduce duplicate legend entries
#legend(by_label.values(), by_label.keys())
legend(loc=(1.01,.01))
#legend(loc='lower right')
xlabel('$d/L$ (unitless)')
ylabel('$(FL^2)/(4wh^3)$ (Pa)')
title('Bending stiffness of Composite Coupons')

Plotting Specific Bending stiffness
figure(figsize=(8,6))
used_labels = []
for record in data:
    plot( record['data'][:,1], record['data'][:,2]/record['mass'], c=record['color'], label=record['name'] if record['name'] not in used_labels else '')
    used_labels.append(record['name'])
xlim([0,.1])
ylim([0,2.5e7])
#by_label = OrderedDict(zip(gca().get_legend_handles_labels())) #reduce duplicate legend entries
#legend(by_label.values(), by_label.keys())
legend(loc=(1.01,.01))
#legend(loc='lower right')
xlabel('$d/L$ (unitless)')
ylabel('$(FL^2)/(4wh^3)/m$ (Pa/g)')
title('Specific Bending stiffness of Composite Coupons')

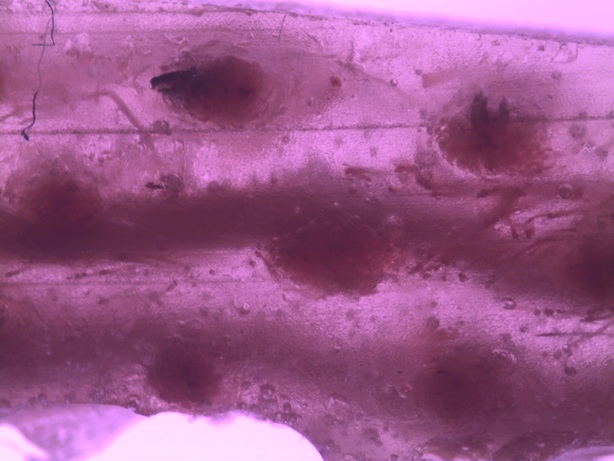
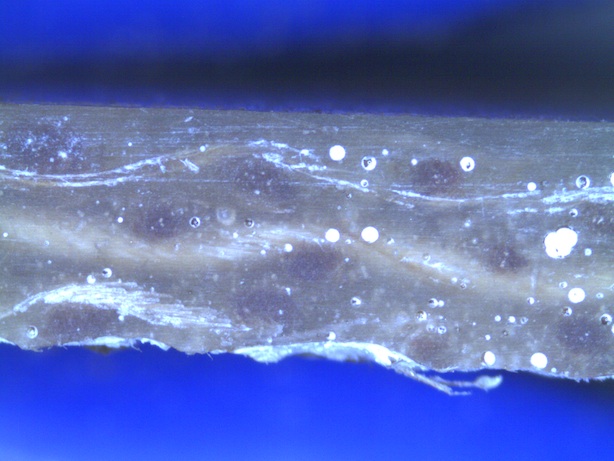
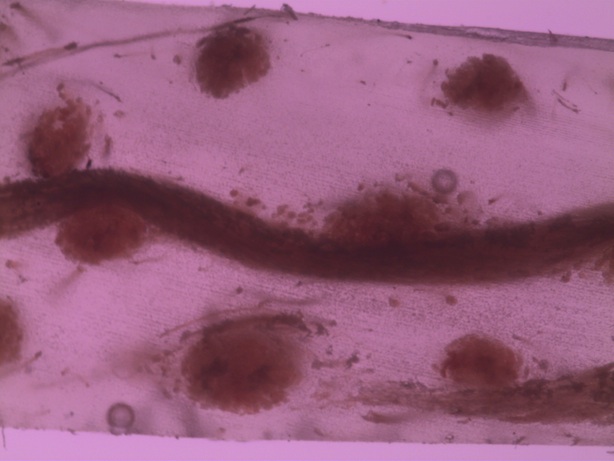
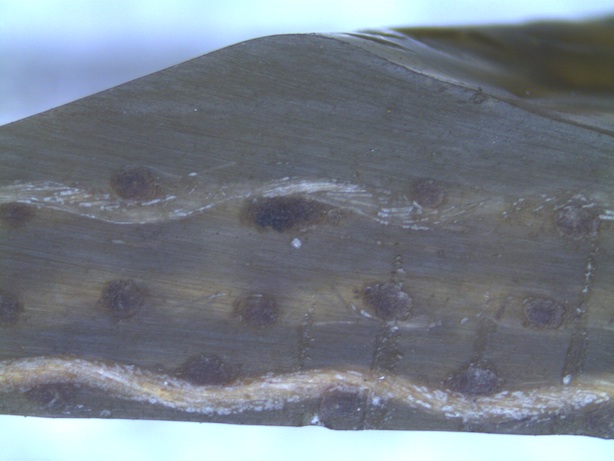
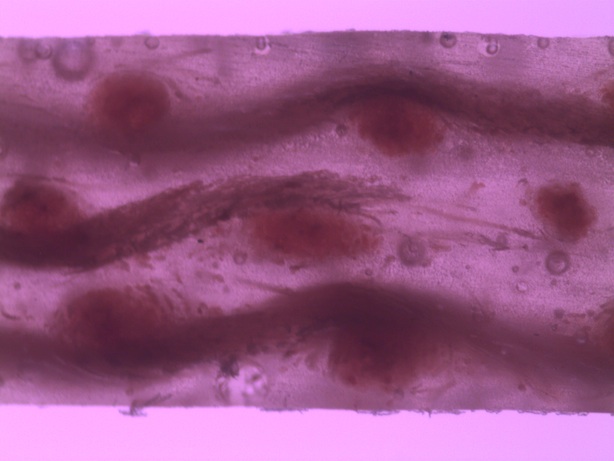
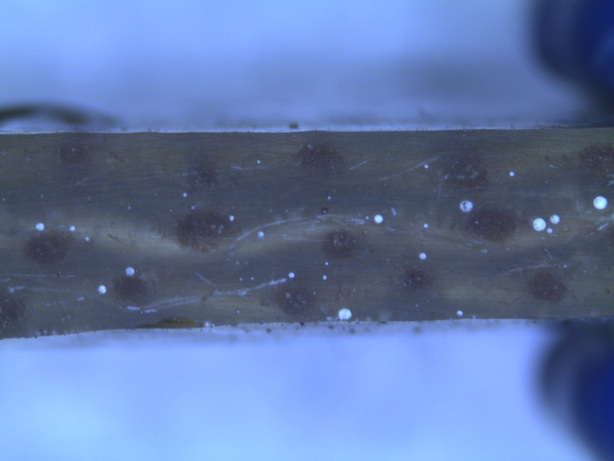
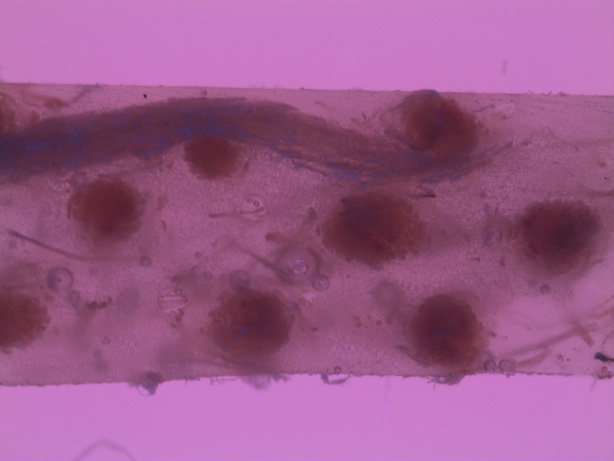
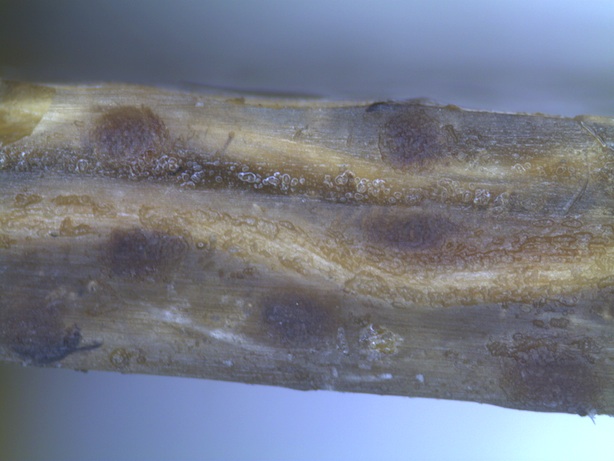
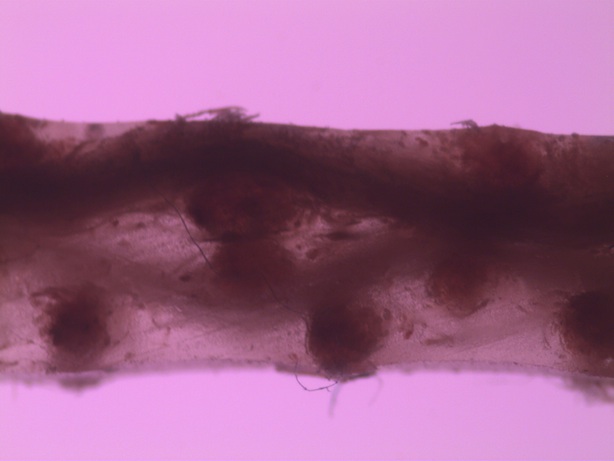
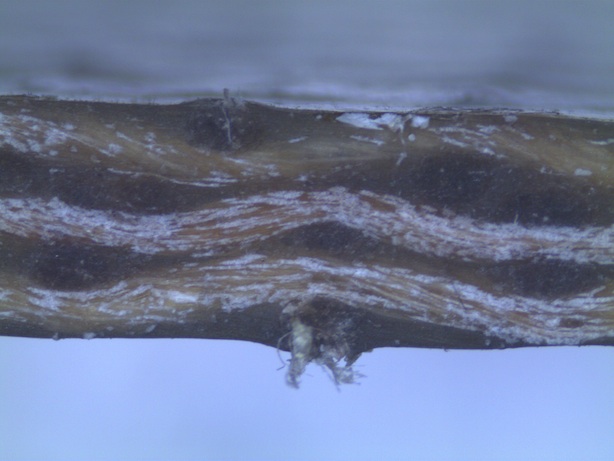
Microscopy for Compaction Method
Here we compare a few proposed methods for easy hand layup. First, dry fiber is wet out with Super Sap epoxy. In the first method, coupons are squeegied to remove excess resin and let to cure. In the second, coupons are placed under hydrostatic compaction (a garbage bag). In the third, coupons are placed in a vacuum bag (Space Saver) and put under vacuum. In the fourth, coupons are covered with a perforated bleeder layer, followed by a breather layer (quilting batting), and then placed under vacuum as before. In the final method, coupons are placed between two boards and clamped.
The microscope photographs show approximately 3mm thick samples with back and front illumination. A helpful way to gauge compaction is to look at the distance between fibers running in plane and out of plane.
The resounding message of the microscopy and instron testing is that providing an easy path for resin evacuation is almost more important than compaction force.
Squeegie
 |
 |
Hydrostatic
 |
 |
Vacuum without Bleeder/Breather
 |
 |
Vacuum with Bleeder/Breather
 |
 |
Clamps
 |
 |
Specific Stiffness vs. Compaction Method
labels = [
    'Squeegie','Squeegie',
    'Hydrostatic','Hydrostatic',
    'Vacuum without bleeder','Vacuum without bleeder',
    'Vacuum with bleeder','Vacuum with bleeder',
    'Clamps','Clamps']
l0 = 75*1e-3 #m, three point bending width
#dimensions to use for density
lengths = 1e-3*asarray([111.38,109.53,110.94,110.37,110.15,112.64,105.83,106.40,111.15,110.24])
widths = 1e-3*asarray([[33.08,33.61],[32.78,33.40],[32.09,32.78],[31.83,32.96],[32.37,32.98],[33.05,33.10],[32.63,34.13],[33.23,33.55],[32.32,33.02],[33.58,32.34]]) #mm
thicknesses = 1e-3*asarray([
        [3.76,3.91,4.15],
        [3.65,3.95,3.76],
        [3.53,4.32,3.71],
        [3.98,4.10,4.49],
        [3.77,3.94,3.84],
        [3.70,4.16,3.93],
        [3.29,3.27,3.05],
        [2.87,3.03,2.98],
        [1.96,2.35,2.42],
        [2.23,2.53,2.31],
    ]) #thickness at end, middle, other end.
masses = [14.96,13.72,16.00,17.30,15.83,16.65,12.67,11.53,8.76,9.61] #grams
#plotting
colors = [0,0,1,1,2,2,3,3,4,4]
fn = lambda i: 'instron-compaction/Specimen_RawData_%d.csv'%(i+1)
data = []
for ind in range(10):
    record = {'name': labels[ind],
              'mass':masses[ind],
              'thickness':sum(thicknesses[ind])/3,
              'width':sum(widths[ind])/2,
              'length':lengths[ind],
              'color':cols[colors[ind]]}
    record['volume'] = record['length']*record['width']*record['thickness']
    record['density'] = record['mass']/record['volume']
    with open(fn(ind), 'r') as f:
        f.readline();f.readline(); #strip header
        spec_data = []
        for l in f.readlines():
             spec_data.append(map(float,l.strip('\n').split(',')))
        spec_data = asarray(spec_data)
        spec_data[:,1] *= -1 #make positive
        spec_data[:,2] *= -1 #make positive
        spec_data -= spec_data[0] #subtract initial displacement
        spec_data[:,1] *= 1e-3 #scale displacement to meters
        spec_data[:,1] *= (1/l0) #scale displacement by l0 to get unitless
        spec_data[:,2] *= (l0**2)/(4*record['width']*record['thickness']**3) #scale force to get pressure units
        record['data'] = spec_data

    data.append(record)
#Bending Stiffness
figure(figsize=(10,8))
used_labels = []
for record in data:
    plot( record['data'][:,1], record['data'][:,2], c=record['color'], label=record['name'] if record['name'] not in used_labels else '')
    used_labels.append(record['name'])
xlim([0,.11])
ylim([0,4e8])

legend(loc='upper left')
xlabel('$d/L$ (unitless)')
ylabel('Bending Stress $(FL^2)/(4wh^3)$ (Pa)')
title('Bending stiffness of Composite Coupons')

#Specific Stiffness
figure(figsize=(10,8))
used_labels = []
for record in data:
    plot( record['data'][:,1], record['data'][:,2]/record['density'], c=record['color'], label=record['name'] if record['name'] not in used_labels else '')
    used_labels.append(record['name'])
xlim([0,.11])
ylim([0,350])

legend(loc='upper left')
xlabel('$d/L$ (unitless)')
ylabel(r'Specific Bending Stress $(FL^2)/(4wh^3)/\rho$ $(Nm/kg)$')
title('Specific Bending stiffness of Composite Coupons')

Specific Stiffness vs. Fiber Type
We compared carbon fiber cloth with super sap in a vacuum bag, fiberglass cloth with super sap in a vacuum bag, and comingled fiberglass and polypropelyne fibers, thermally consolidated under pressure.
labels = [
    'Carbon Super Sap','Carbon Super Sap',
    'Fiberglass Super Sap','Fiberglass Super Sap',
    'Fiberglass Polypropylene','Fiberglass Polypropylene']
l0 = 75*1e-3 #m, three point bending width
#dimensions to use for density
lengths = asarray([4.58,4.46,4.68,4.53,4.5,4.47])/39.3
widths =  asarray([1.5,1.46,1.51,1.39,1.56,1.57])/39.3
thicknesses = asarray([.066,.061,.113,.123,.040,.044])/39.3 #thickness
masses = [7.3,7.0,14.0,14.3,6.1,6.7] #grams
#plotting
colors = [0,0,1,1,2,2,3,3]
fn = lambda i: 'instron-fiber/Specimen_RawData_%d.csv'%(i+1)
#data = [] #clear data
data = [record for record in data if record['name']=='Vacuum without bleeder'] #keep vacuum from before
for record in data:
    record['name'] = 'Burlap Super Sap'
    record['color'] = cols[4]
for ind in range(6):
    record = {'name': labels[ind],
              'mass':masses[ind],
              'thickness':thicknesses[ind],
              'width':widths[ind],
              'length':lengths[ind],
              'color':cols[colors[ind]]}
    record['volume'] = record['length']*record['width']*record['thickness']
    record['density'] = record['mass']/record['volume']
    with open(fn(ind), 'r') as f:
        f.readline();f.readline(); #strip header
        spec_data = []
        for l in f.readlines():
             spec_data.append(map(float,l.strip('\n').split(',')))
        spec_data = asarray(spec_data)
        spec_data[:,1] *= -1 #make positive
        spec_data[:,2] *= -1 #make positive
        spec_data -= spec_data[0] #subtract initial displacement
        spec_data[:,1] *= 1e-3 #scale displacement to meters
        spec_data[:,1] *= (1/l0) #scale displacement by l0 to get unitless
        spec_data[:,2] *= (l0**2)/(4*record['width']*record['thickness']**3) #scale force to get pressure units
        record['data'] = spec_data

    data.append(record)
def smooth(y, box_pts):
    box = np.ones(box_pts)/box_pts
    y_smooth = np.convolve(y, box, mode='same')
    return y_smooth
#Bending Stiffness
figure(figsize=(10,8))
used_labels = []
for record in data:
    plot( record['data'][:,1], smooth(record['data'][:,2],5), c=record['color'], label=record['name'] if record['name'] not in used_labels else '')
    used_labels.append(record['name'])
#xlim([0,.11])
ylim([0,4e8])

legend(loc='upper left')
xlabel('$d/L$ (unitless)')
ylabel('Bending Stress $(FL^2)/(4wh^3)$ (Pa)')
title('Bending stiffness of Composite Coupons')
#Specific Stiffness
figure(figsize=(10,8))
used_labels = []
for record in data:
    plot( record['data'][:-7,1], smooth(record['data'][:,2],7)[:-7]/record['density'], c=record['color'], label=record['name'] if record['name'] not in used_labels else '')
    used_labels.append(record['name'])
xlim([0,.11])
ylim([0,600])

legend(loc='upper left')
xlabel('$d/L$ (unitless)')
ylabel(r'Specific Bending Stress $(FL^2)/(4wh^3)/\rho$ $(Nm/kg)$')
title('Specific Bending stiffness of Composite Coupons')
