
The last two weeks have been low bandwith for me since we had a demo coming up, but I was excited to play around with Processing this week! I tried to take the boards I made across the border to Canada when I went home for Thanksgiving but that didn’t go so well with TSA, so I was stuck doing the homework in a couple days once I got back.
I had used Python a fair bit for data analysis and for research and had wanted to play with Processing for a while. So I thought I’d take Thanksgiving to go through some Processing tutorials and start building some cool visualizations. I figured I could build them in a generalized way and then use the serial values from my capacitive touch board to drive the values. This was my work around for not having the boards accessible to me in Canada!
Some good tutorials for Processing that I found helpful were:
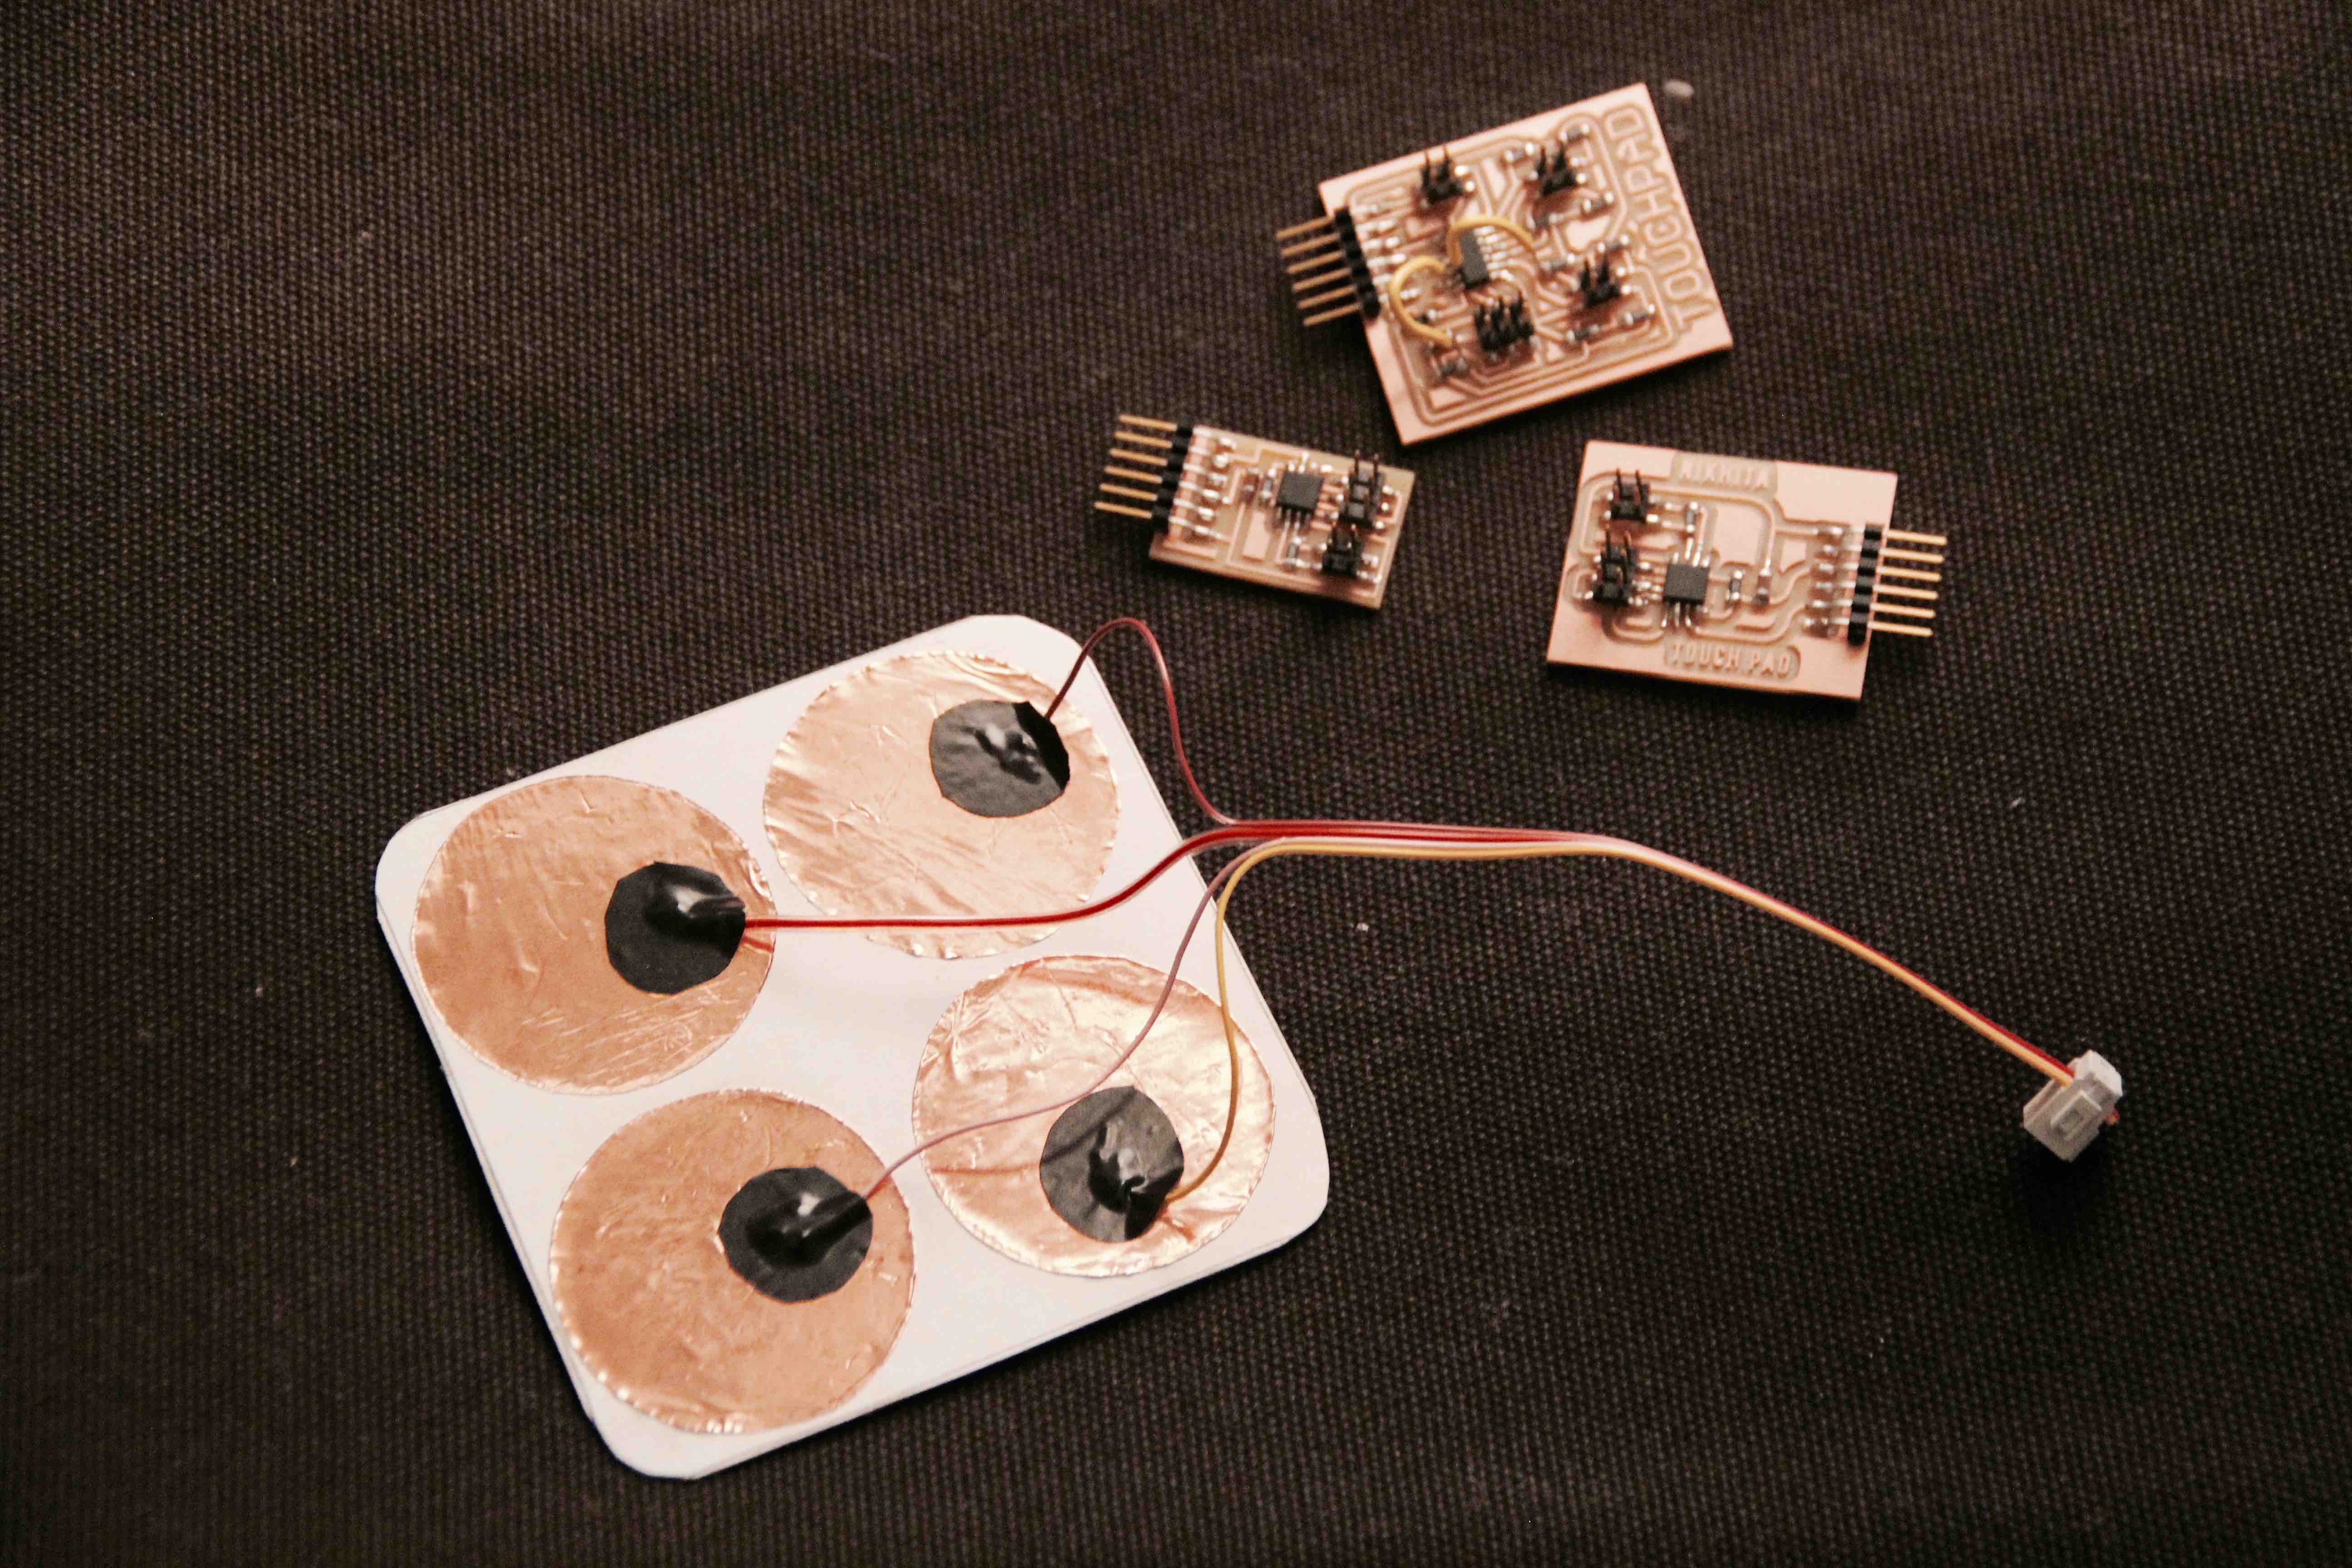
I started with the capacitive touch board I made in Input Devices week using Neil’s board as a model. I downloaded Processing and played around writing a few different programs. The examples were super helpful to experiment with.

I tried a bunch of different visualizations using the “Serial.list()” output from the board.
Some of the outputs I came up with are on the right. I noticed after printing the output values that sometimes where are 0s or really low values between larger values. I added in a check to make sure the value was >10 to compensate for this. I am still a bit confused as to why these happen so I think I need to spend some more time going through Neil’s C code which I originally used to program the board.
I also bought a good intro book for electronics for inventors so I’ve been spending some time going through that so I can really understand the basics!

visualization 1: diameter is equal to value

visualization 2: height is equal to value

visualization 3:

visualization 4: diameter is equal to value