Visualizing Strength of Magnetic Fields
This week was about application and interface programming. It was Thanksgiving, so there wasn't as much need to gain access to lab to complete our assignments. I wanted to take the hall-effect board I made during inputs week last week.
One thing I did while starting this weeks project was to just play around with different sized magnets and see what their output values were relative to how close I held them to the sensor.
It was apparent that the bigger (and somewhat proportionately stronger) the magnet, the more effect it would have on the hall sensor at the same distance away. I was mainly comparing a 1mm by 5mm tiny magnet with a 2mm by 7mm slightly bigger but still small magnet. These will eventually be embedded into a bearing cap for my final project - the POV fidet spinner.
So while my circuit for sensing the hall-effect didn't really change (it was already set up to send serial output data back to my computer), the software to visualize those values did change.
I had heard of Processing before and used it a little bit in high school on my schools engineering team to visualize something we were doing (I forget). So I wanted to revisit that software and regain familiarity.
In an attempt to do this, I read over some of their Tutorials and looked over their Examples and Documentation. I wanted to start out with something simple so I was playing with lines and the alpha component of stroke colors and I ended up making something that produced images like this:
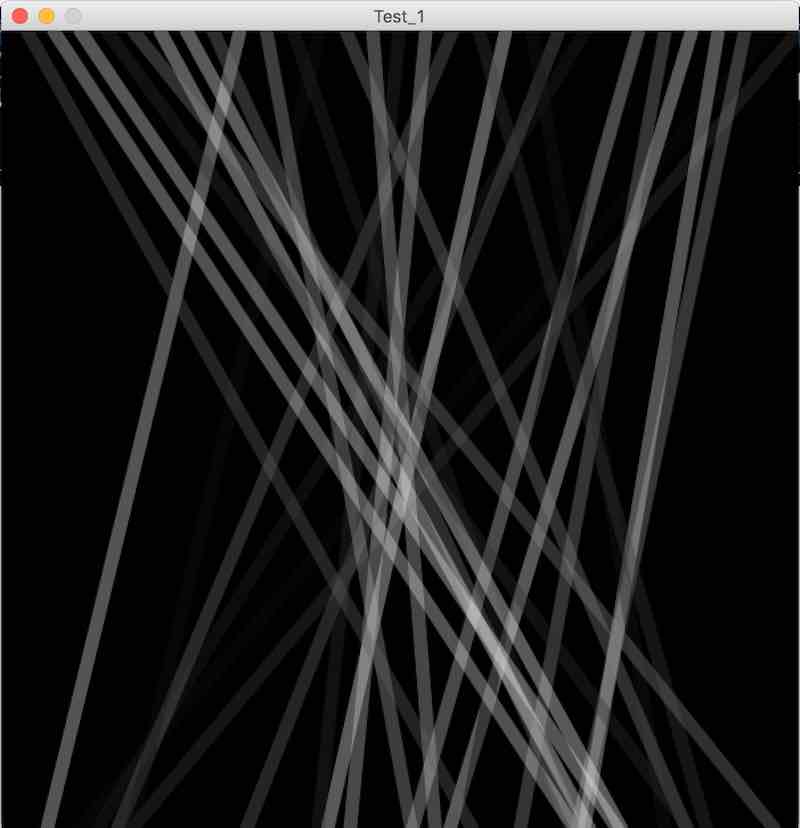
And that was kind of boring but allowed me to undertsand some of the functions within processing and making programmatic sketches. The problem was it was completely static and the processing sketch didn't change at all over time.
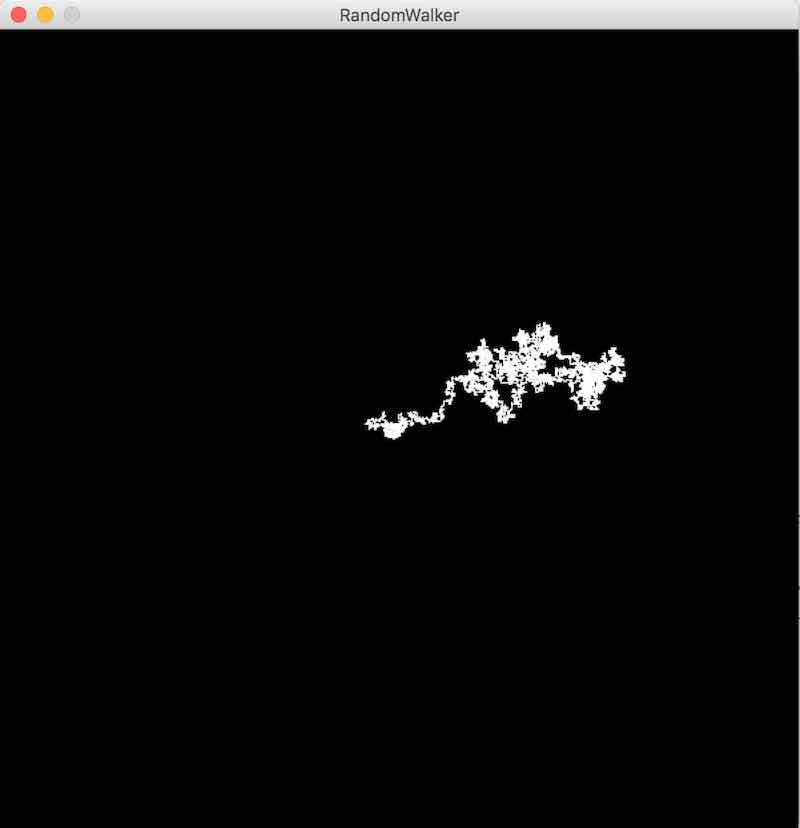
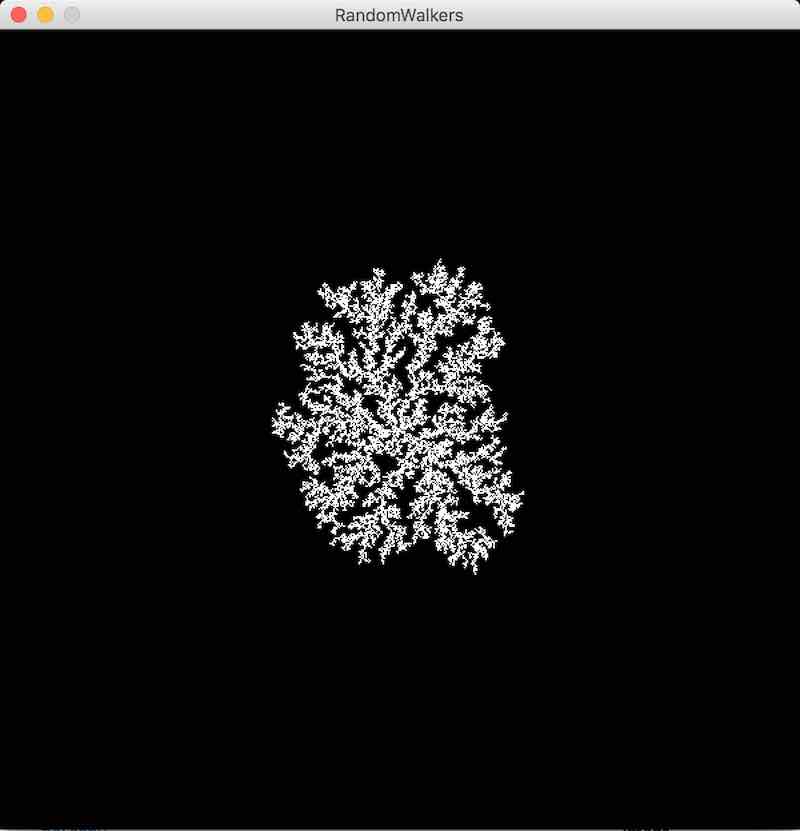
So I moved onto something that actually moved (no pun intended). And the first thing that came to mind was visualizing randomness. I had heard of a random walker which is (I think) supposed to cause a simplified version of Brownian Motion. So I basically coded a script where an agent would start in the middle of the canvas and move randomly up, down, left, right and saw it produced this after some time:
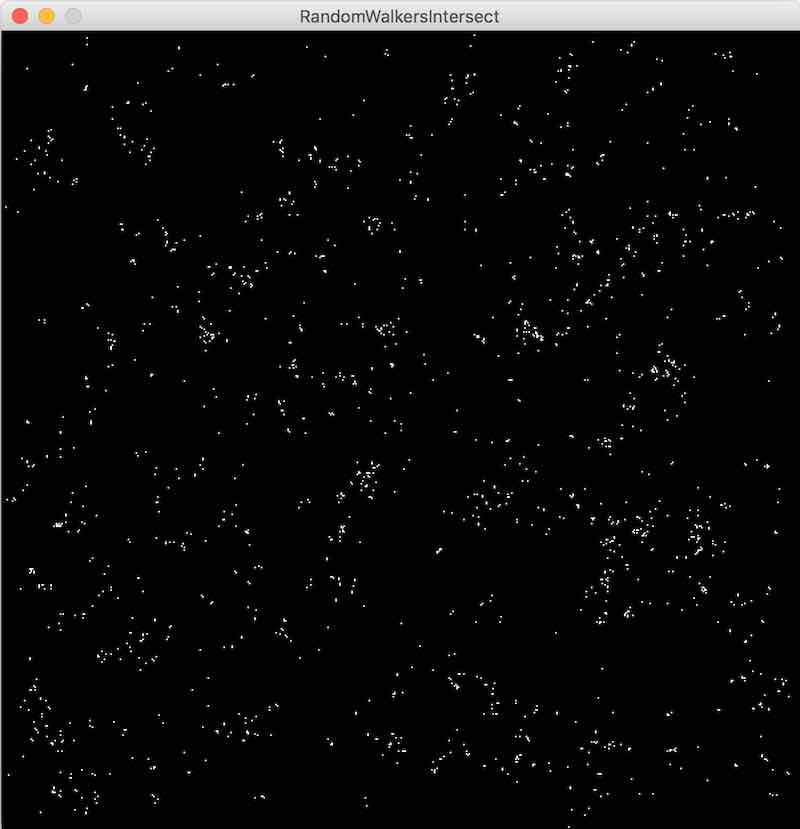
This was kind of cool but I wondered if I had a bunch of those agents moving on the canvas, how often would they intersect? So I created a simulation to figure that out and found that they produced an image like the follow where there were certain pockets that initially formed since the walkers would intersect and were already somewhat close, so they tended to intersect more than once. These pockets were fairly randomly distributed thorughout the canvas, so it filled up relatively uniformly.
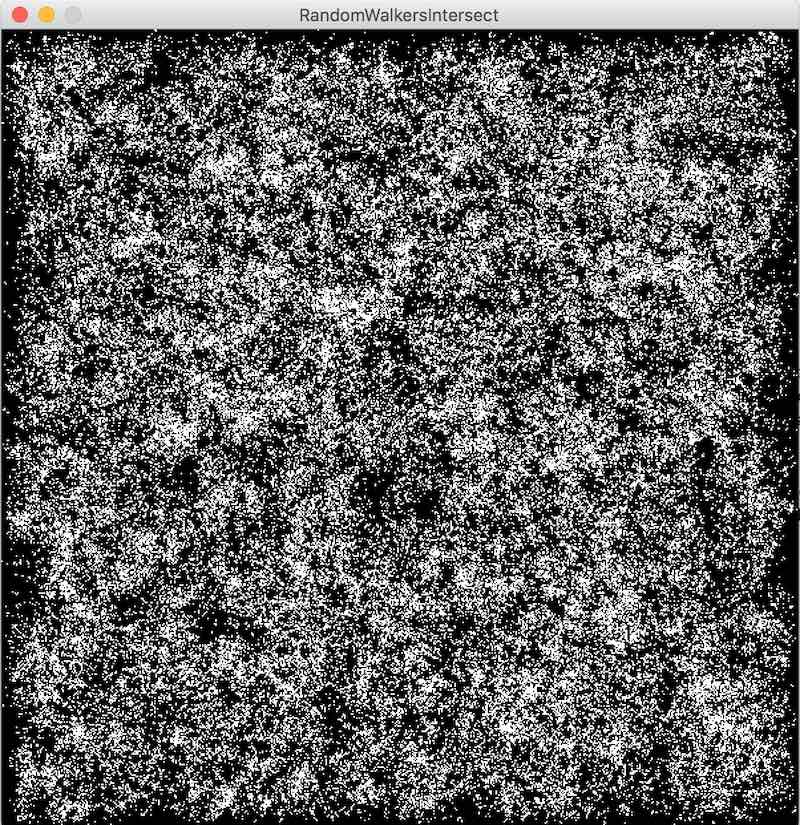
So then I wondered what would happen if you had these random walkers but they went away (or natually "re-spawned") overtime. So I created that simulation and an interesting image resulted:
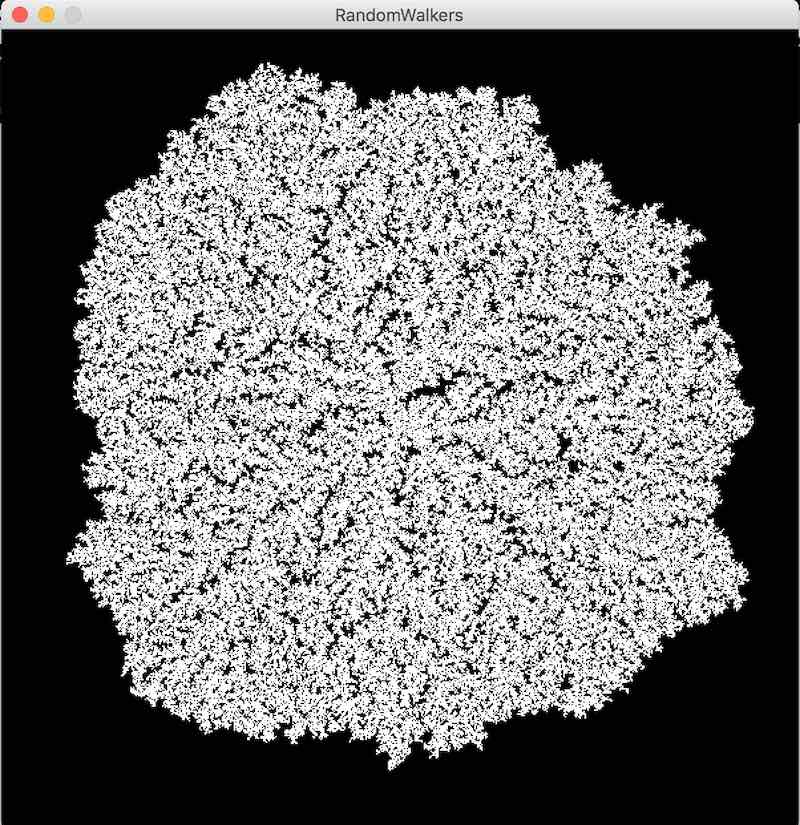
It almost looked like coral to me, which in a sense made sense. It would make sense that coral grows by having random nutrients and other building blocks that are floating in the ocean that randomly pass by and stick onto it. And this fractal structure was reflective of that. In fact I was so curious about how coral actually grows that I had to look it up and found this video:
Visualizing Magnetic Field Strength in Processing
So after this exploration into Processing, I had to somehow connect it back to my original goal of visualizing data that is streamed over serial from my hall-effect sensor. Building off of the random walker ideas, I wanted to write a program where an agent would move randomly in the X direction of the canvas, and have the hall-effect sensor determine the Y direction.
The first touble I had when trying to get the serial data into Processing from my board was that even at the correct baud rate (9600), the values that the Processing Serial library would output were very cryptic.
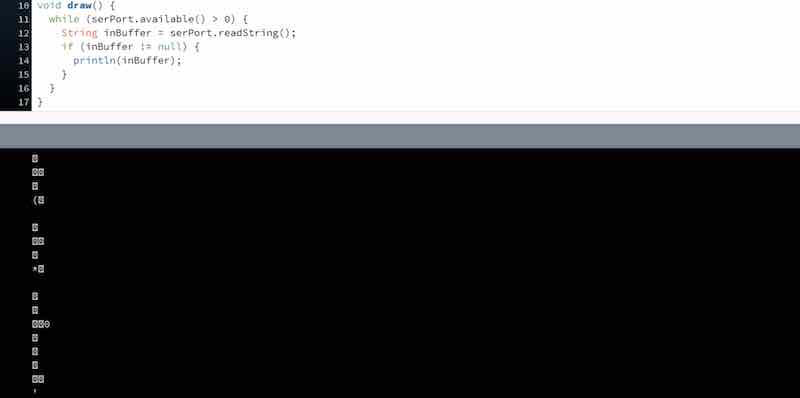
I thought this was a timing issue because the python scrip (term.py) was able to receive the serial fine at a 9600 baud rate. But at the same time the python script was doing some correction to get the framing correct from the ATTiny. The nubmers 1,2,3,4 are sent before the actual value, but none of those were being picked up in Processing. So instead of getting serial directly into Processing, I instead networked my python and processing sketches over a web socket on my local computer. The python script created a web server at 127.0.0.1:3333 and my Processing script would create a web client that would read messages from that port.
This worked really nicely and I was easily able to get the numbers streaming in Processing.
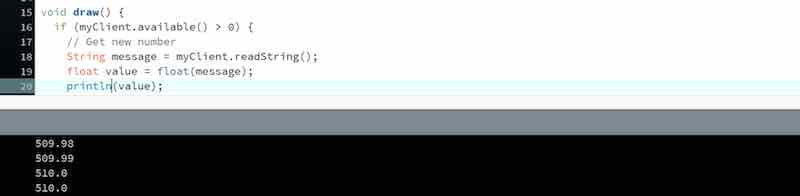
In order to get the numbers streaming, the first number sent is usually some weird value that isn't a number. So when I go to parse the string sent over the websocket (that isn't numerical), it get's the value NAN (Not a number). To check for this in Java (the language of Processing), apparently there isn't a built in function to do it, and because of the standard Java follows to represent NAN, any comparison to NAN will result in false, even when comparing the value to itself. So the clever trick I used (with help from this StackOverflow post), was to check if the number was equal to itself. If it was, then it was a real number. If it wasn't, then it was NAN. Pretty clever trick.
From there, it was just a matter of modifying some existing code I wrote for the simulations above and map the hall-effect values from 0-1024 to a range of 0 to the height of the canvas (600px). Here's the result of the sketch:
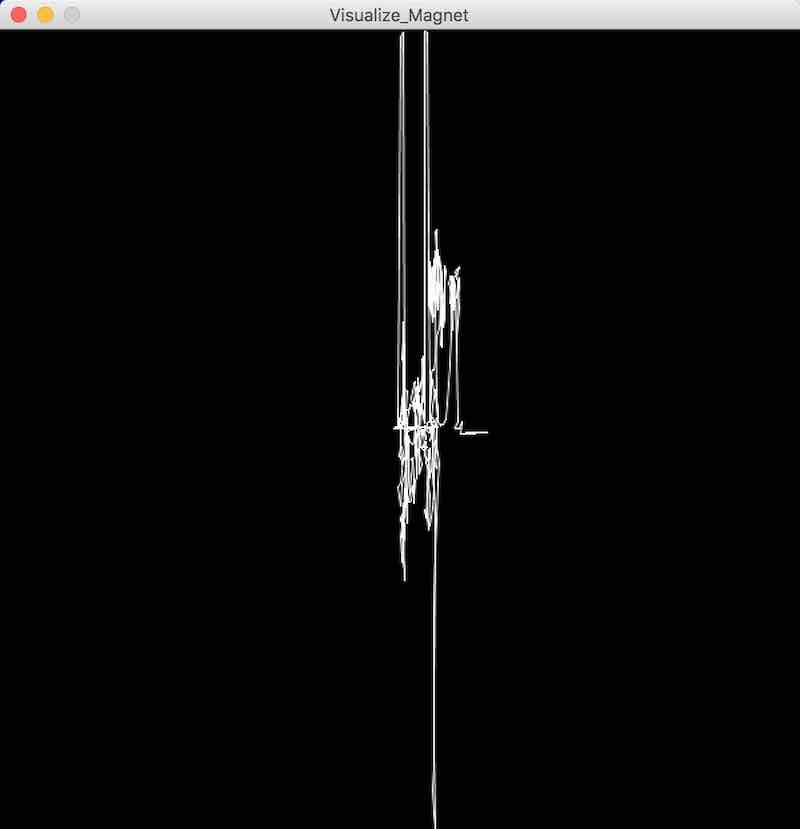
This didn't end up being terribly exciting, mostly because the x direction didn't move terribly fast and have an offset to make things interesting. I wasn't really sure what to do with the X dimension, so I changed it to turn into time, and let the time axis wrap around the canvas.
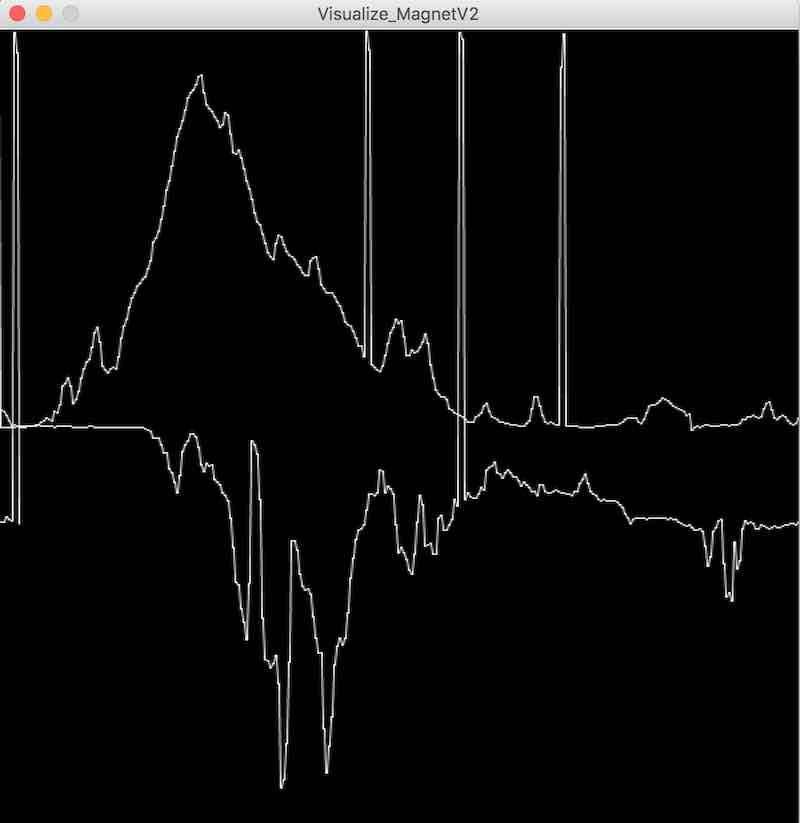
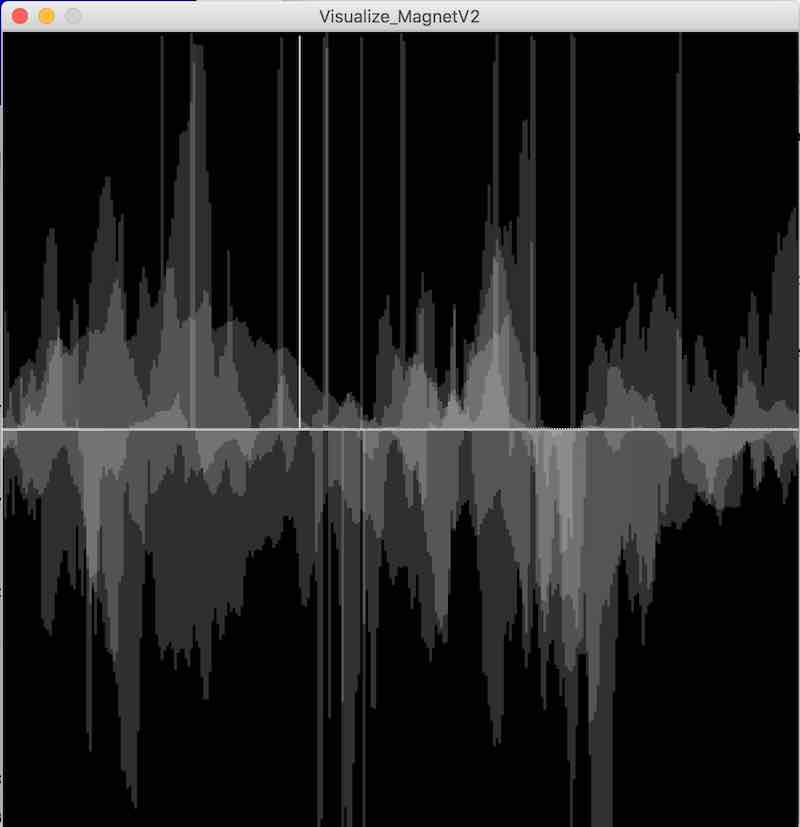
This was more interesting but I thougt it would be more pretty if I changed the output to be a slightly transparent line from the middle of the sketch. The result was pretty cool and I could control the "mountains" that were produced by how far I held the magnate from the sensor:
Final Thoughts
I'm sad that I didn't get to explore more here. While I'm a CS major, there were many more things that Neil talked about during the class that I haven't heard of or explored, including 3D WebGL stuff, CUDA programming and graphics card optimizations, and some of the mathmatical and symbolic programming. Overally, there's lots more to explore in this area (as there really is every week), and I'll definitely revisit this page when I do future personal projects and need to build cool interfaces.
Terminology
Serial, Web Sockets,
Technologies Used
Python, Processing, Web Servers, Web Sockets, Serial
Resources Used