Week 12 - Interfaces
This week we had to build an interface, which was convenient because I already had made one, and I was out all week travelling for Thanksgiving and didn’t have much time to work.
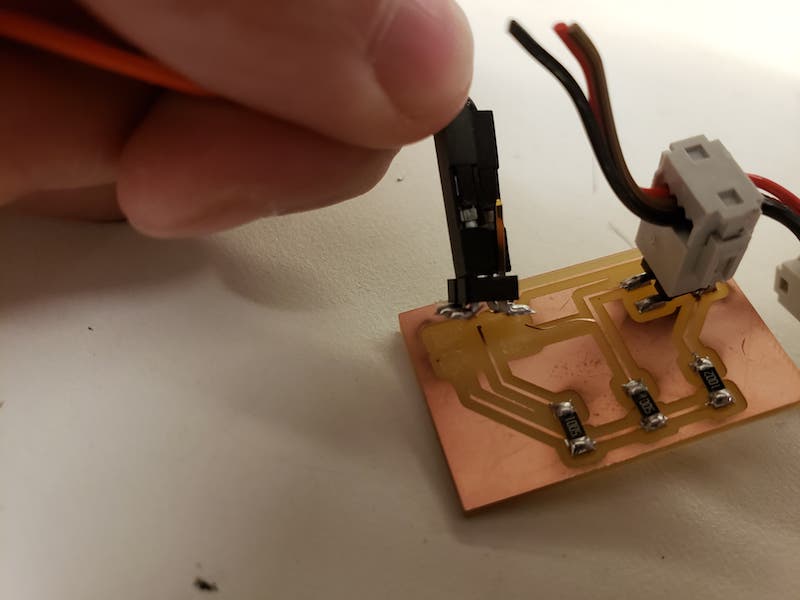
Unfortunately, when I went to check on my input device board, some of the traces had peeled up and I couldn’t use it anymore.
The program still works; I’ve attached another sensor, which doesn’t exactly work as expected, but the outputs are monitored. I used python to communicate serially with the board, and used matplotlib.pyplot to plot the points I get.
plt.axis([0, 1000, 0, 700])
count = 0

def main():
    global prev_value
    global count

    # idle routine
    byte2 = 0
    ser.flush()
    while 1:
        # find framing
        byte1 = byte2
        byte2 = ord(ser.read())
        if ((byte1 == 1) & (byte2 == 2)):
            break
    low = ord(ser.read())
    high = ord(ser.read())
    value = (256 * high + low)

    plt.scatter(count, value)
    plt.pause(0.0001)

    count += 1

port = sys.argv[1]

# open serial port
ser = serial.Serial(port, 9600)
ser.setDTR()

# show plot
plt.show(block=False)

while 1:
    main()
Here’s what it does when I attach my magnetic pickup sensor (work in progress). The code was originally intended for the piezoelectric sensor, and the graph would display a nice jagged line when it senses vibrations.