programming
This week I used my capacitance sensor from Week 8 and 9 to visualize the values it is receiving. Since I already have experience using Python and Grasshopper, I decided to focus on the aspect that's new to me: establishing a connection between the board and the Python or Grasshopper script and reading the values from the sensor correctly. I kept the rest of the script very simple, to allow me to spend more time on my final project this week.
Python
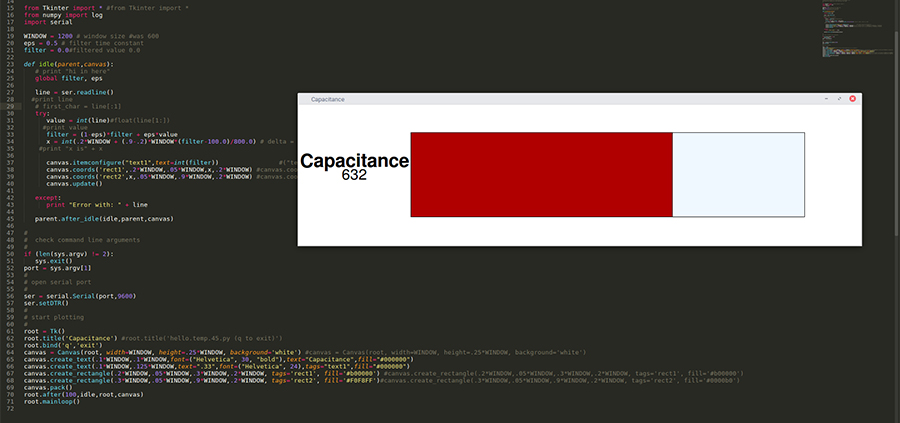
Since I feel most comfortable using the Arduino IDE, I had to alter the Python script that Neil provided so it could read the values in the way the my script sends the values to the FTDI (i.e. sending full values with the Serial.println() function versus individual chars in Neil's C script). I used the ser.readline() function to read the values from the serial port.
My Macbook did not recognize the FTDI cable as a serial port. So I had to use the desktop in the lab to run the Python script.
The
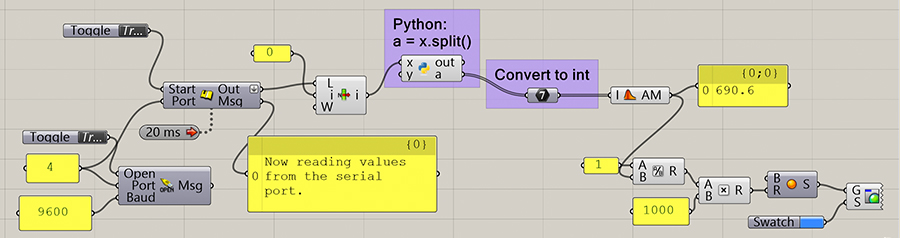
I am very experienced with Grasshopper, but this is the first time I used it to read and visualize values from a serial port, at least successfully. With the Firefly library, Grasshopper can listen to and send data over a serial port. I had some trouble getting single values (Grasshopper received multiple values with each update), most likely because of the high frequency the board sends values through the port while Grasshopper is limited by an update time of every 20 ms. Instead of reducing the frequency in the script for the board, I decided to use this to my advantage and average the values Grasshopper receives to achieve a smoother reading and visualization.
The