Interface and Application Programming
Files: Neil's python code for NTC thermistor; Modified Neil's code: TKinter; Modified Neil's code: Matplotlib.
This week we’re diving deeper into communication between microcontrollers and computers, by developing user interfaces for an input and/or an output device that we made.
I decided to explore potential interfaces for the temperature sensor that I made during the Input Devices week, as this will be also part of my Final Project.
For the temprerature sensor I used an NTC THERMISTOR 10kΩ 3750K 1206. I developed GUI (Graphical User Interfaces) for this sensor with TKinter and Matplotlib adapting the codes proposed by two previous Fab Academy students: Soh Hong Guan (2017) & Siew Chin (2016).
Reminding some useful info about NTC Thermistors
The word thermistor, derived from the term thermally sensitive resistor. Thermistors are a type of semiconductor, meaning they have greater resistance than conducting materials, but lower resistance than insulating materials. They are very accurate and cost- effective sensors for measuring temperature.
The thermistor is basically a two-terminal solid state thermally sensitive transducer constructed using sensitive semiconductor based metal oxides with metallised or sintered connecting leads formed into a ceramic disc or bead. This allows the thermistor to change its resistive value in proportion to small changes in ambient temperature. In other words, as its temperature changes, so too does its resistance.
Thermistors are available in 2 types, NTC (negative temperature coefficient) and PTC (positive temperature coefficient). NTC thermistors’ resistance decreases as their temperature increases, while PTC thermistors’ resistance increases as their temperature increases. It is the NTC thermistor that is commonly used to measure temperature.
NTC thermistors have a negative electrical resistance versus temperature (R/T) relationship. The relatively large negative response of an NTC thermistor means that even small changes in temperature can cause significant changes in their electrical resistance. This makes them ideal for accurate temperature measurement and control. If we send a constant current through the thermistor and then measure the voltage drop across it, we can determine its resistance at a particular temperature. NTC thermistors reduces its resistance with an increase in temperature and are available in a variety of base resistances and temperature curves. NTC thermistors are usually characterised by their base resistance at room temperature, that is 25oC (77oF), as this provides a convenient reference point. So for example, 2kΩ at 25oC, 10kΩ at 25oC or 47kΩ at 25oC, etc. Another important characteristic of a thermistor is its “B” value. The B value is a material constant which is determined by the ceramic material from which it is made. It describes the gradient of the resistive (R/T) curve over a particular temperature range between two temperature points. Each thermistor material will have a different material constant and therefore a different resistance versus temperature curve. Then the B value will define the thermistors resistive value at a first temperature or base point, (which is usually 25oC), called T1, and the thermistors resistive value at a second temperature point, for example 100oC, called T2. Therefore, the B value will define the thermistors material constant between the range of T1 and T2. That is BT1/T2 or B25/100, with typical NTC thermistor B values given between 3000 and 5000.
Thermistor Equation
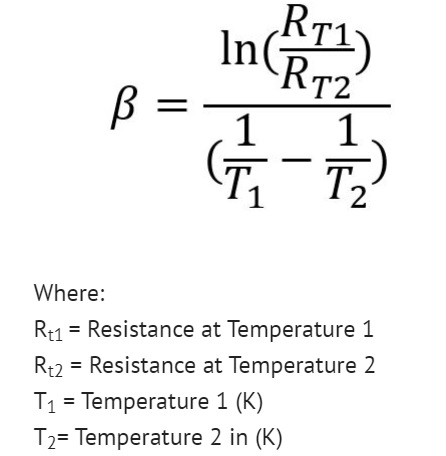
So by knowing the B value of a particular thermistor (obtained from manufacturers datasheet), we can calculate the resistance of the thermistor for a given temperature and vice versa, and develop the curve of temperature versus resistance.
More information on thermistors can be found here and here.
Python GUI Development with Tkinter
Tkinter is Python's de-facto standard GUI (Graphical User Interface) package. I used Python 2.7 for the codes. To check if Tkinter (in Python 2.7 Tkinter is spelled with a capital T, while in Python 3 with a lower case t) is properly installed on your system, execute the following command in the Command prompt: "python -m Tkinter"; a window demonstrating a simple Tk interface should open in this case.
I modified Neil's python code that display temperature on a GUI Tkinter bar , using the codes of Soh Hong Guan and Siew Chin, and adapting them to my board's details (NTC B value: 3750; COM 4). I added two selection buttons for the user to toggle between Celcius and Farenheit, and I also changed the colors of the display window and the bar. The display can be modified further adding photos and text and I will focus on further imporving it for my final project. My code can be found here.
Python GUI Development with Matplotlib
Matplotlib is a python 2D plotting library which produces publication quality figures in a variety of hardcopy formats and interactive environments across platforms, and can be used in Python scripts.
I used Matplotlib to make live charts with the temperature values read by my temerature sensor.
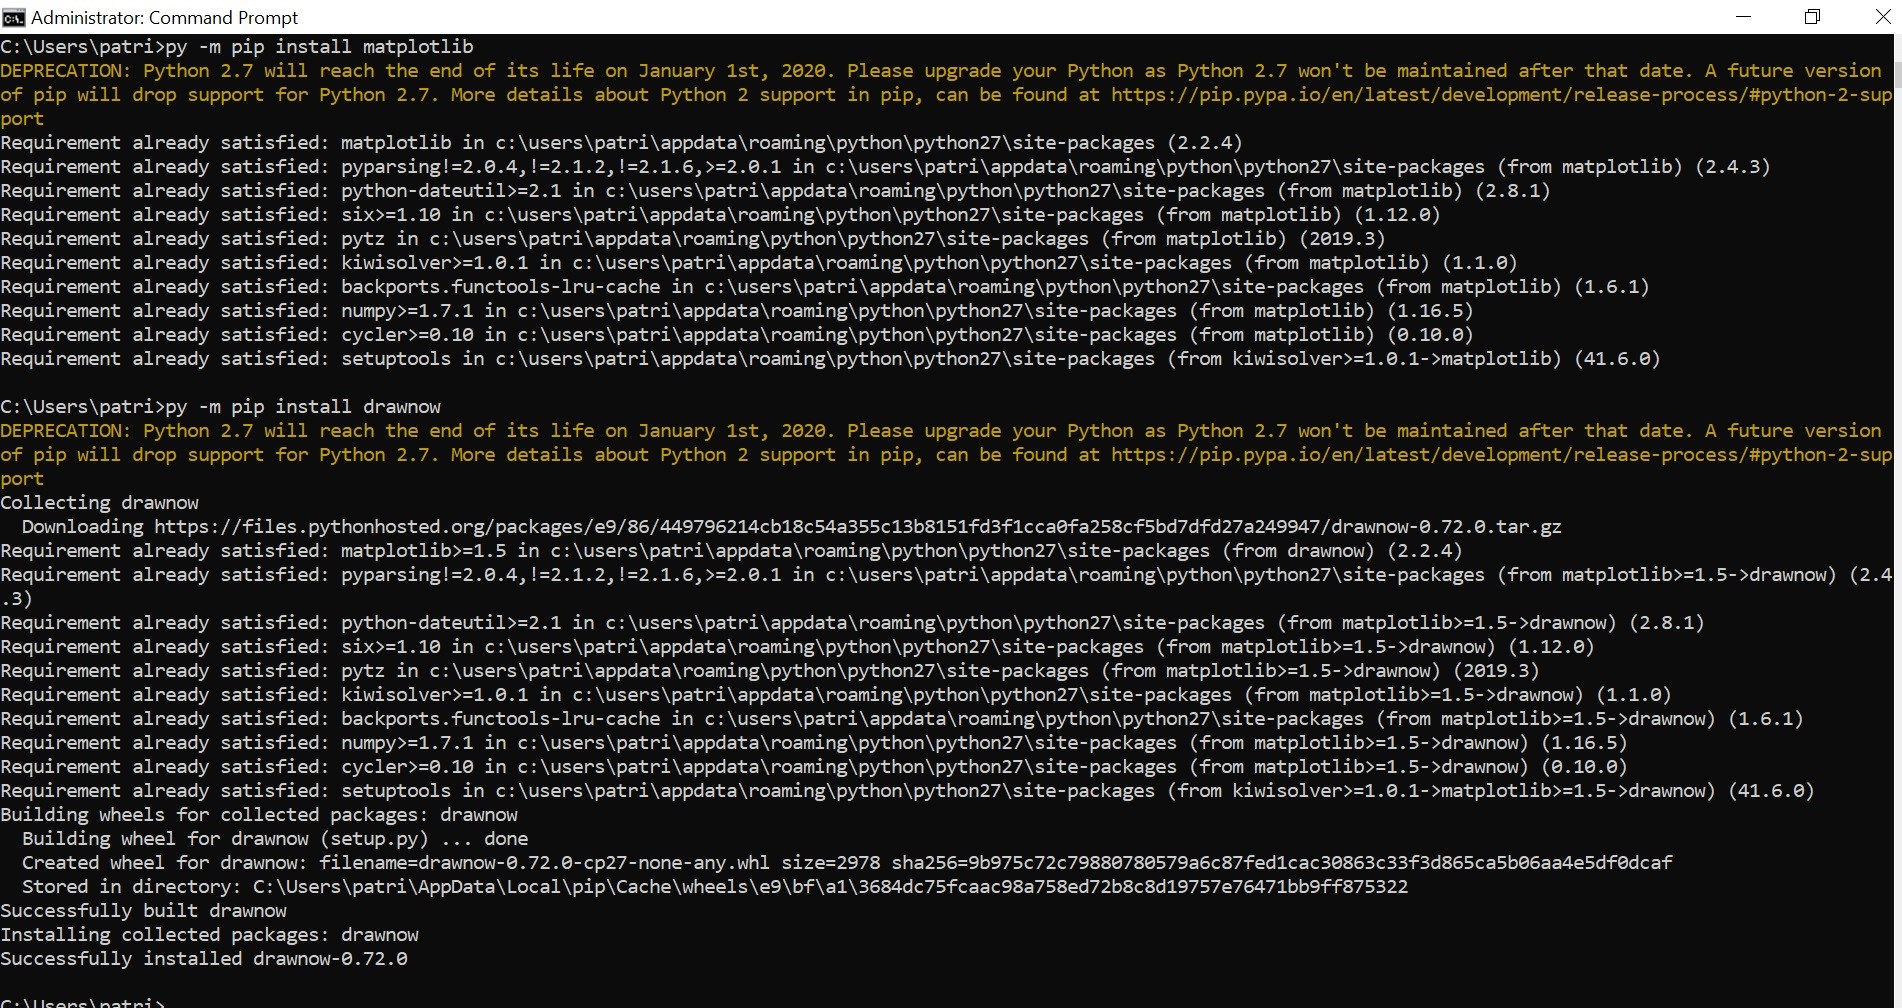
To install Matplotlib, execute "py -m pip install matplotlib" on the Command prompt. We need to install one more library to enable Matplotlib to plot live sensor data in real time. The magic library is called drawnow. To instal drawnow, execute "py -m pip install drawnow" on the Command prompt.
I edited the codes of Soh Hong Guan and Siew Chin, and adapting them to my board's details (NTC B value: 3750; COM 4). It needs a lot of improvement but it was a good starting point. I will further imporve this GUI for my final project. My code can be found here .