Week 12: Interface Programming
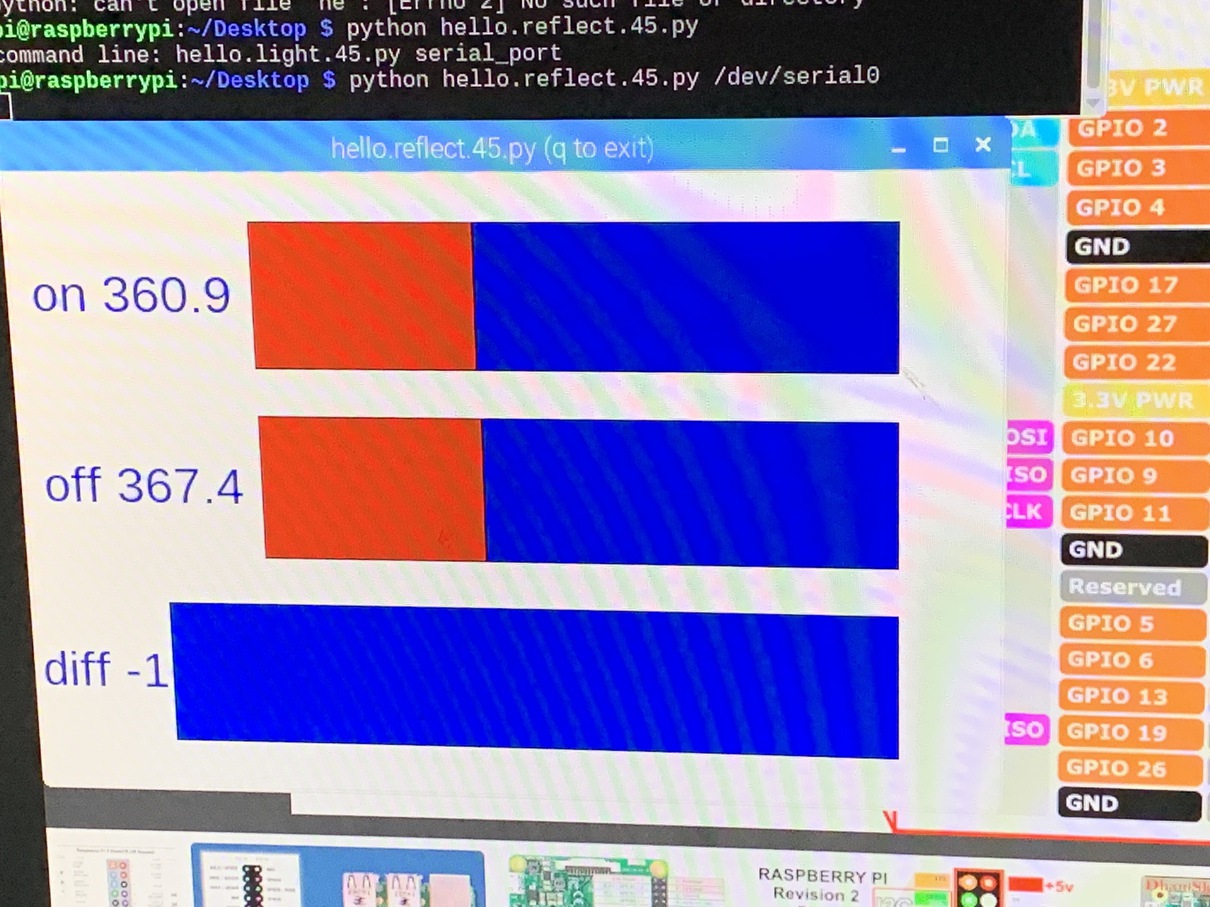
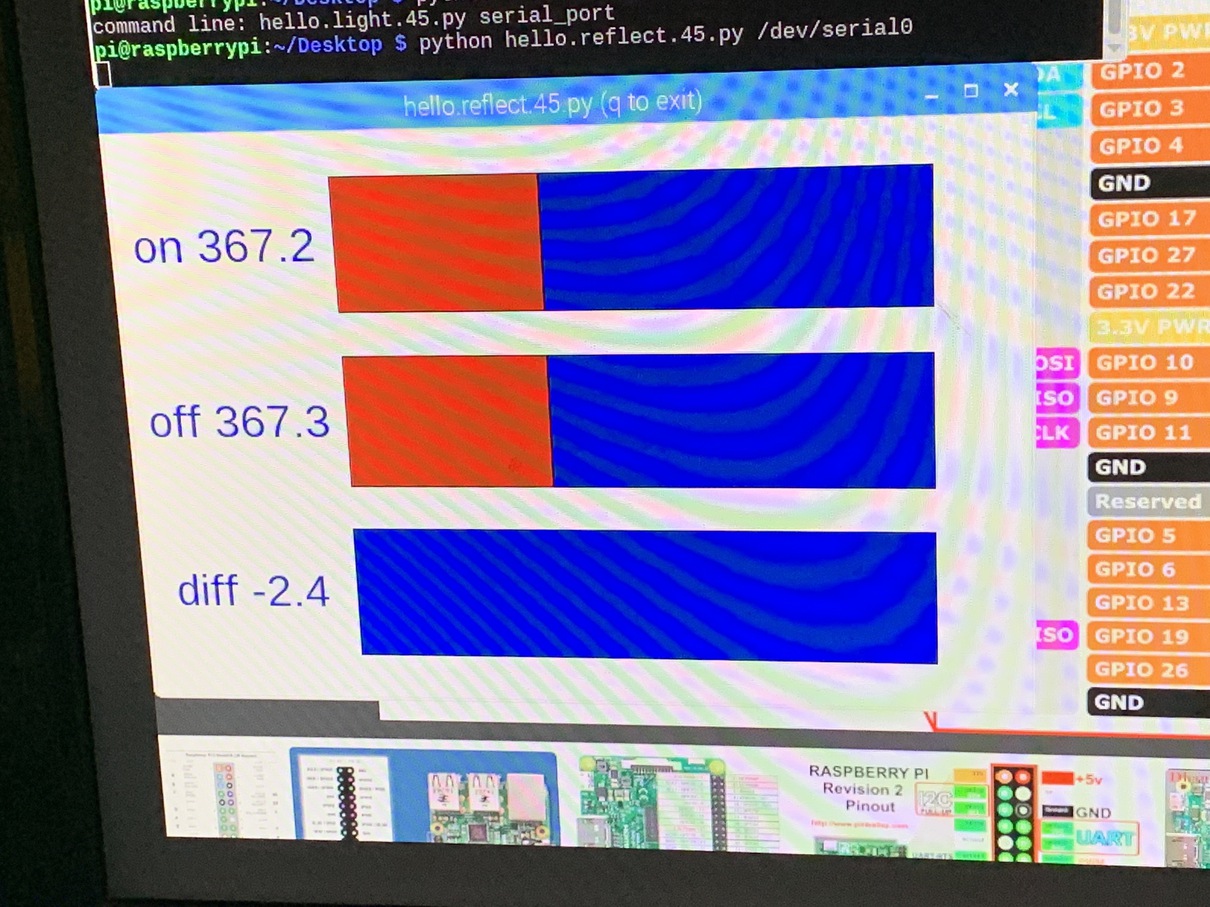
In this section, we play with TKinter to do some graphics and show the coin detection! Neil's starter code shows us a bunch of moving boxes that display the raw data that is coming in from the board. But we can present it in a cleaner format, and it will let me learn how exactly the graphics pipeline works in python.
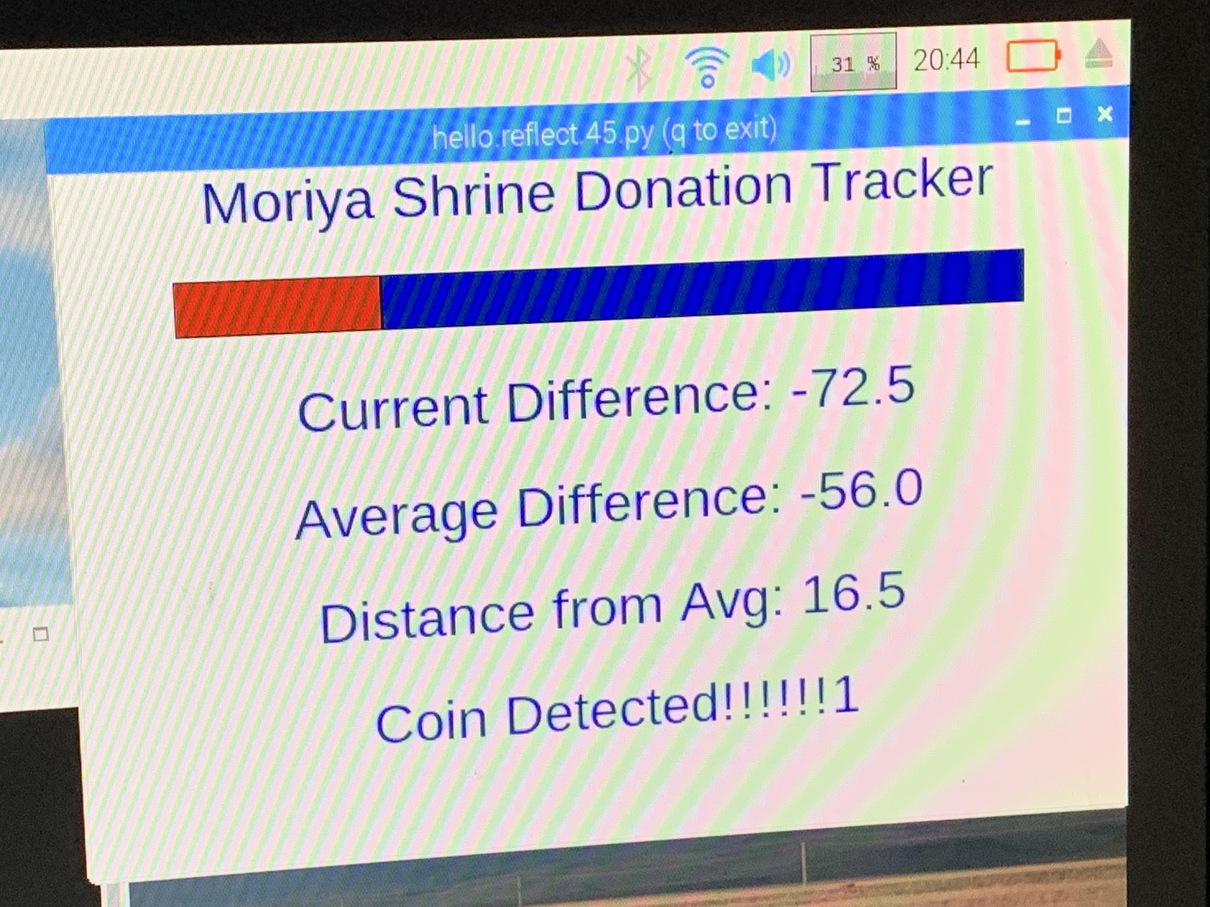
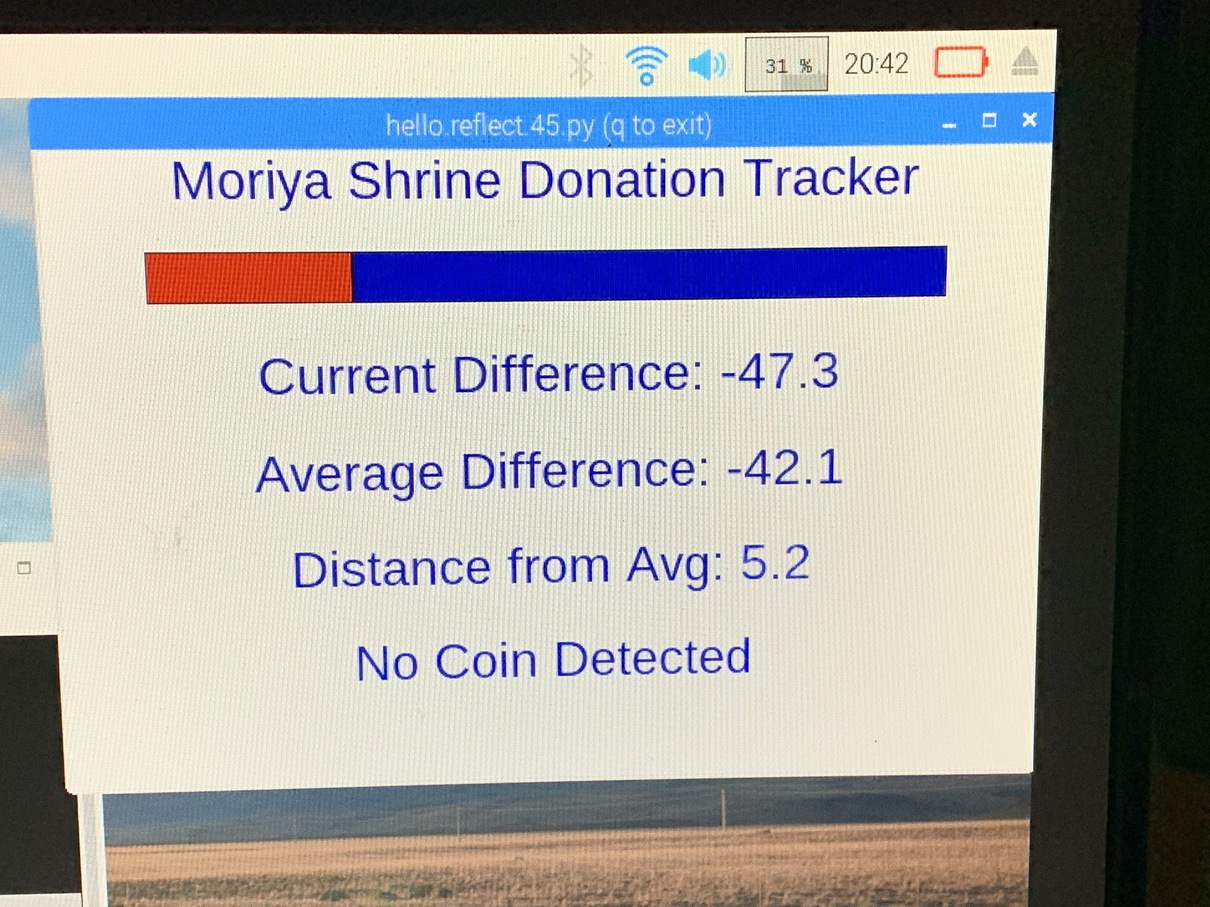
In the end, we manage to turn from the three-box setup at the top of the page, to the Moriya Shrine Donation Tracker directly above. I'll mostly go over the code in snippets and explain what each part does, since there wasn't much physical work to do in this week.
    from Tkinter import *
    WINDOW = 600 # window size

    root = Tk()
    root.title('Moriya Shrine Donation Tracker')
    root.bind('q','exit')
    canvas = Canvas(root, width=WINDOW, height=.65*WINDOW, background='white')
    canvas.create_text(0.5*WINDOW, 0.03*WINDOW, text="Moriya Shrine Donation Tracker", font=("Helvetica", 24), fill="#0000b0")
    canvas.create_rectangle(.25*WINDOW,.25*WINDOW,.3*WINDOW,.3*WINDOW, tags='rect1_diff', fill='#b00000')
    canvas.create_rectangle(.3*WINDOW,.25*WINDOW,.9*WINDOW,.3*WINDOW, tags='rect2_diff', fill='#0000b0')
    canvas.create_text(.5*WINDOW,.225*WINDOW,text=".33",font=("Helvetica", 24),tags="text_diff",fill="#0000b0")
    canvas.create_text(.5*WINDOW,.325*WINDOW,text=".33",font=("Helvetica", 24),tags="text_avg",fill="#0000b0")
    canvas.create_text(.5*WINDOW,.425*WINDOW,text=".33",font=("Helvetica", 24),tags="text_dist",fill="#0000b0")
    canvas.create_text(.5*WINDOW,.525*WINDOW,text=".33",font=("Helvetica", 24),tags="text_bool",fill="#0000b0")
    canvas.pack()
Finally, canvas.pack() tells the window manager to compress its size to include the GUI elements we have just defined.
    root.after(100,idle,root,canvas)
    root.mainloop()
    def idle(parent,canvas):
       canvas.itemconfigure("text_diff",text="Current Difference: %.1f"%filter)
       canvas.itemconfigure("text_avg",text="Average Difference: %.1f"%currav)
       canvas.itemconfigure("text_dist",text="Distance from Avg: %.1f"%dist)
       canvas.itemconfigure("text_bool",text="No Coin Detected")
       if coincount > 0:
          canvas.itemconfigure("text_bool",text="Coin Detected!!!!!!1")
       canvas.coords('rect1_diff',.1*WINDOW,.1*WINDOW,50+x,.15*WINDOW)
       canvas.coords('rect2_diff',50+x,.1*WINDOW,.9*WINDOW,.15*WINDOW)
       canvas.update()
       parent.after_idle(idle,parent,canvas)