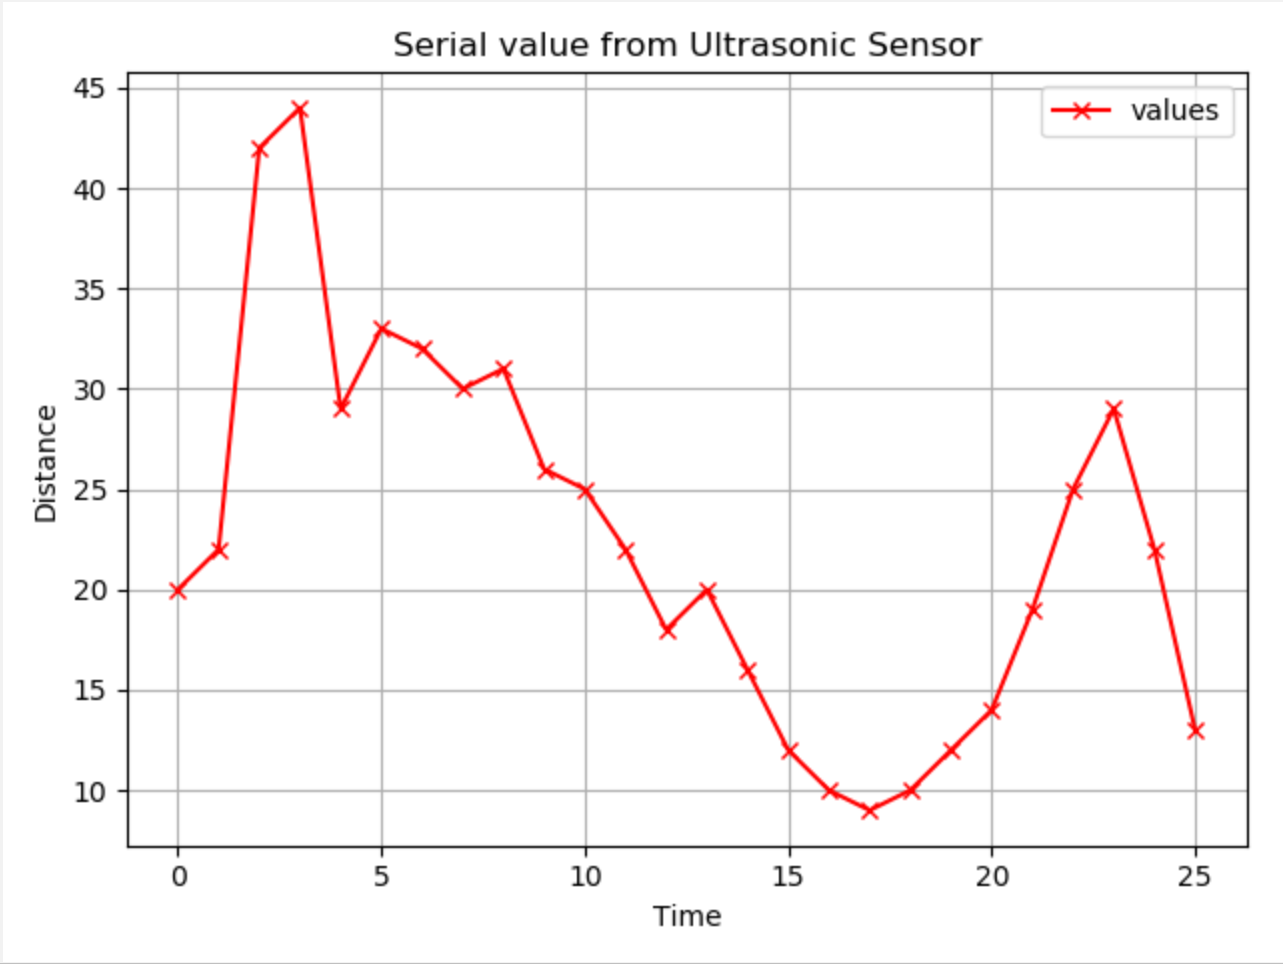
For this week, I want to plot live sensor data using python from my ultrasonic board. I will be using an ultrasonic sensor for my final project so I wanted to create an easy way for me to see the data from the sensor.
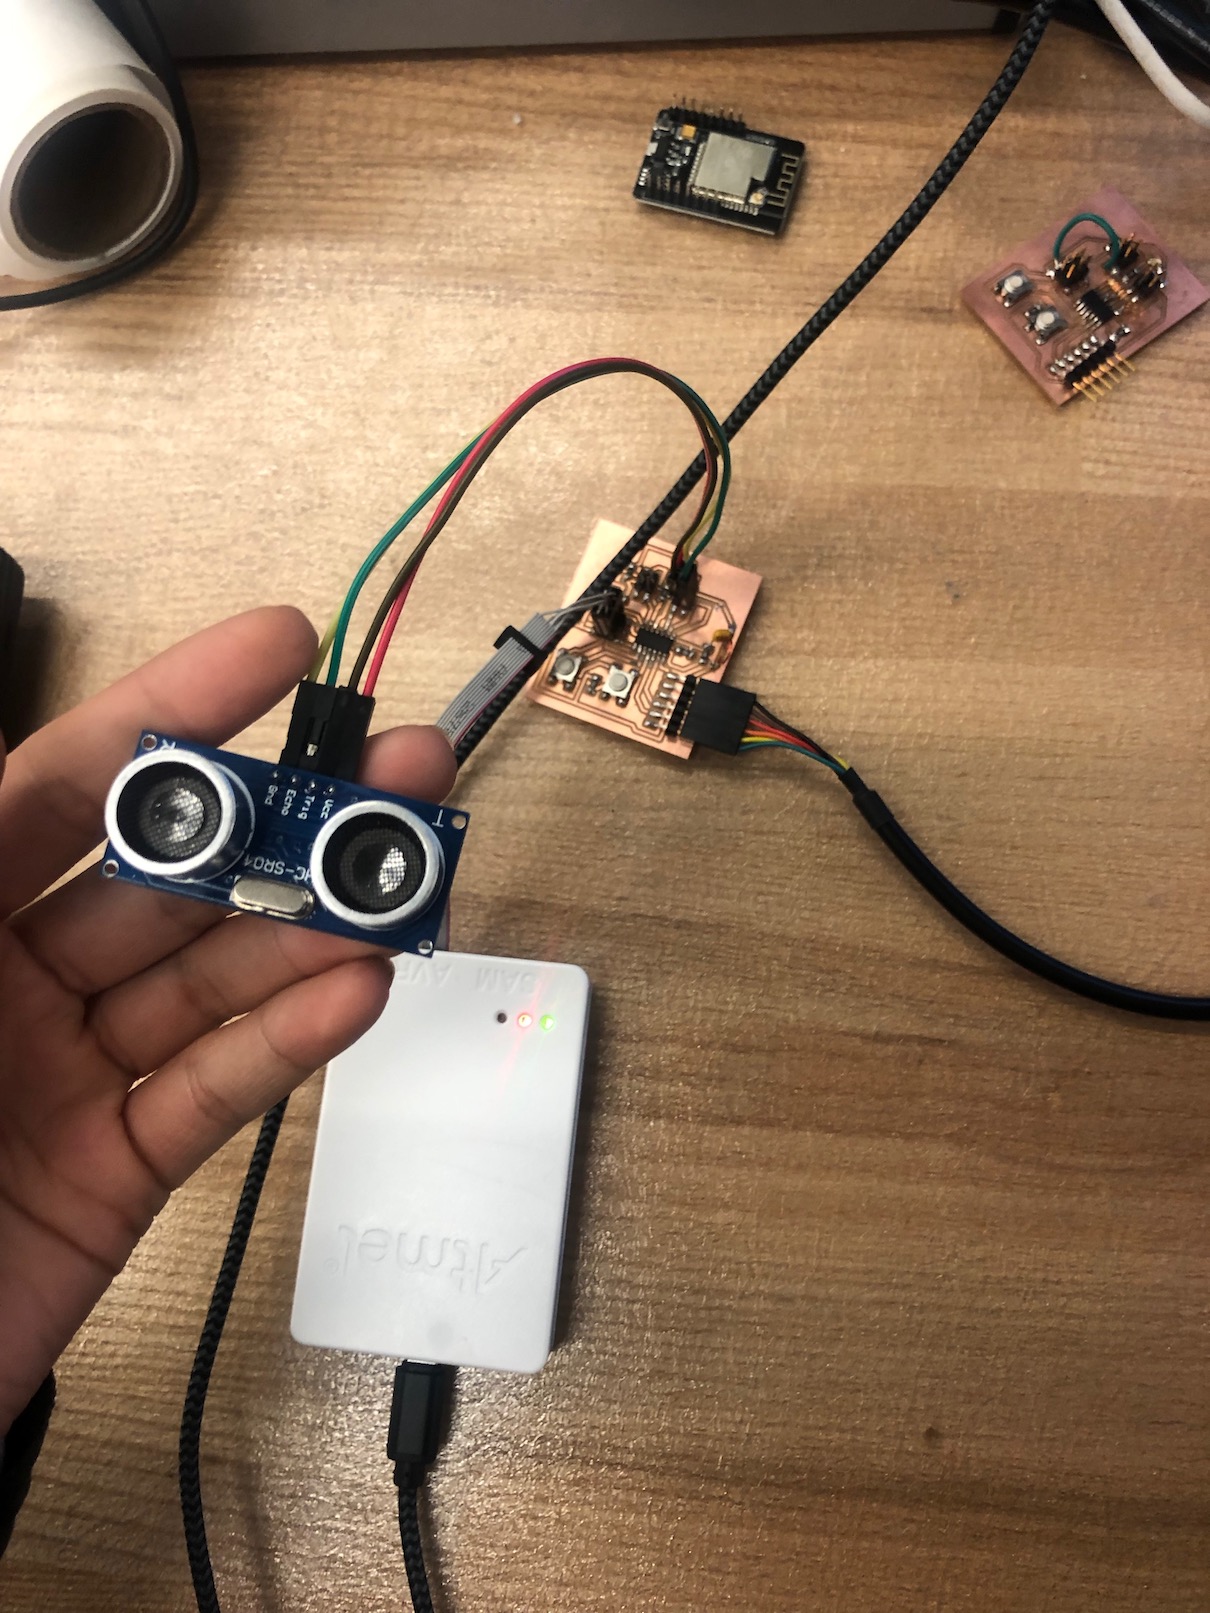
To make this possible is used Matplotlib. Matplotlib is a Python 2D plotting library which produces publication quality figures in a variety of hardcopy formats and interactive environments across platforms. Matplotlib can be used in Python scripts, the Python and IPython shells, the Jupyter notebook, web application servers, and four graphical user interface toolkits. Matplotlib tries to make easy things easy and hard things possible. You can generate plots, histograms, power spectra, bar charts, errorcharts, scatterplots, etc., with just a few lines of code. Because I have a mac and do not have an adapter to connect my created boards, I used an arduino with an ultrasonic sensor attached.
Screenshot of one of the plots the script created.