Week 12: Interface and Application Programming
This week’s assignment is to write an application that interfaces a user with an input and/or output device that you made.
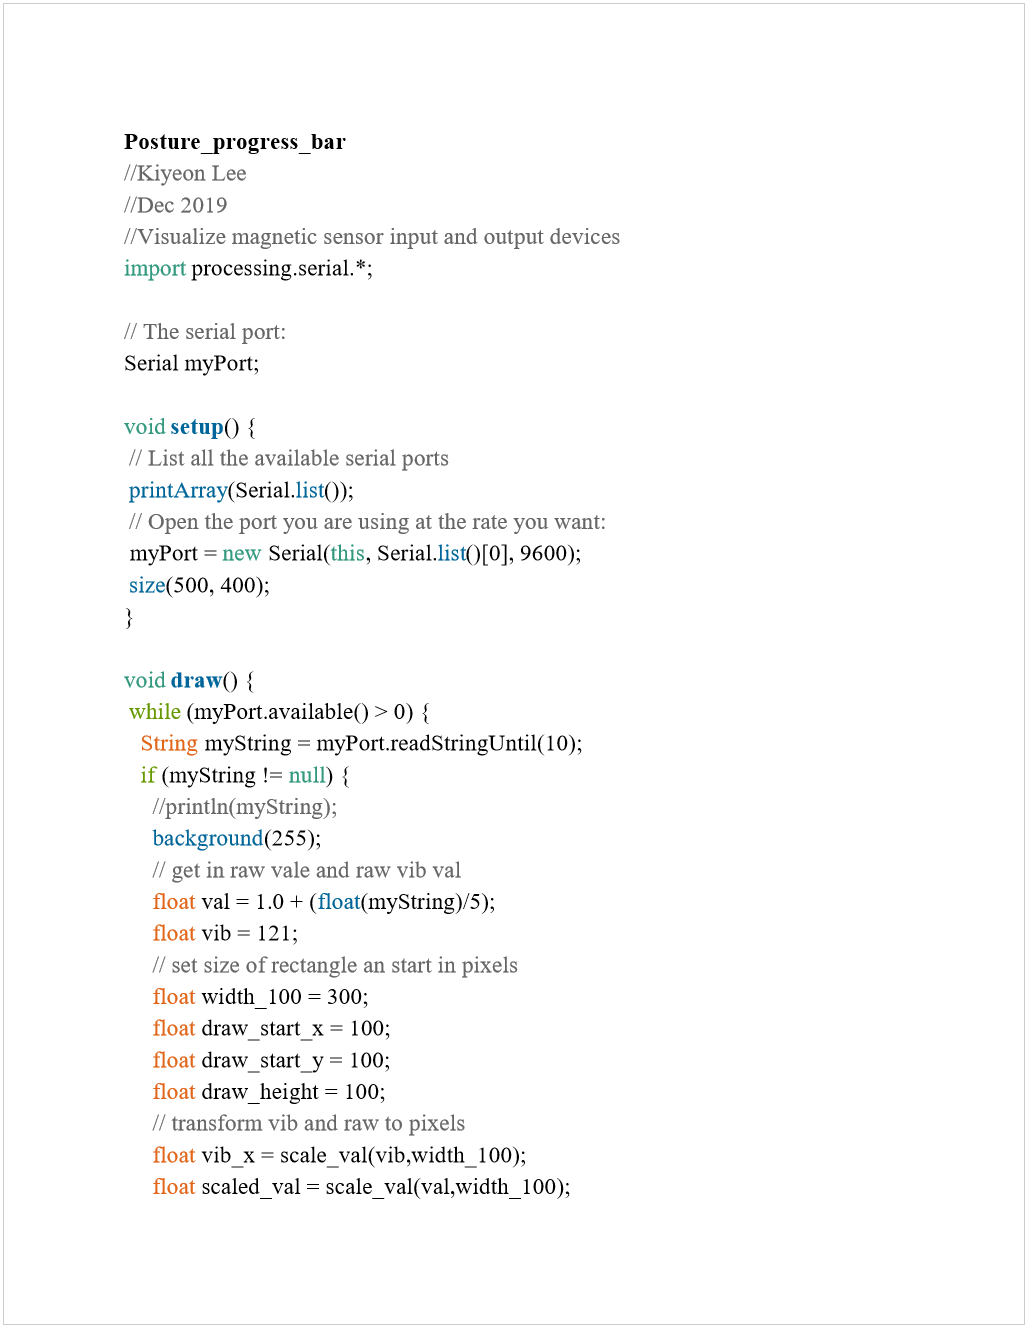
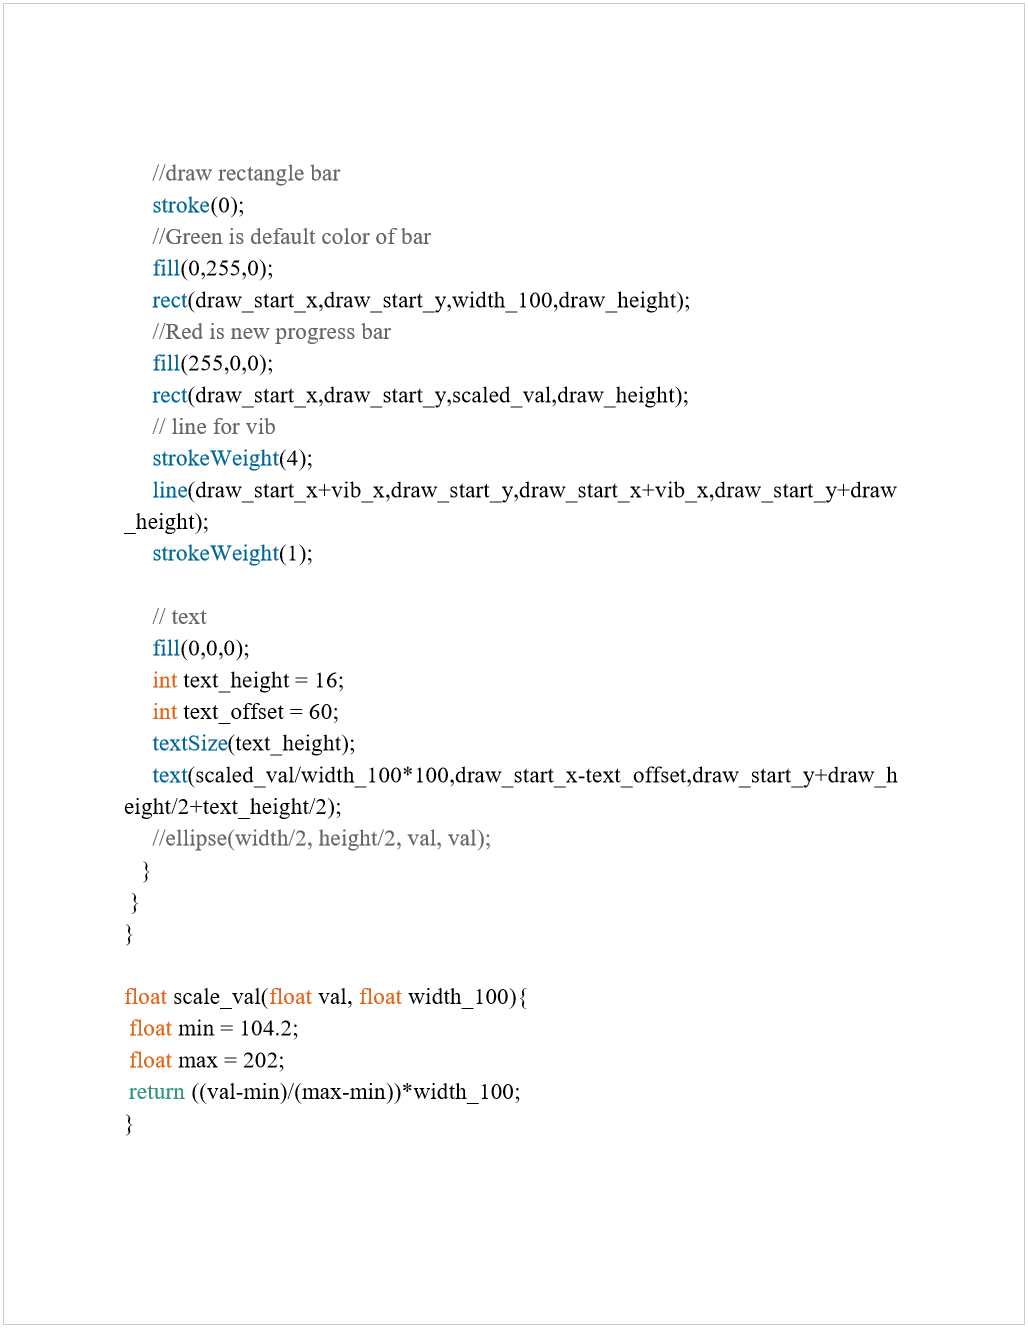
Summary: I wrote an application in Processing software to visualize the strength of the magnetic force from the input device by converting numerical values from the output device into a progress bar.
I tried to replicate Neil’s hello.mag.45.js and html code and progress bar visualization, but the progress bar would not change color in response to different numbers (input), even though the server shows it’s listening. Nathan and I tried to debug by adding (“made it here”) messages throughout the console.log() and JavaScript file for over an hour. However, the bar graph still does not change. I think the problem may be that the board may not be programmed to send and convert the Arduino serial numbers into the HTML file. I’d also installed the drivers for node JavaScript in the terminal (search online error messages to find the necessary drivers).
Instead, with Bryan’s help, I used Processing software to visualize the data changes like Neil’s progress bar. I figured out what numbers to use by scaling. I added a red rectangle on top of a green default rectangle and changed the width of the rectangle to show progress. I made functions within code to easily adjust width and figures of box for future (not hard-coded to avoid editing in many places). It’s helpful to learn functional computer programming. The code is below and also here.
I wanted to reprogram my board to reduce sensitivity of vibration threshold from 599 to around 300 to reduce the sensitivity of the magnetic sensor. However, I mistakenly programmed the output board with the input board (or vice versa), so the value of 599 remained unchanged. When limited on time, don't make big changes.