
ODEs
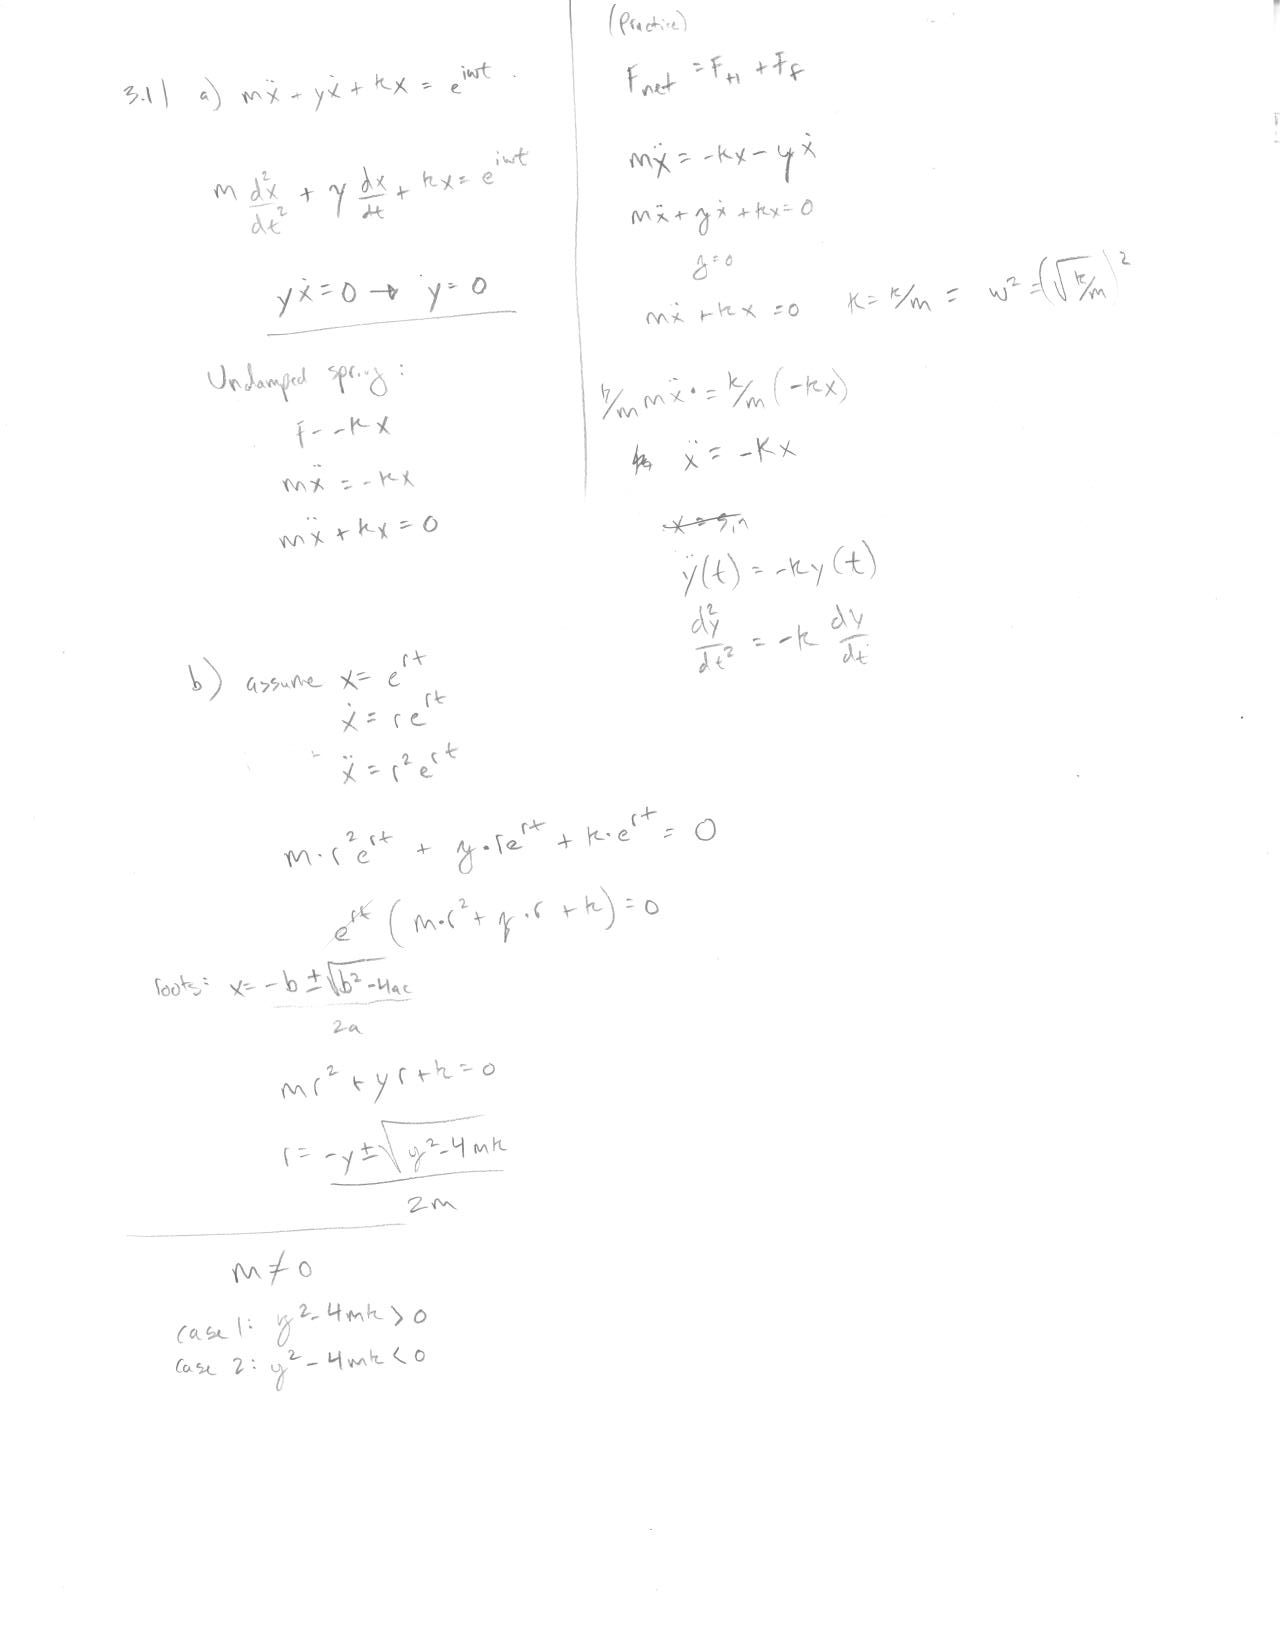
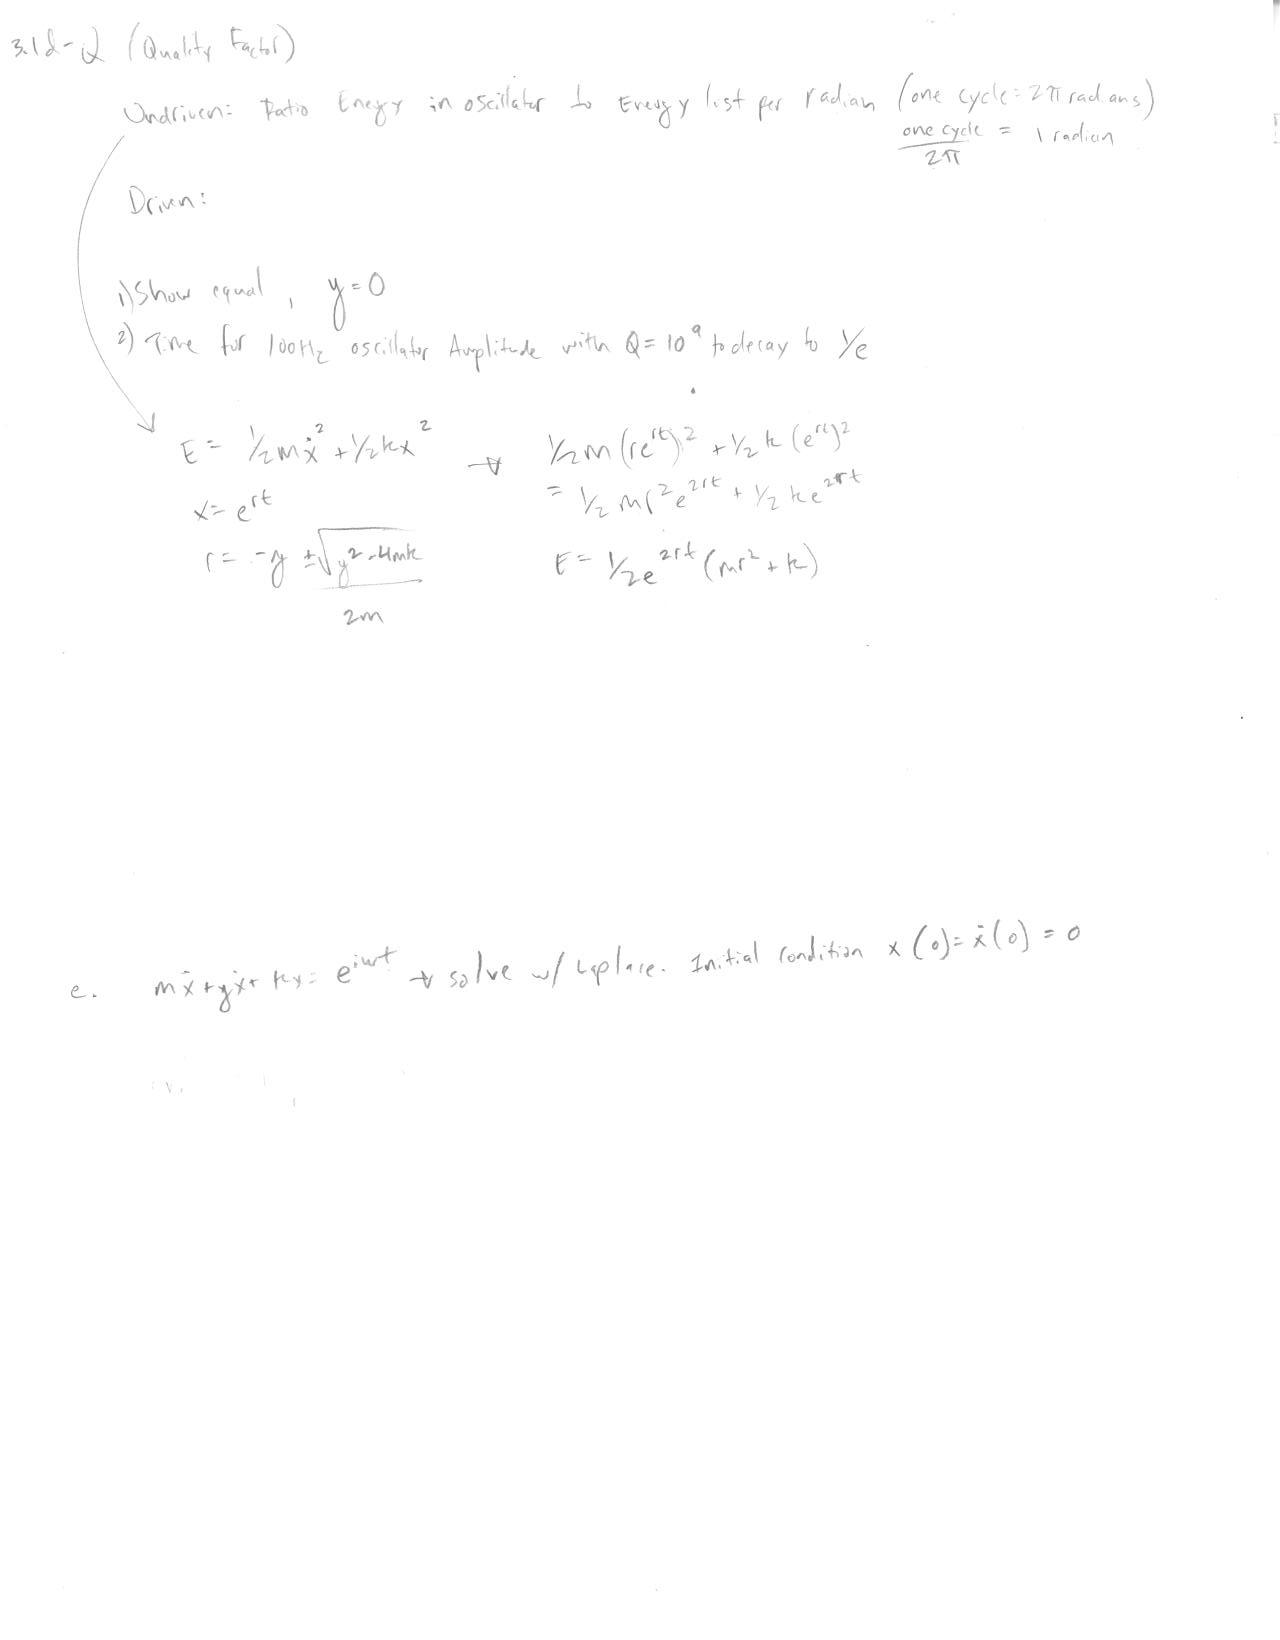
3.1
In [61]:
%matplotlib notebook
from pylab import *
from numpy import *
3.1.c
In [62]:
omega = arange(-10,10,0.1)
A = 1/(-(omega**2) + (0.1*omega) + 1)
fig = figure()
plot (omega,A)
axis([-10,10,-10,10])
ylabel("Amplitude")
xlabel("omega")
grid(b=True, which='major', color='k', linestyle='--')
show()
fig.savefig("amplitude.eps")
amplitude
In [68]:
omega = arange(-10,10,0.1)
phi = (-2*(0.1*omega))/(1-(omega**2))
fig = figure()
plot (omega,phi)
axis([-2.5,2.5,-2.5,2.5])
ylabel("phase")
xlabel("omega")
grid(b=True, which='major', color='k', linestyle='--')
show()
fig.savefig("phase.eps")
phase


