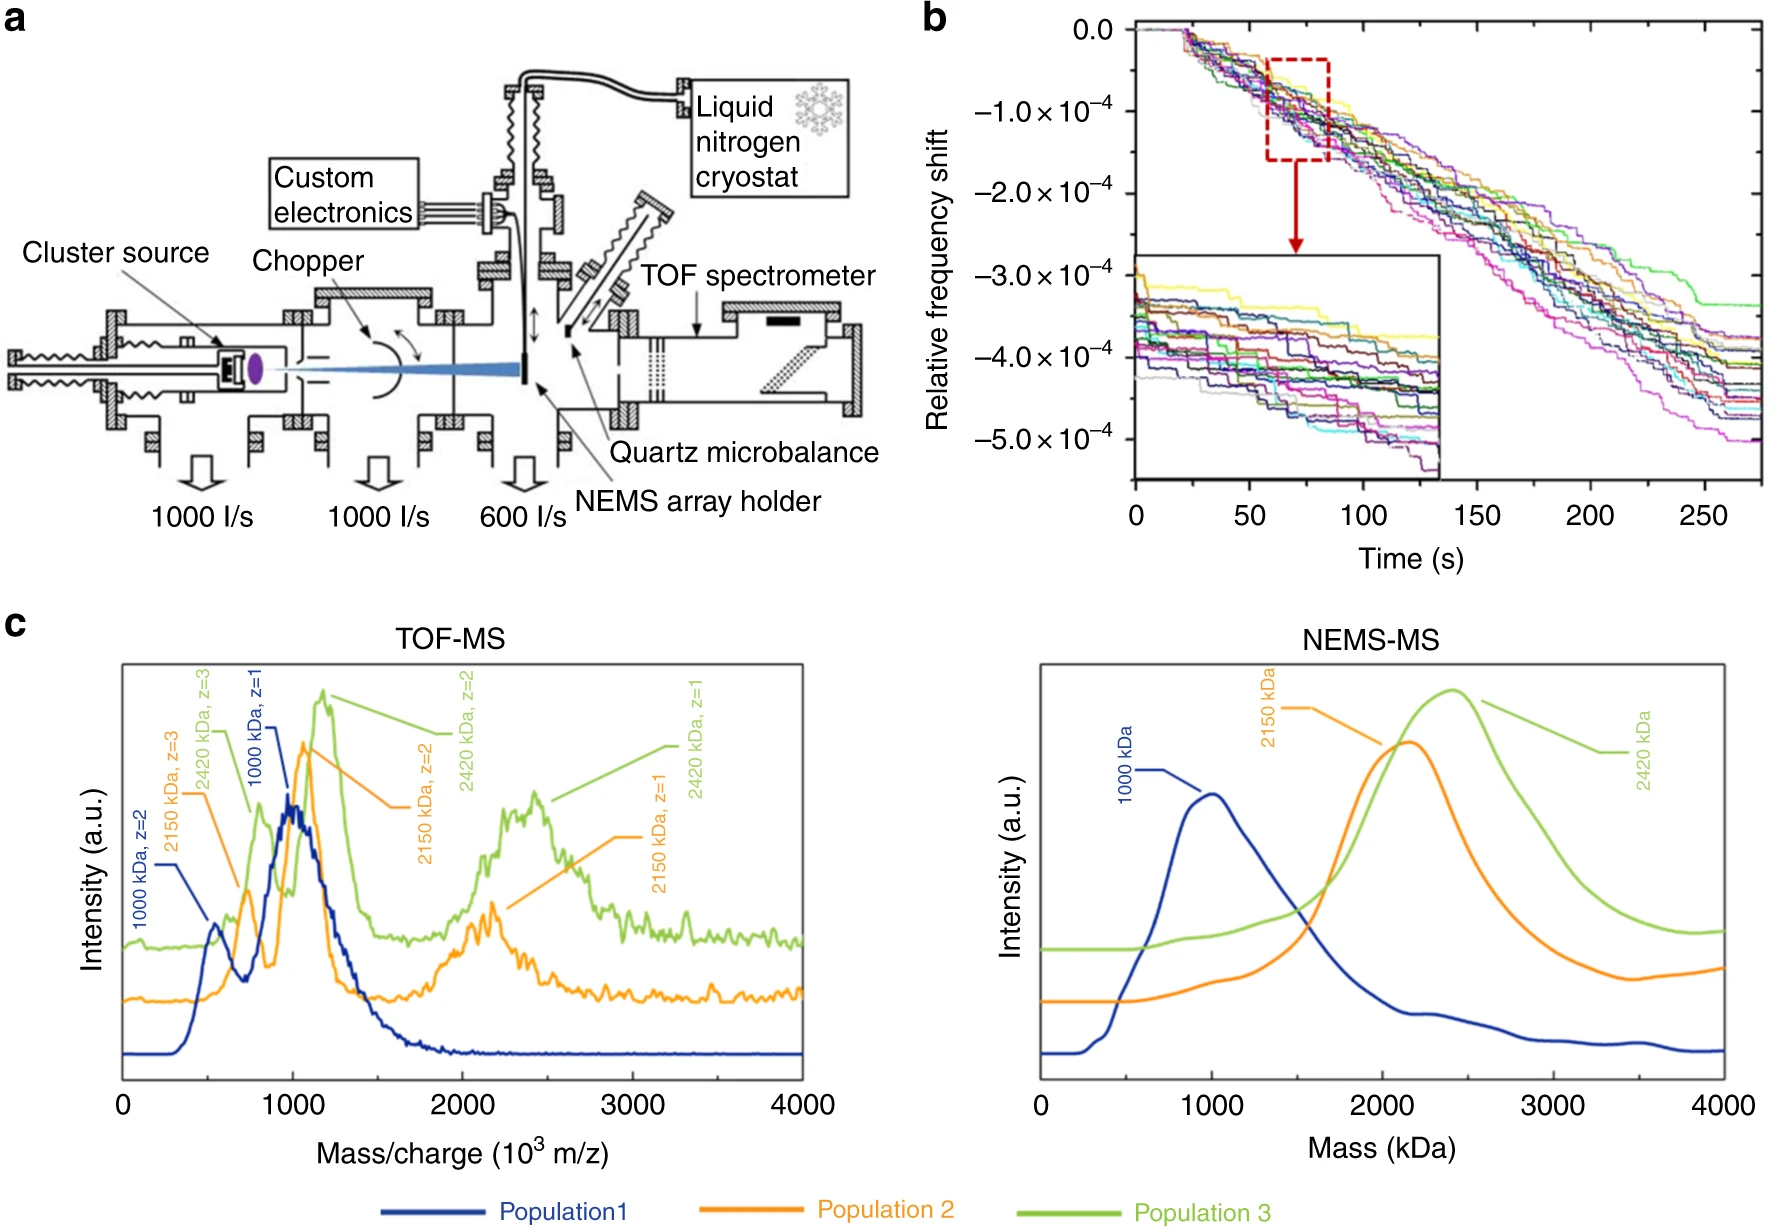
With the emergence of the Internet of Things and the push towards electronic functionalization of all materials and surfaces that make up the world around us, there is a demand to reduce the scale and power consumption of all electronic components. Micro- and nano-electromechanical (MEMS/NEMS) resonators find many applications within this new world. Resonators act as RF signal processing components such as filters, and shrinking their size would enable tighter integration of wireless communication circuits and potentially lower operating voltages, avoiding bulky and power-hungry off-chip components (1). Additionally, NEMS resonators are important in mass spectroscopy and force sensing, where smaller resonator mass results in higher sensing resolution; for example, NEMS resonators are used for the detection of single particles. In a 2018 Nature Comms paper, summarized in Figure 1, researchers fabricated an array of frequency-addressed NEMS beam resonators for single-particle mass spectrometry. These resonators operated in two modes, one with resonance between 20 MHz and 45 MHz and mass sensitivity between 15.3-32.5 Hz per attogram, and a second mode with resonance between 70 MHz to 120 MHz and mass sensitivity between 42.9-87.8 Hz per attogram (2). One of the smallest mass sensitivities demonstrated was in (6) which used a single carbon nanotube as a resonator with sensitivity 7700 Hz per attogram.
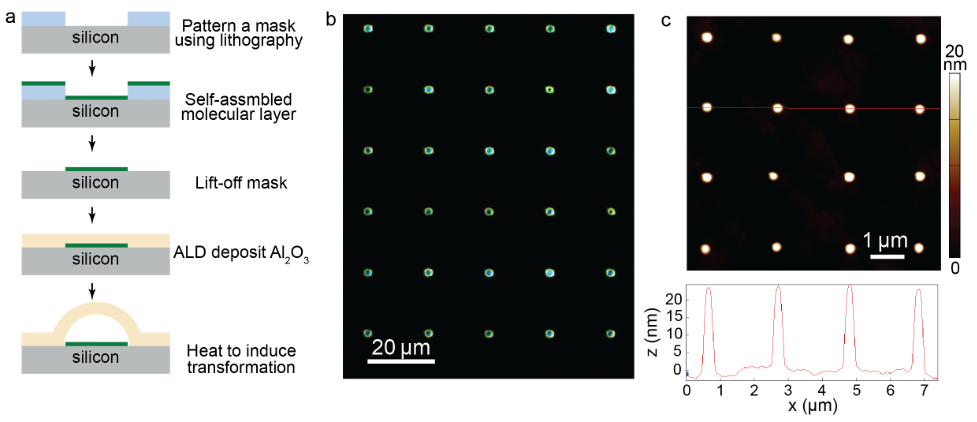
To push the envelope of NEMS resonator miniaturization, bottom-up yet scalable fabrication techniques are required. In my research, I have developed a new fabrication technique which enables the scalable and controllable formation of nanoscale domes in an oxide film (see Figure 2). When applied towards resonators, the advantages of this technique are that miniature mechanical resonators with stable nanogaps can be fabricated densely within an arbitrarily large area. This density advantage could be applied towards, for instance, making hundreds of sensitive force measurements across a microscale region, for example to map out cell mechanics with micron resolution. In addition, since the domes trap air internally, their performance will be more robust to operation in wet/viscous environments than would be a similarly sized cantilever or freestanding beam resonator, since viscous damping has a significant impact on quality factor.
While my research has related to the fabrication of nanogapped dome structures, I had not yet had the opportunity to explore the resonant behavior of devices made using this technique, and that is what I decided to take on for my final project in MAS.862. I will learn to use the COMSOL Multiphysics software to model a nanodome as an electrostatic resonator and investigate such key device parameters as resonant modes with and without bias as well as damping and quality factor. Then, I will simulate the shift in resonant frequency vs incident mass on the resonator in order to compare my dome resonators to the NEMS resonators in (2) to investigate potential applications towards mass spectrometry and force sensing. The key question of my project is, can a dome resonator approach the performance of a conventional beam-shaped NEMS resonator in sensing applications?
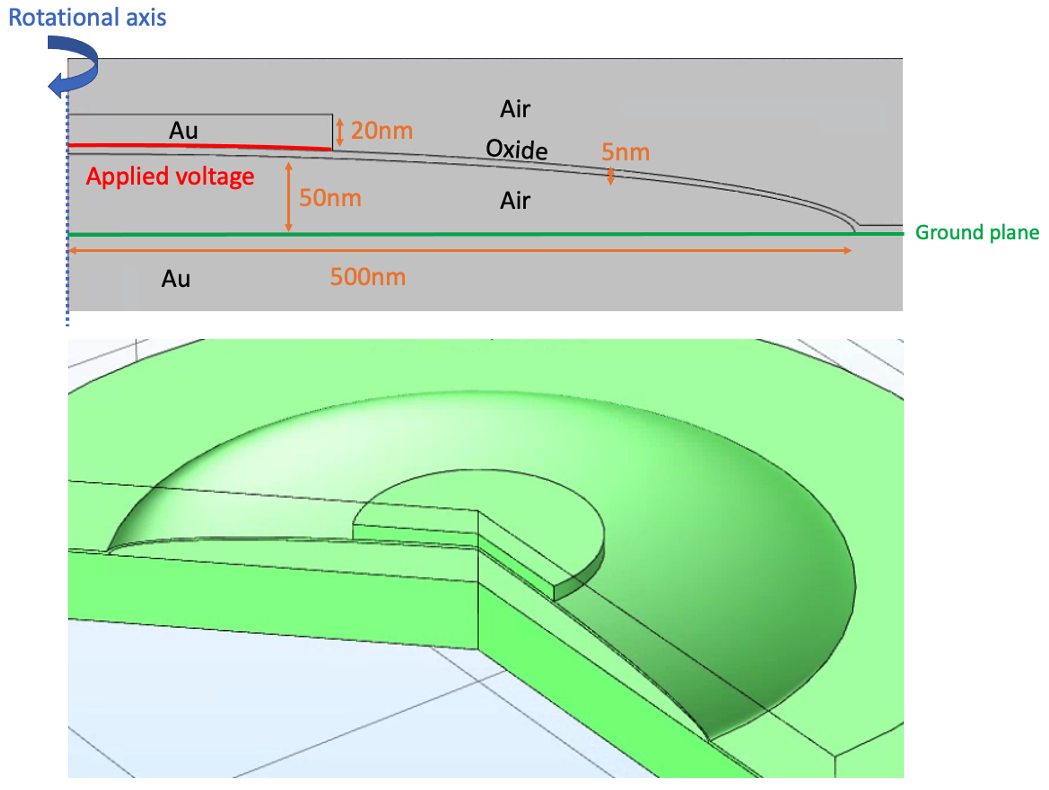
The modeled dome resonator geometry (Figure 3) is based on actual resonators fabricated experimentally. A 2D-axisymmetric COMSOL model is used in order to reduce computational load. An aluminum oxide 5nm-thin film is grown on a conductive gold substrate via atomic layer deposition (ALD). Through our postprocessing technique, a 1um-diameter circular portion of the film delaminates from the substrate to form a dome separated from the substrate by an air gap which is 50nm tall at its apex. Finally, a gold top electrode is patterned on top of the nanogapped dome. Ground is applied to the bottom electrode and a variable potential is applied to the top electrode. In this model, the delaminated portion of the oxide film is modeled as the difference between two concentric ellipses.
Three materials, air, Al2O3, and Au are utilized from COMSOL libraries. Air is modeled as a nonsolid. Al2O3 is modified to reflect literature values for the density, Young's modulus, and Poisson's ratio of an Al2O3 ultrathin film grown by ALD at 200C (3). The relative permittivity of Au is assumed to be 6.9 (4).
I utilize two COMSOL physics modules, Solid Mechanics and Electrostatics, as well as their joint Multiphysics pairing, Electromechanical Forces. For the Solid Mechanics module, I model the oxide and gold as linear elastic materials at room temperature and pressure. The bottom surface of the bottom electrode is fixed and all other surfaces are free to deform. For the Electrostatics module, charge is conserved throughout, with a zero charge constraint at the edges of the model. Ground is defined as the top surface of the bottom electrode while a variable potential is applied at the bottom surface of the top electrode.
Since computation time is fast for this two-dimensional axisymmetric model, I utilize COMSOL's automatically generated, physics-controlled Extremely Fine mesh, which proved to be suitable for the extreme aspect ratio involved in the oxide ultrathin film.
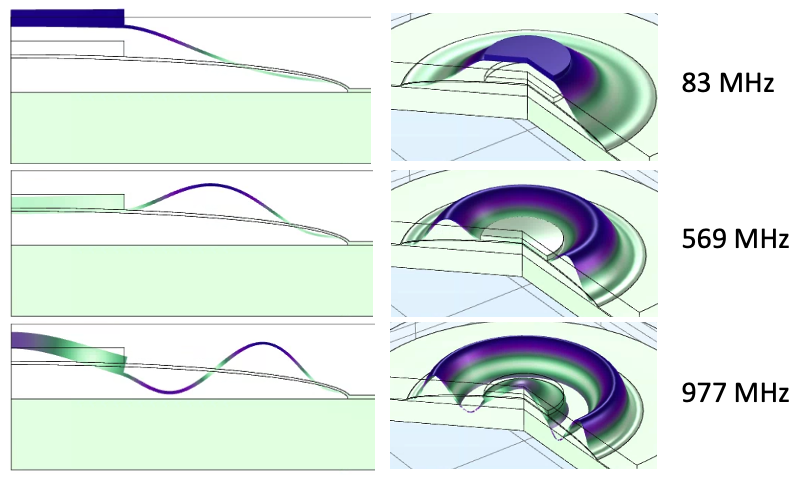
I used a COMSOL eigenvalue solver to search for the lowest 3 radially-symmetric eigenmodes of the mechanical vibration of the dome (Figure 4). Due to the 2D axisymmetric nature of the simulation, only radially-symmetric modes will be found by the solver. Since the fundamental frequency for this structure is about 83 MHz, it would be considered to resonate at the low end of the FM radio range.
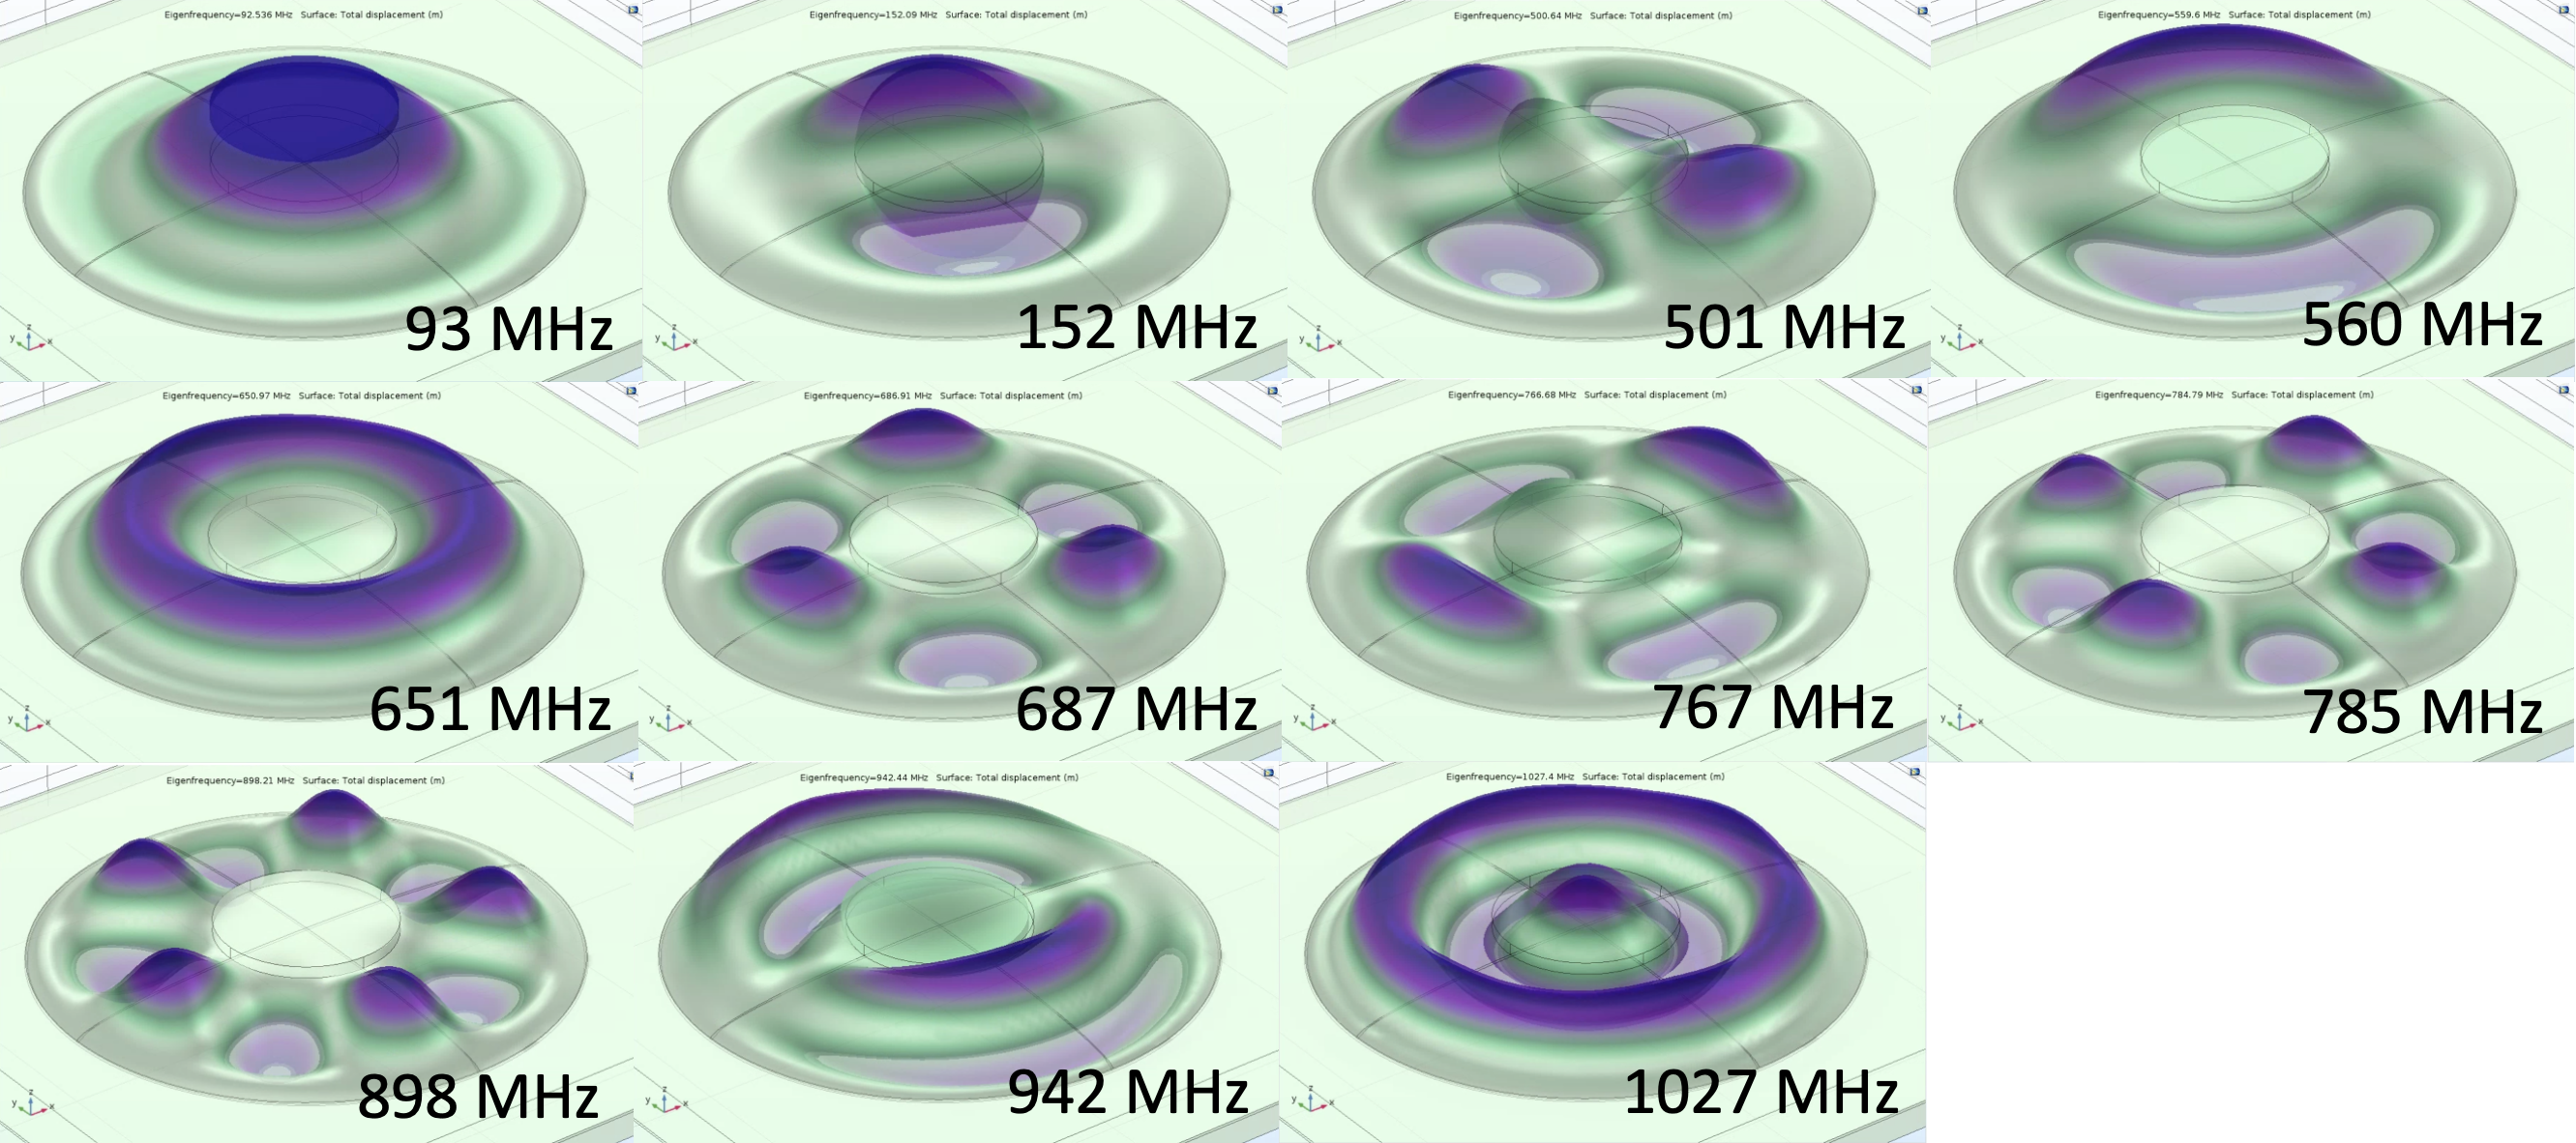
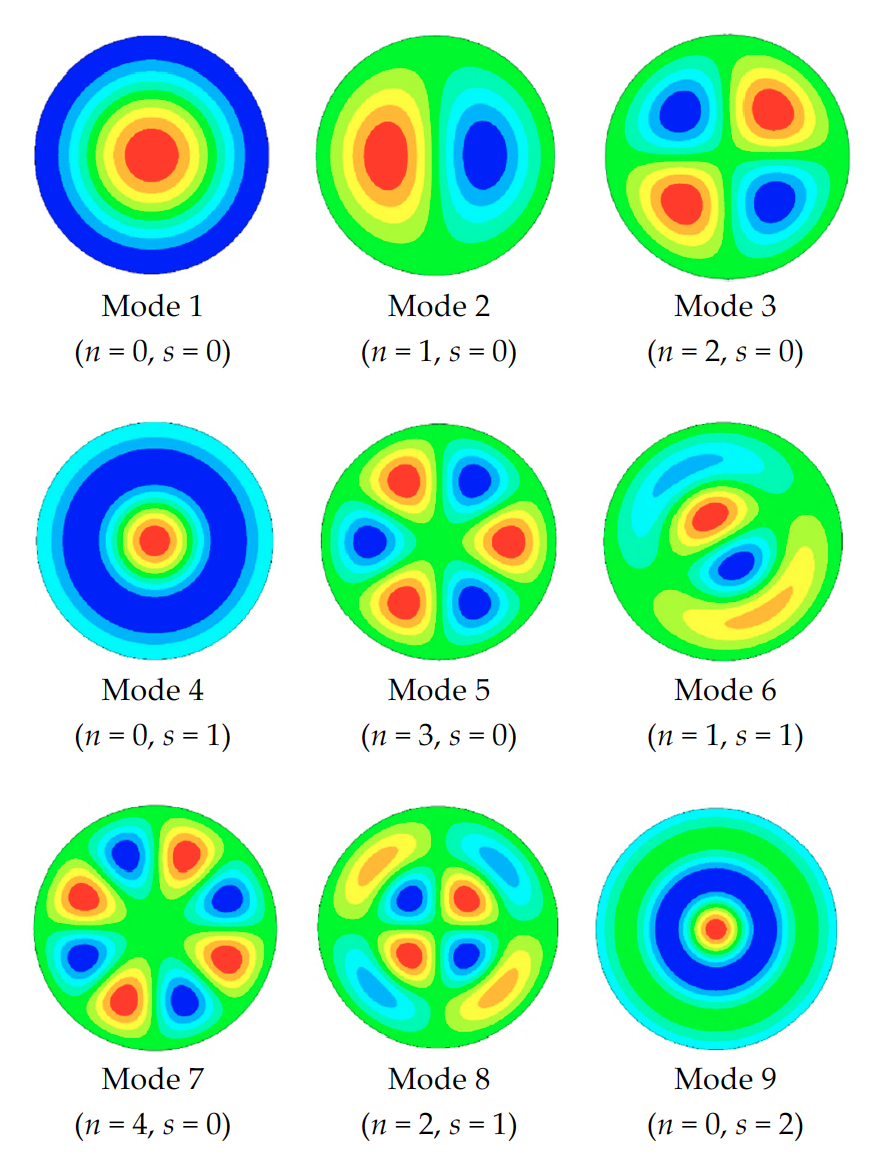
After realizing that my 2D-axisymmetric simulation found only the radially-symmetric modes, I redid my eigenfrequency simulation using a full 3D model, which had no symmetric constraints. This simulation revealed the mode shapes shown in Figure 5, with modes that are simple rotations of one another omitted for clarity. These vibrational modes are similar to what can be found in the literature for the mode shapes of a circular membrane, as shown in Figure 6.
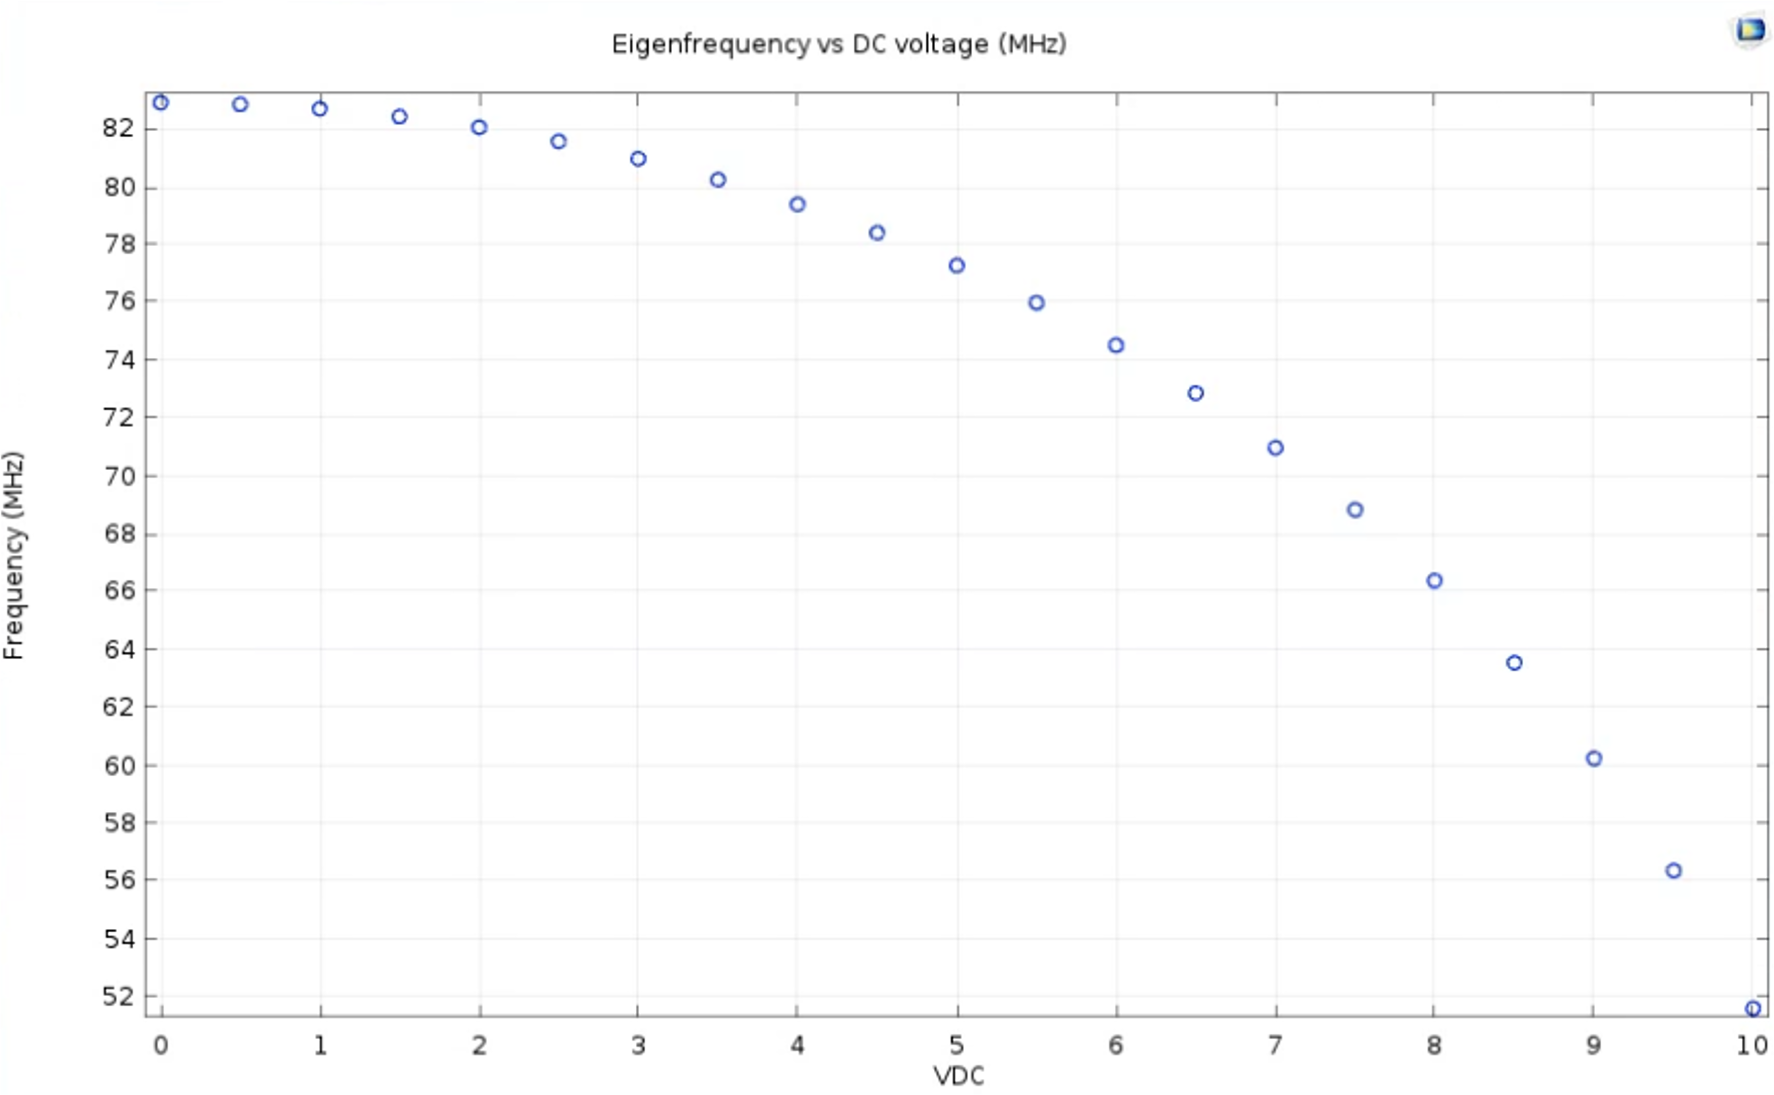
Tunability of the resonant frequency is an important attribute of resonators for applications such as radio filtering and mixing, so I studied the change in resonant frequency with applied DC bias. Applied bias causes an electrostatic force between the top and bottom electrodes that changes the forces at play in the resonator. As can be seen in Figure 7, there is an inverse relationship between DC bias voltage and the fundamental frequency of the resonator. This relationship is known as the "spring softening" effect. As the bias voltage increases, the membrane making up the dome deflects downwards, resulting in a closer distance between electrodes and therefore a stronger electrostatic force. This is equivalent to a relatively weaker upwards restoring force, or in the analogous mass-spring system, a smaller spring constant k. Since the resonant frequency relation in this analogous system is w = sqrt(k/m), the smaller k results in lower resonant frequency w.
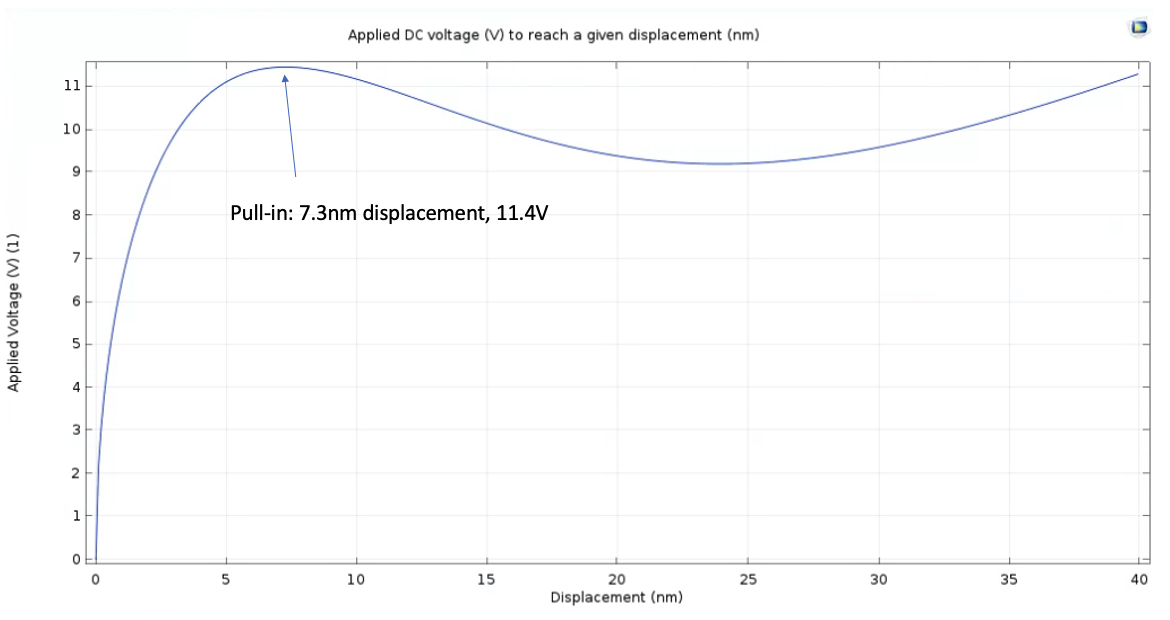
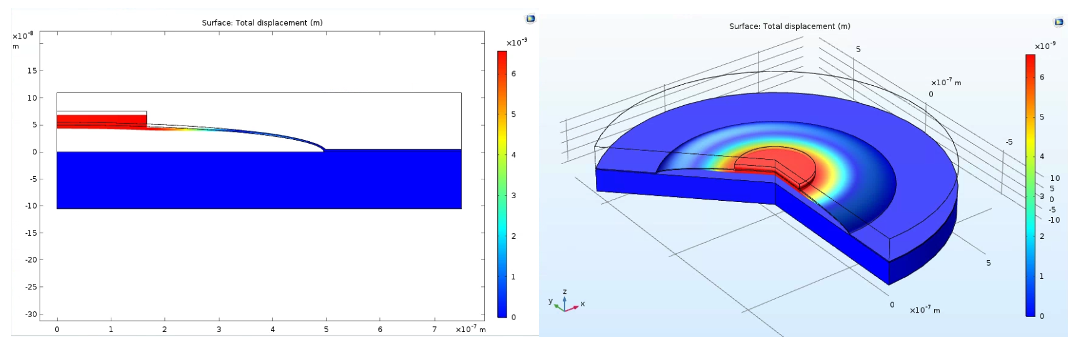
The control over fundamental frequency resultant from bias begs the question, what are the limitations on applied bias? The maximum bias that can be applied to a MEMS/NEMS structure before it becomes unstable, aka the point at which the downwards electrostatic attractive force matches the upwards mechanical restoring force, is known as the "pull-in" voltage. For many common MEMS structures such as cantilevers, the pull-in displacement is about 1/3 of the overall gap distance. To calculate the pull in voltage of my dome resonator, I had COMSOL solve an inverse problem to calculate the bias voltage required to achieve a given displacement of the apex of the dome; I calculated this voltage for a range of values for displacement, as can be seen in Figure 8. The pull-in point is represented in this plot by the local maximum at a displacement of 7.3nm and applied bias of 11.4V. The displacement of the structure at the pull-in point is visualized in Figure 9. This displacement is about half of the 1/3 total gap distance seen in other structures such as cantilevers. After this point, it becomes easier to achieve a given displacement due to the relatively stronger downwards electrostatic force, hence the decreasing curve. However, my plot contains a subsequent local minimum point, which is not seen in other types of MEMS/NEMS structures such as cantilevers. I hypothesize that the final, increasing portion of the curve is due to the compression of air trapped within the domed structure. After calculating the pull-in voltage, I can confirm that the device is able to operate with good stability at a bias less than 11.4V, for example 10V. At 10V bias, the resonant frequency shifts to about 52 MHz from the unbiased value of 83 MHz; this is a tunability of 37%, which is quite good compared to the state-of-the-art, for instance the electrostatically-tuned graphene membrane resonator in (8) which showed tunability of 14%.
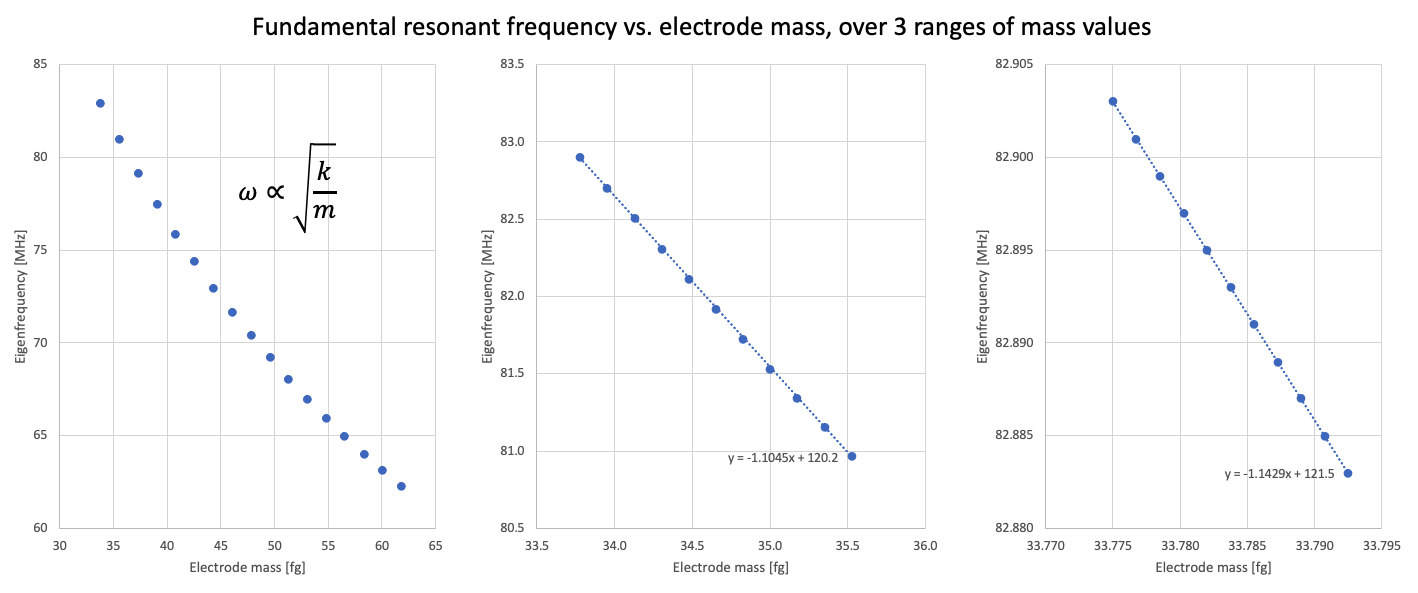
In order to probe the mass sensitivity of the nano-dome resonator, I used COMSOL to measure the fundamental frequency as a function of the density of the gold top electrode, which should act as a proxy for the detection of a particle. Increasing mass results in a decreasing resonant frequency due to the relationship w = sqrt(k/m). Figure 10 demonstrates the results of this study, where the resonant frequency is plotted as a function of the mass of the top electrode over several ranges of mass values. In the first plot, one can see the inverse square root dependence. In the subsequent two plots, zooming in to linearize around the initial, true mass of the electrode reveals a mass sensitivity of about 1.1 kHz per attogram, which is more than 10x more sensitive than the best peformance demonstrated in the reference paper (2) with the array of beam resonators. It is about 7x worse than the carbon nanotube resonator in (6), but is on the same order of magnitude and is far more stable for scalable fabrication. This simulation shows that nanodome resonators have the potential for extremely sensitive mass spectrometry or force sensing, perhaps better than the state-of-the-art.