LAB PROCESS SUMMARY:
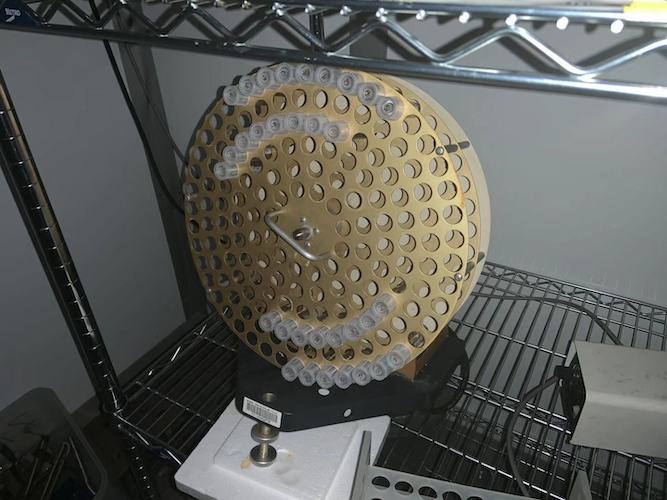
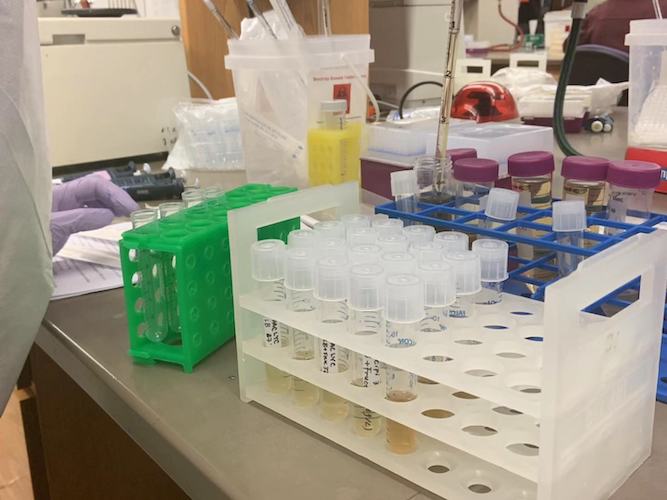
Setup 5.1 ml overnight cultures with conditions. For each condition, combine 5 ml of the specified media (already supplemented with chloramphenicol) and 100 ul of E coli from the starter culture with the specified plasmid content. Prepare duplicates for each condition for 24 new subcultures samples in total. Then Grow cultures for 20-24 hours in the circular roller drum (set to 7) within the appropriate warm room for each condition.
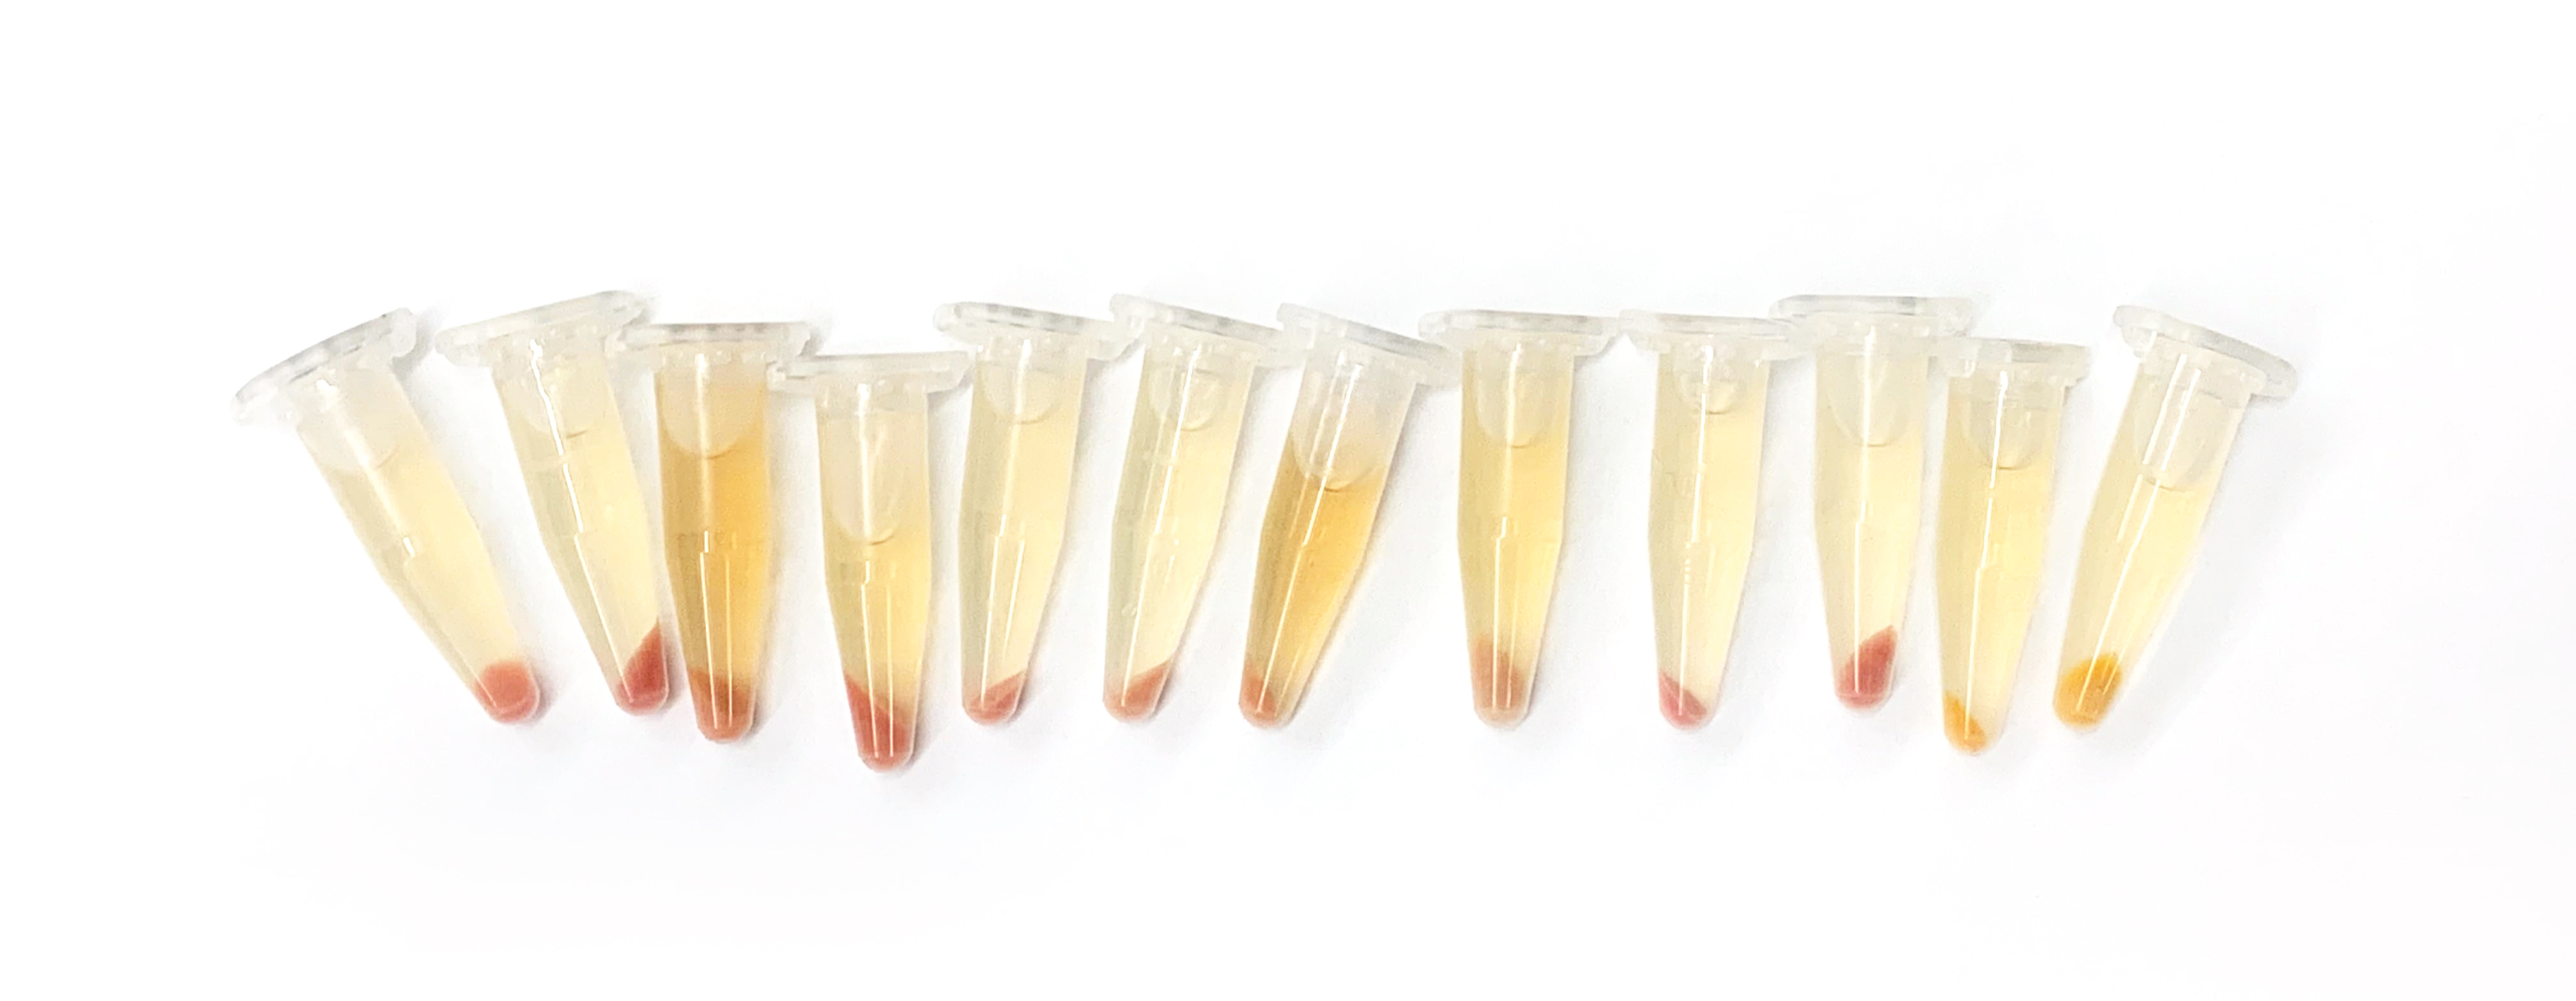
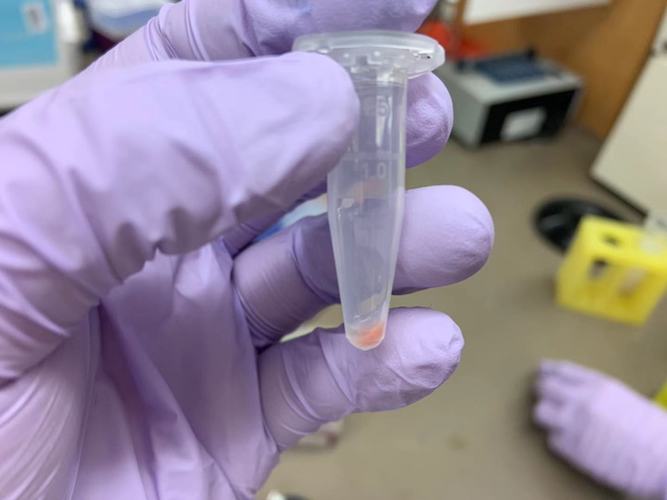
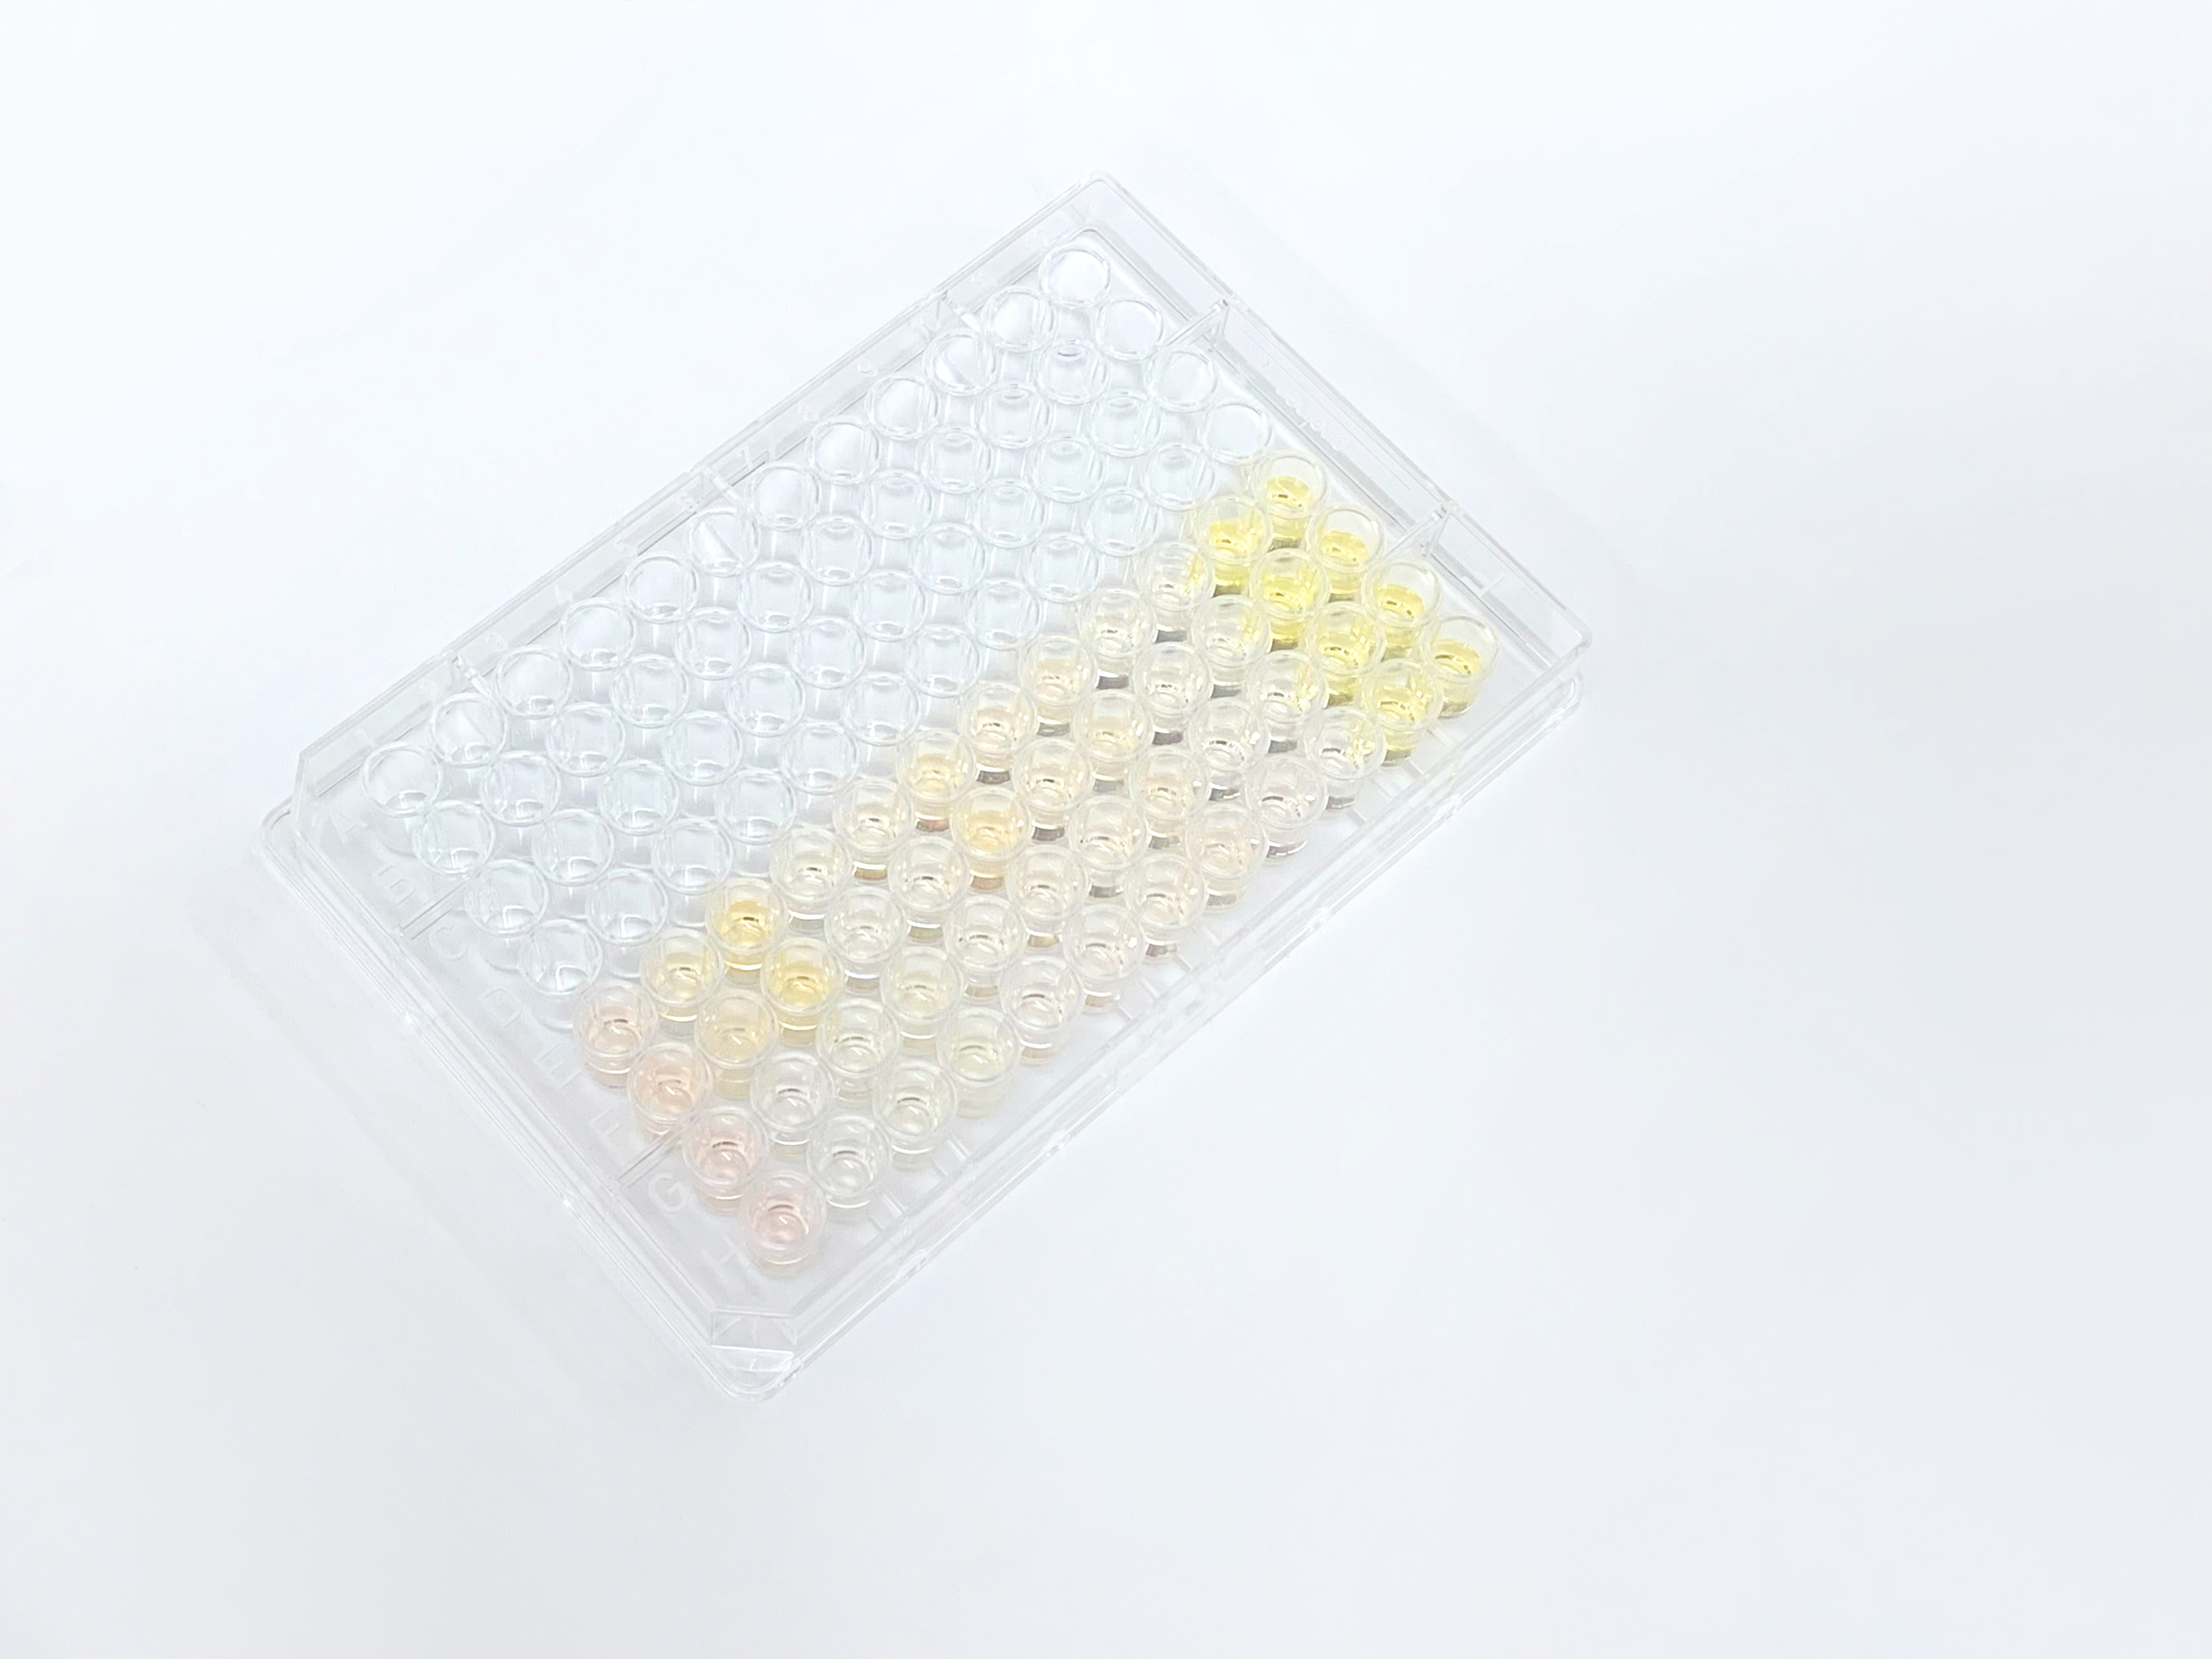
For each sample, concentrate a pellet. Make sure the bacteria within the sample are at homogenous density; Fasten the culture tube's cap tight and vortex sample as necessary. Apply 300 uL acetone to each sample's pellet and pipette up and down until the pellet is resuspended. The acetone will precipitate cellular proteins and the carotenoid pigment will go into solution. Isolate acetone-dissolved pigment from solid cellular precipitate. Measure the absorption spectrum of all wells on the full 96-well plate using the BioTek plate reader. To compare relative pigment production per cell, normalize each sample's absorption peak measurement for the relevant pigment by the OD600 measurement from the corresponding bacterial culture.
This lab wasn't completely skills heavy, but rather very repetitive. Transferring the culture and concentrating the pallet required a lot of pipetting and patience to ensure the accuracy (as 24 samples can mix up rather easily and the labels could be very easily messed up.
The readings from the plate reader showed some inconsistency for three of the results that could be due to error during the liquid handling process. Otherwise, the result graphs displayed good
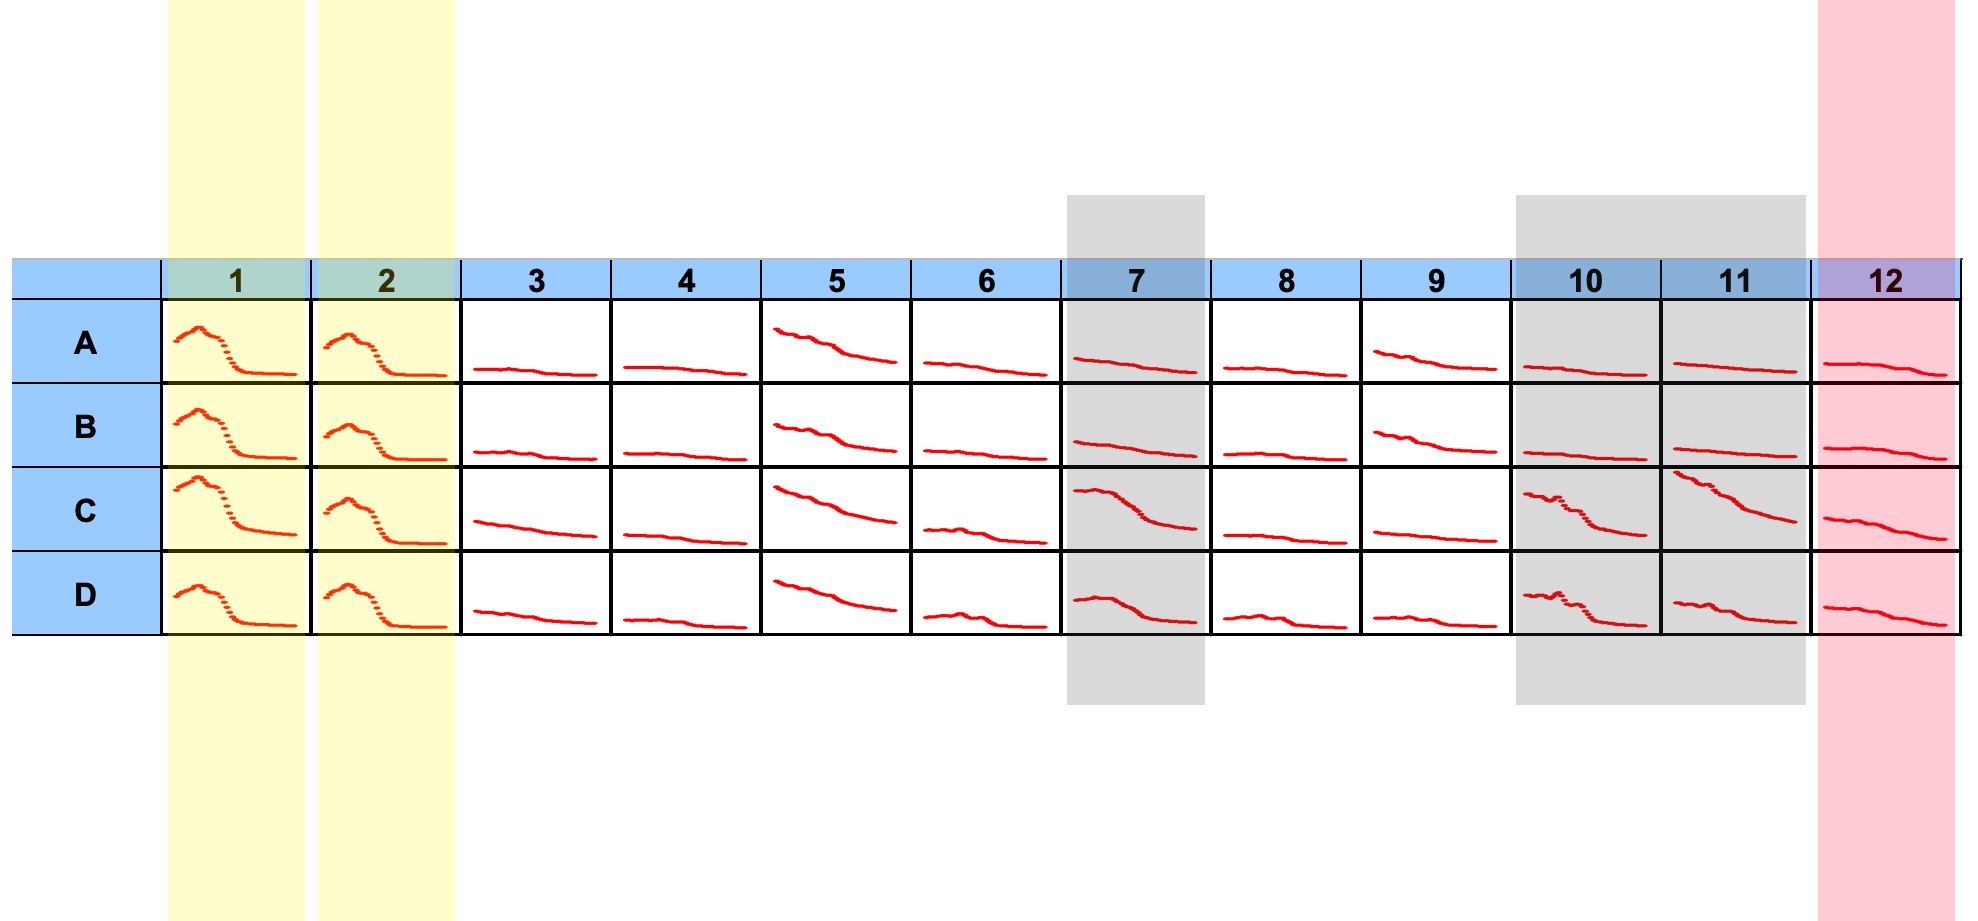
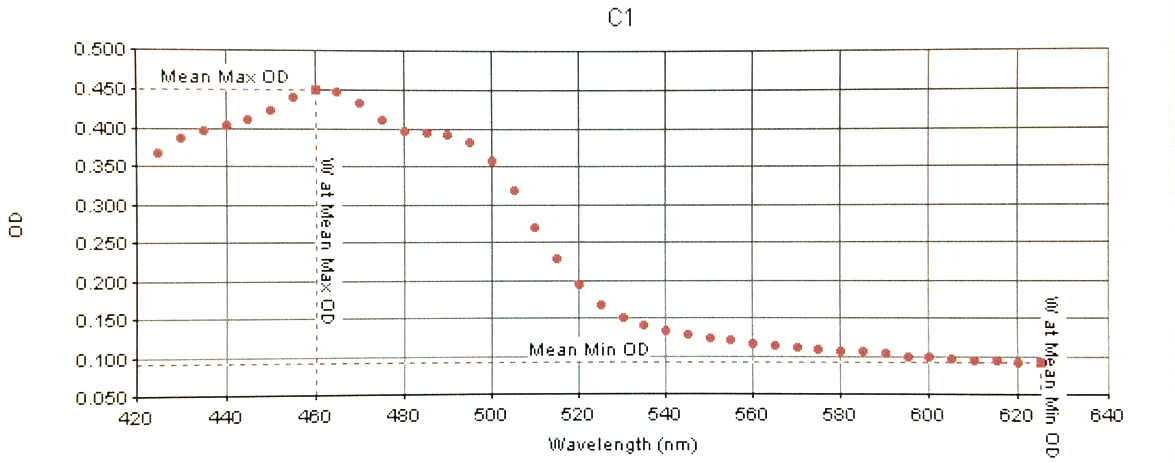
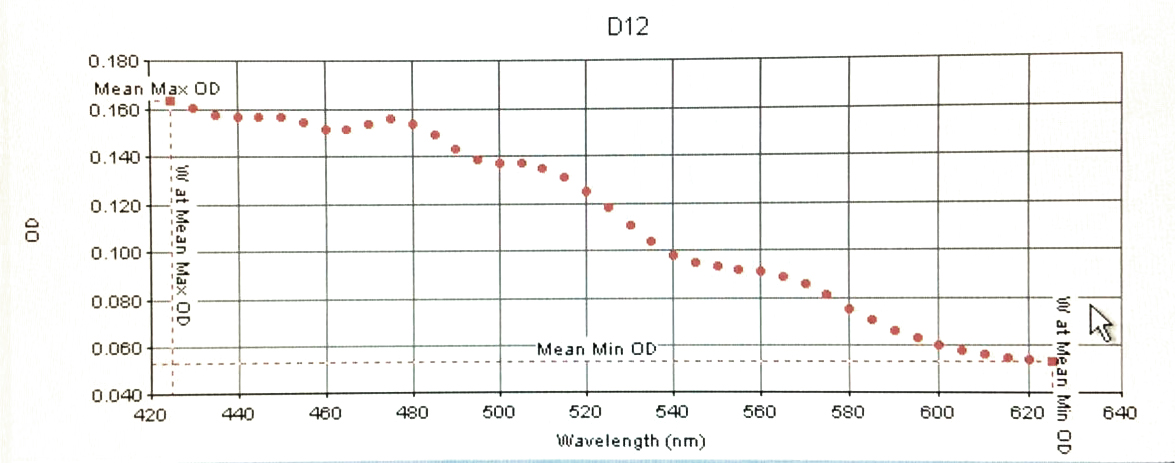
Below are the specific readings of BETAipi/LB+Fruc (C1 / left) and LYCipi/LB (D12 / right) displaying different peaks of Absorbance at different UV visable wavelengths.
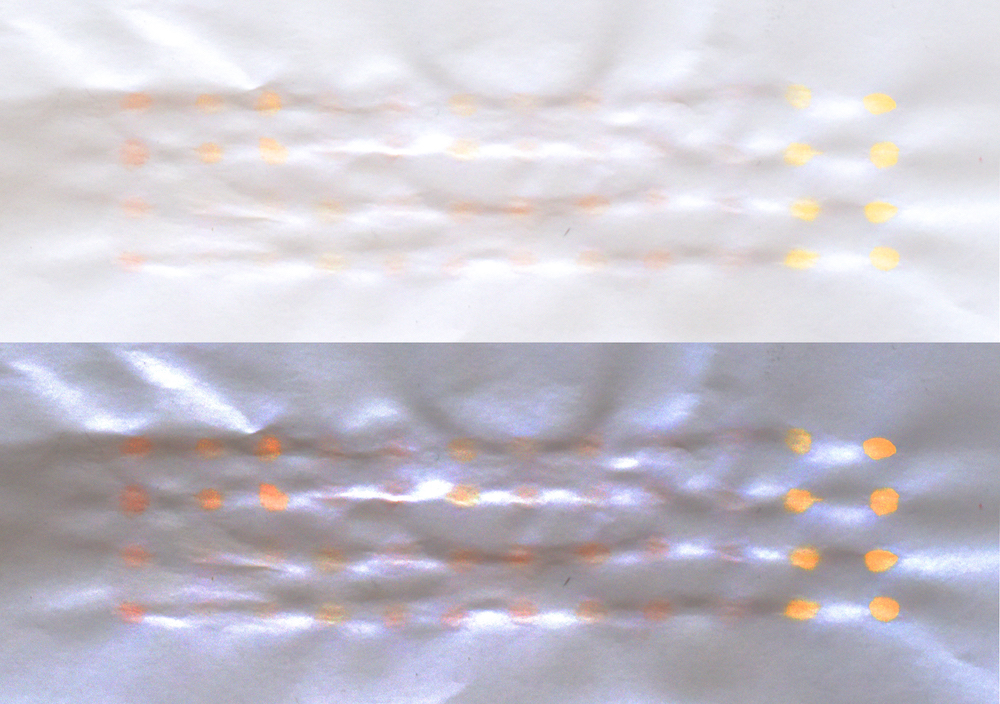
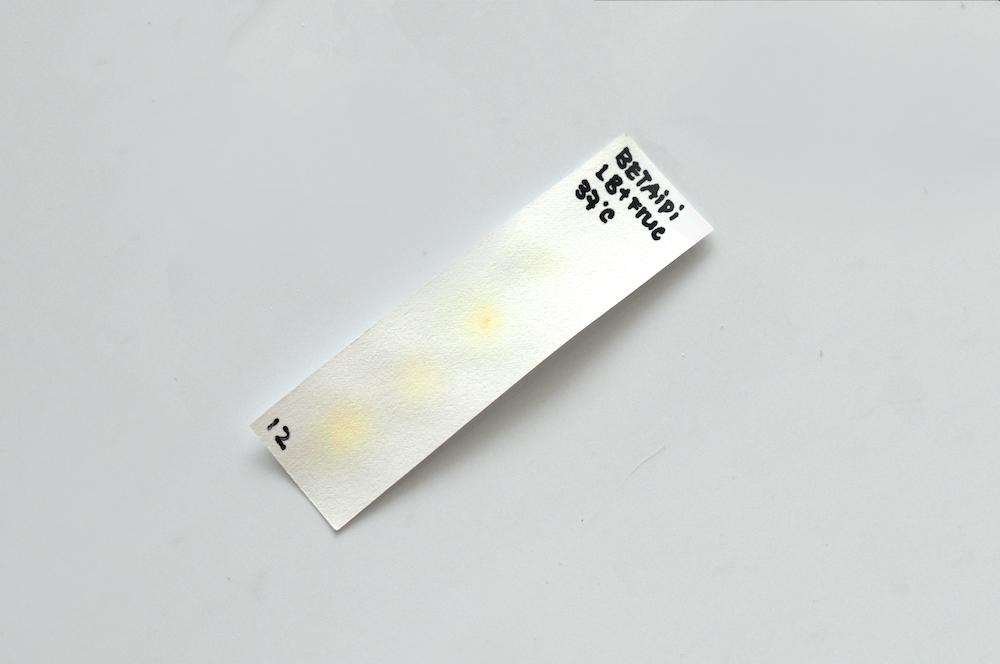
display of pigments on a sheet of printing paper with ^ (original photo) and v being a color-enhanced version through adjusting image brightness / saturation levels. below is a test with beta-carotene on whatman paper, which somehow was less obvious.
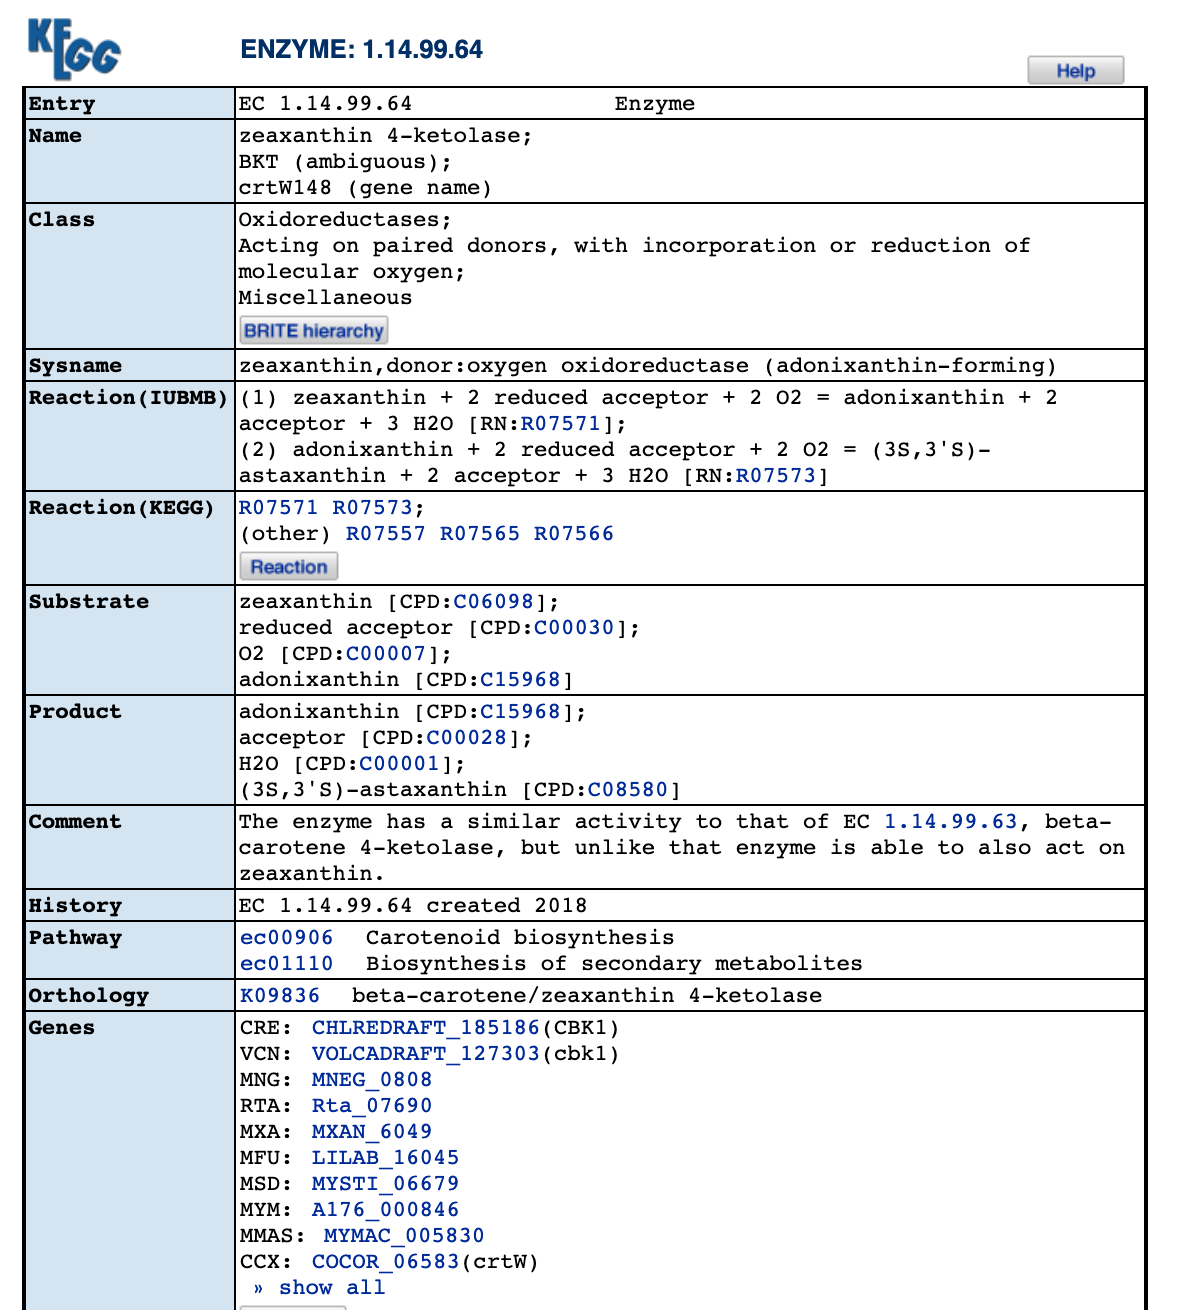
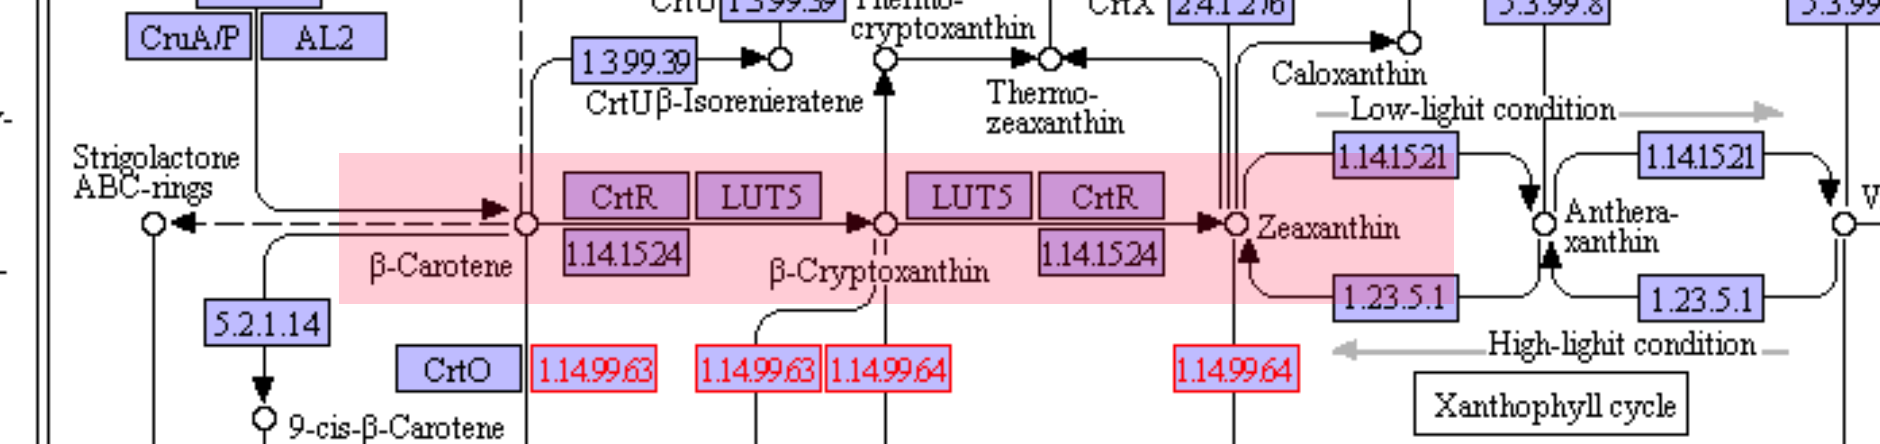
Additional information on beta-carotene and the conversion process to zeaxanthin through enzymes.