In [1]:
from numpy import *
%pylab inline
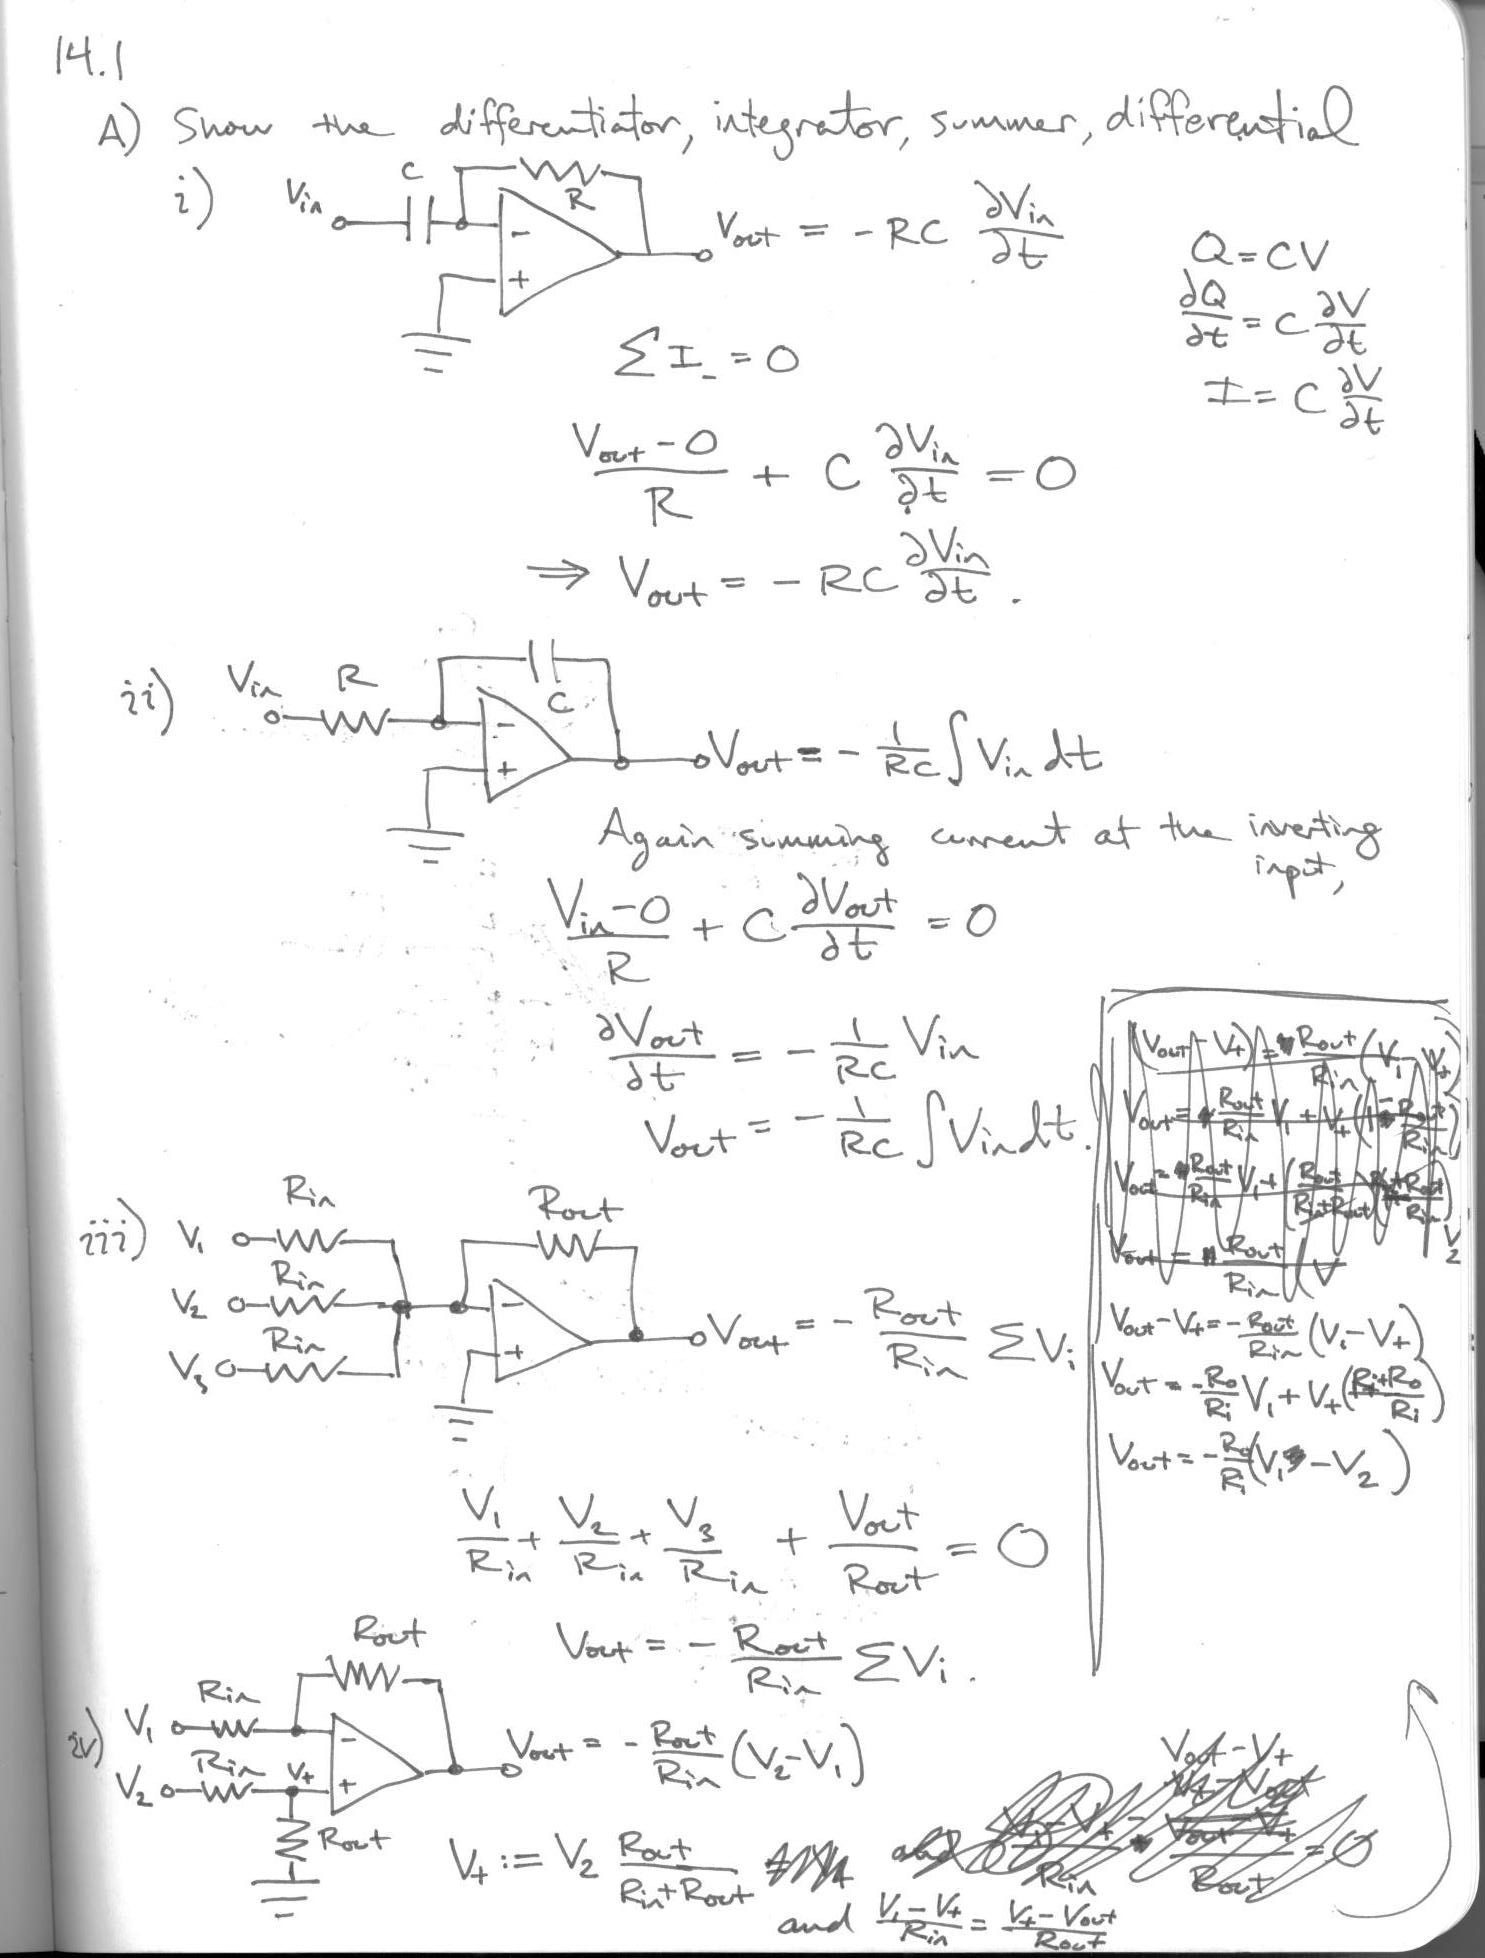
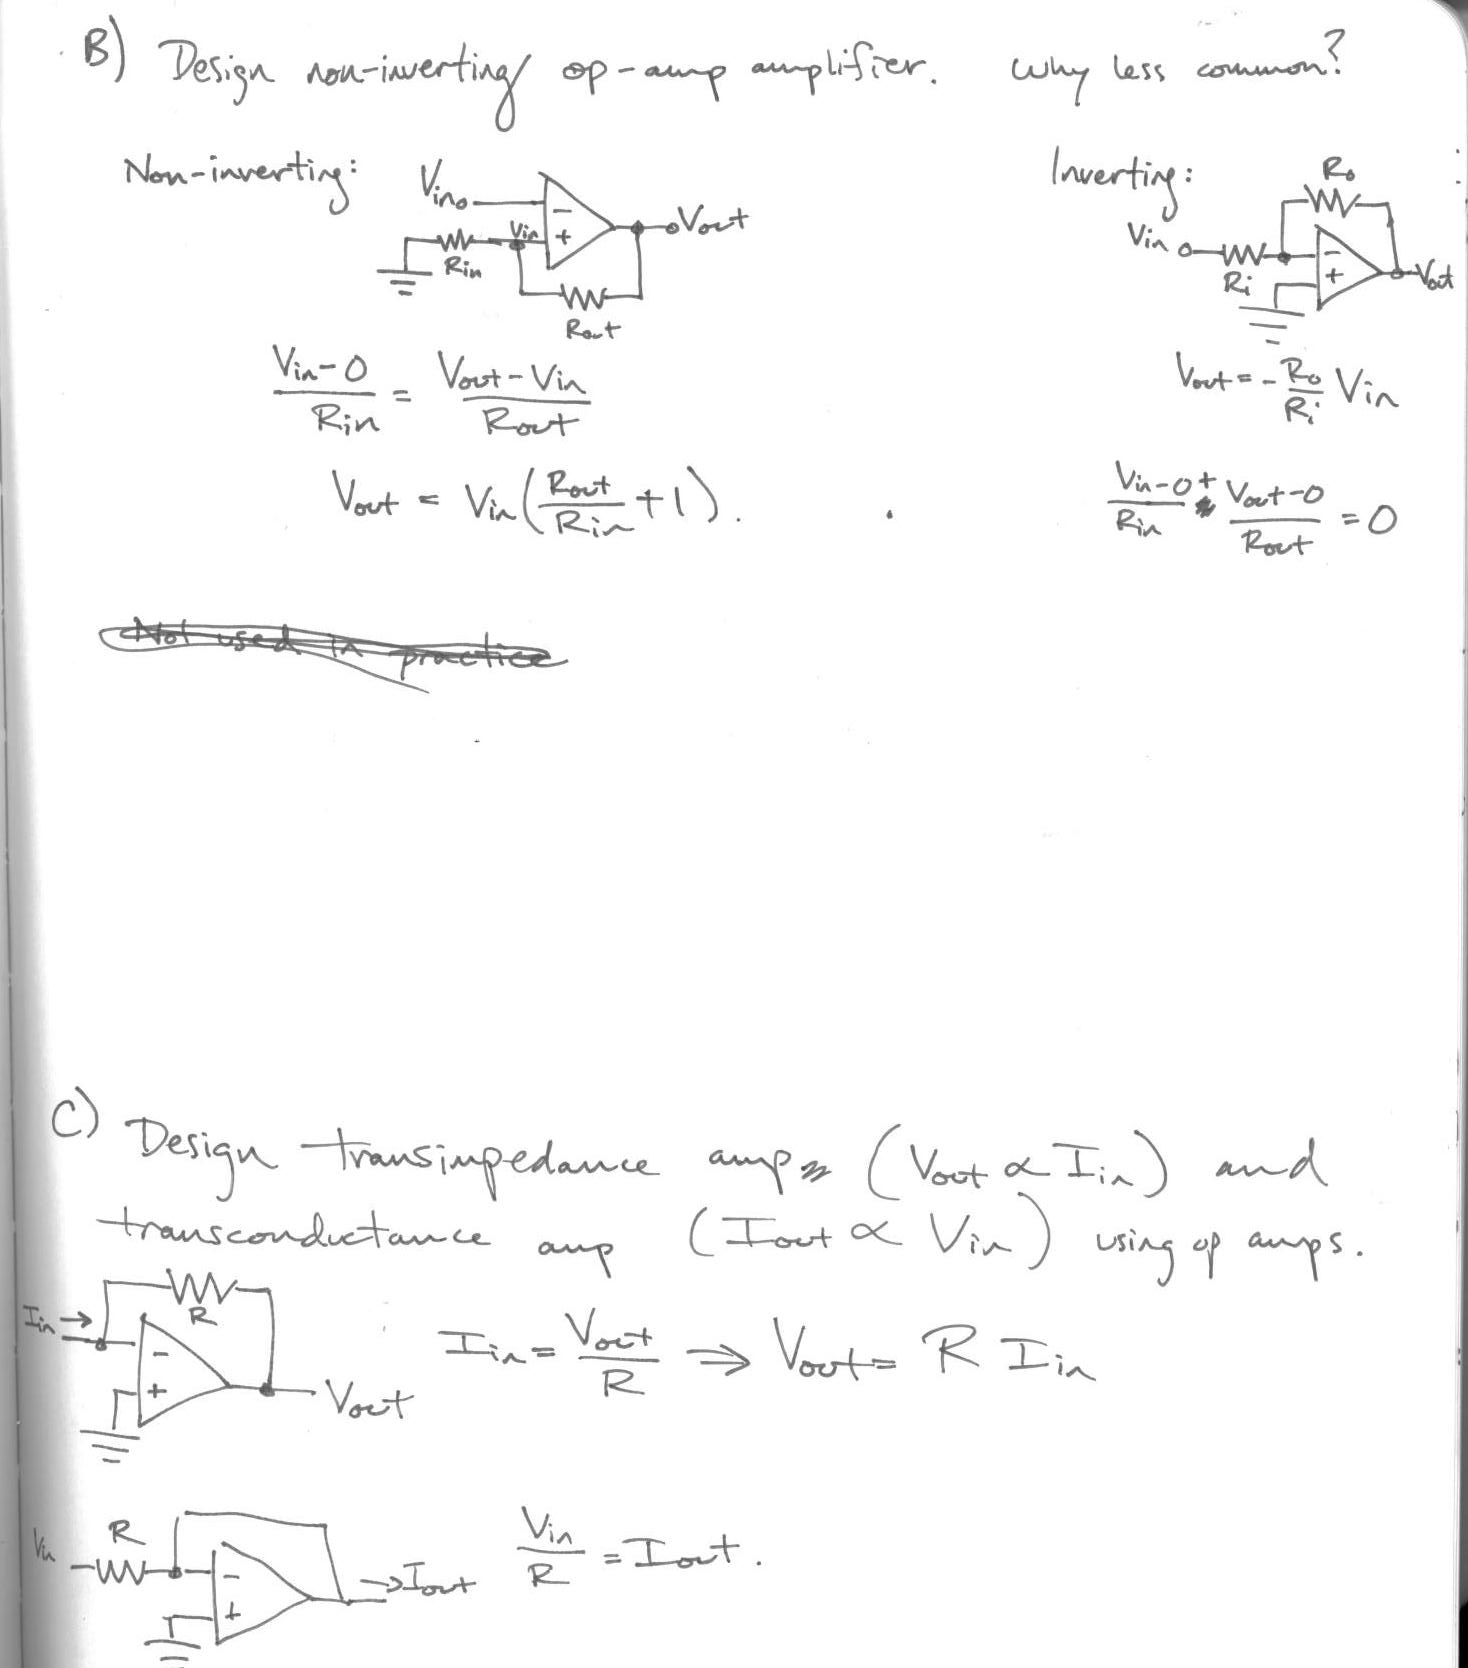
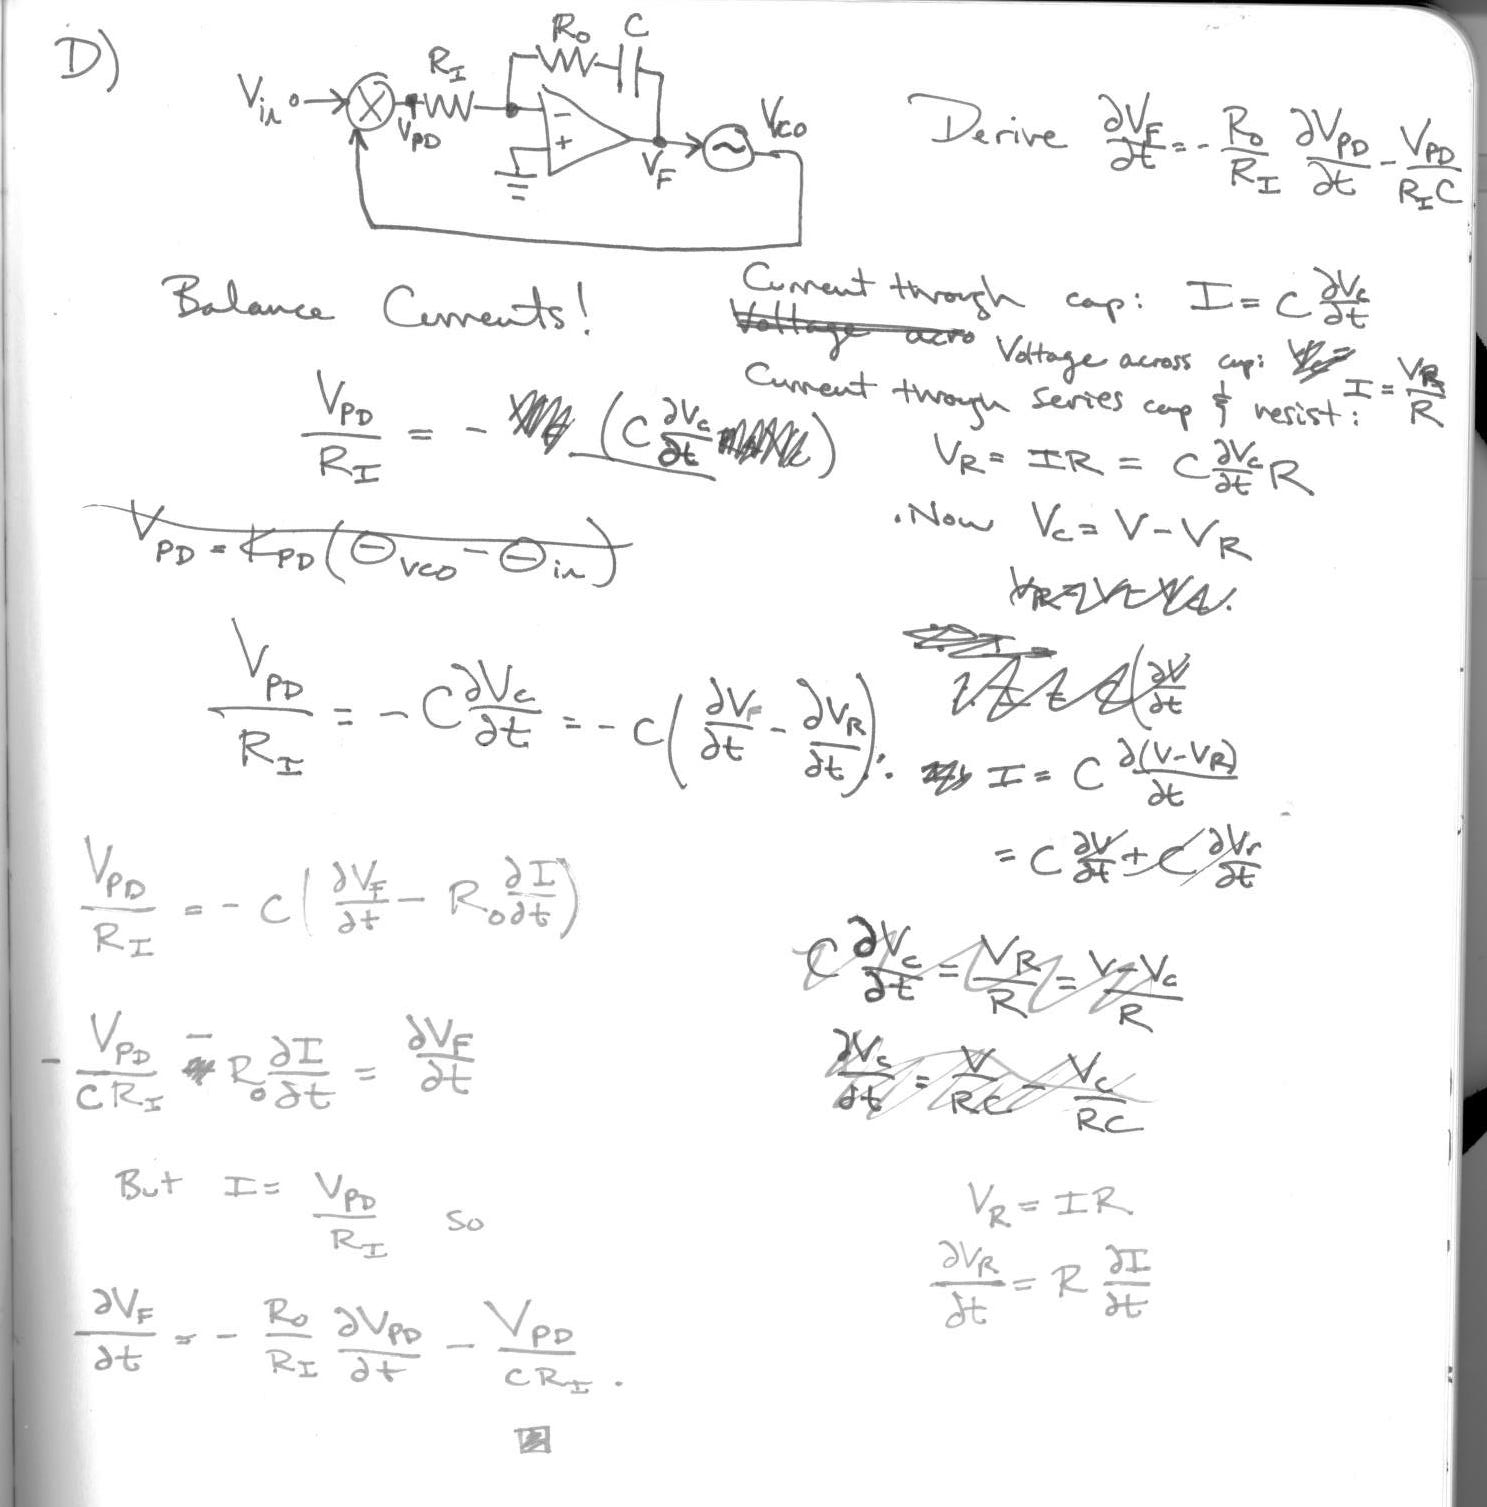
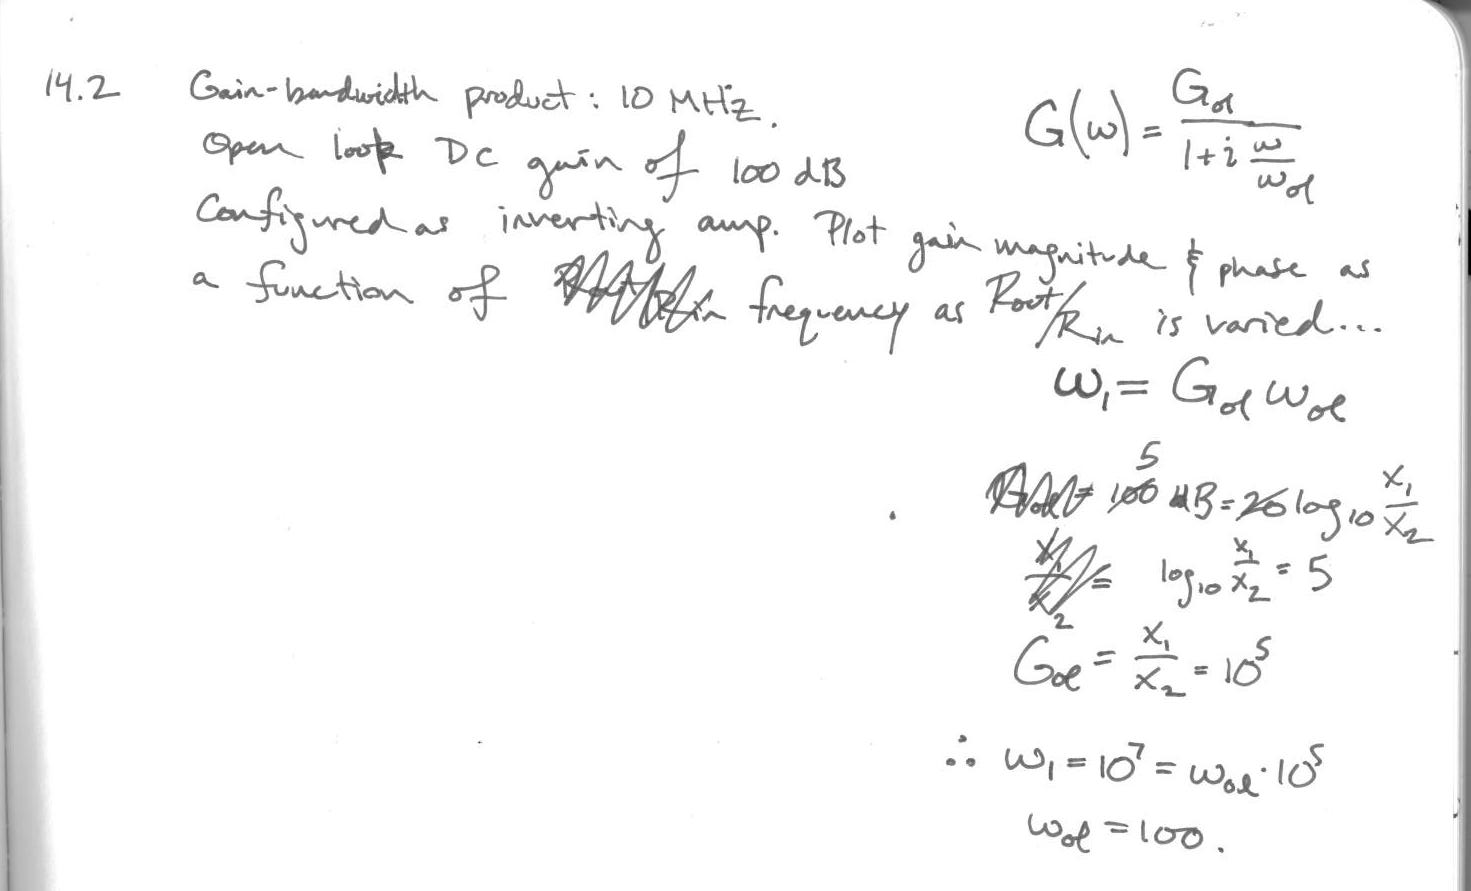
14.2
In [27]:
def G(w,G_ol,w_1):
    #calculate gain of op amp with open loop gain of G_ol and gain-bandwidth product of w_1
    #G_ol = 10**(G_ol/20.)
    w_ol = w_1/G_ol
    return G_ol/(1+1j*w/w_ol)
In [29]:
G_ol = 1e5
w_1 = 1e7
w = linspace(0,5*(w_1/G_ol),100)

fig, ax1 = plt.subplots()
title("Gain vs. Frequency for Op Amp (R_out/R_in = $\infty$)")
ax1.plot(w,absolute(G(w,G_ol,w_1)),'b')
ax1.set_xlabel('Frequency (Hertz)')
# Make the y-axis label and tick labels match the line color.
ax1.set_ylabel('Magnitude of Gain', color='b')
for tl in ax1.get_yticklabels():
    tl.set_color('b')
ax2 = ax1.twinx()
ax2.plot(w,angle(G(w,G_ol,w_1)),'g')
ax2.set_ylabel('Phase of gain (radians)', color='g')
for tl in ax2.get_yticklabels():
    tl.set_color('g')

In [31]:
G_ol = 1e3
w_1 = 1e7
w = linspace(0,5*(w_1/G_ol),100)

fig, ax1 = plt.subplots()
title("Gain vs. Frequency for Op Amp (R_out/R_in = %d)"%G_ol)
ax1.plot(w,absolute(G(w,G_ol,w_1)),'b')
ax1.set_xlabel('Frequency (Hertz)')
# Make the y-axis label and tick labels match the line color.
ax1.set_ylabel('Magnitude of Gain', color='b')
for tl in ax1.get_yticklabels():
    tl.set_color('b')
ax2 = ax1.twinx()
ax2.plot(w,angle(G(w,G_ol,w_1)),'g')
ax2.set_ylabel('Phase of gain (radians)', color='g')
for tl in ax2.get_yticklabels():
    tl.set_color('g')

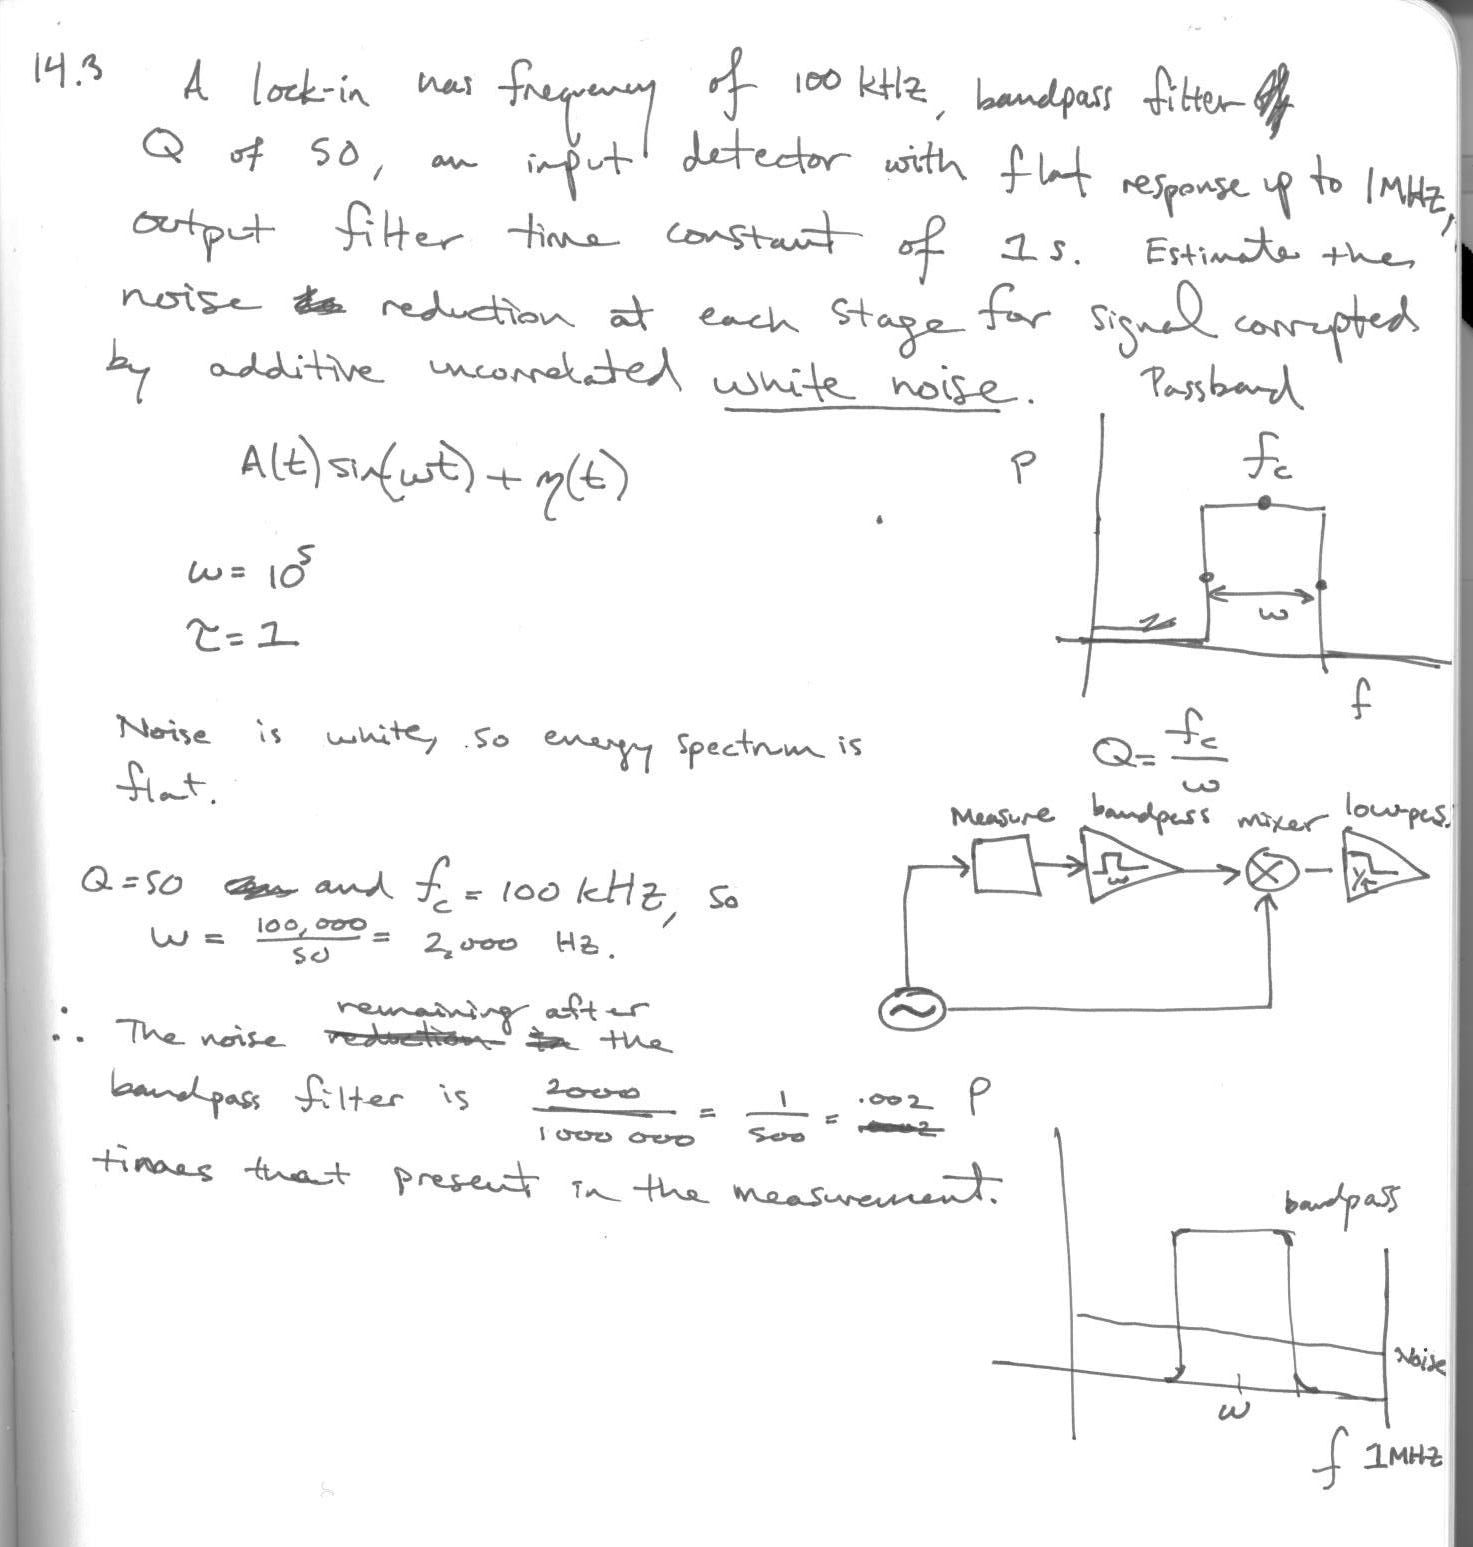
14.3
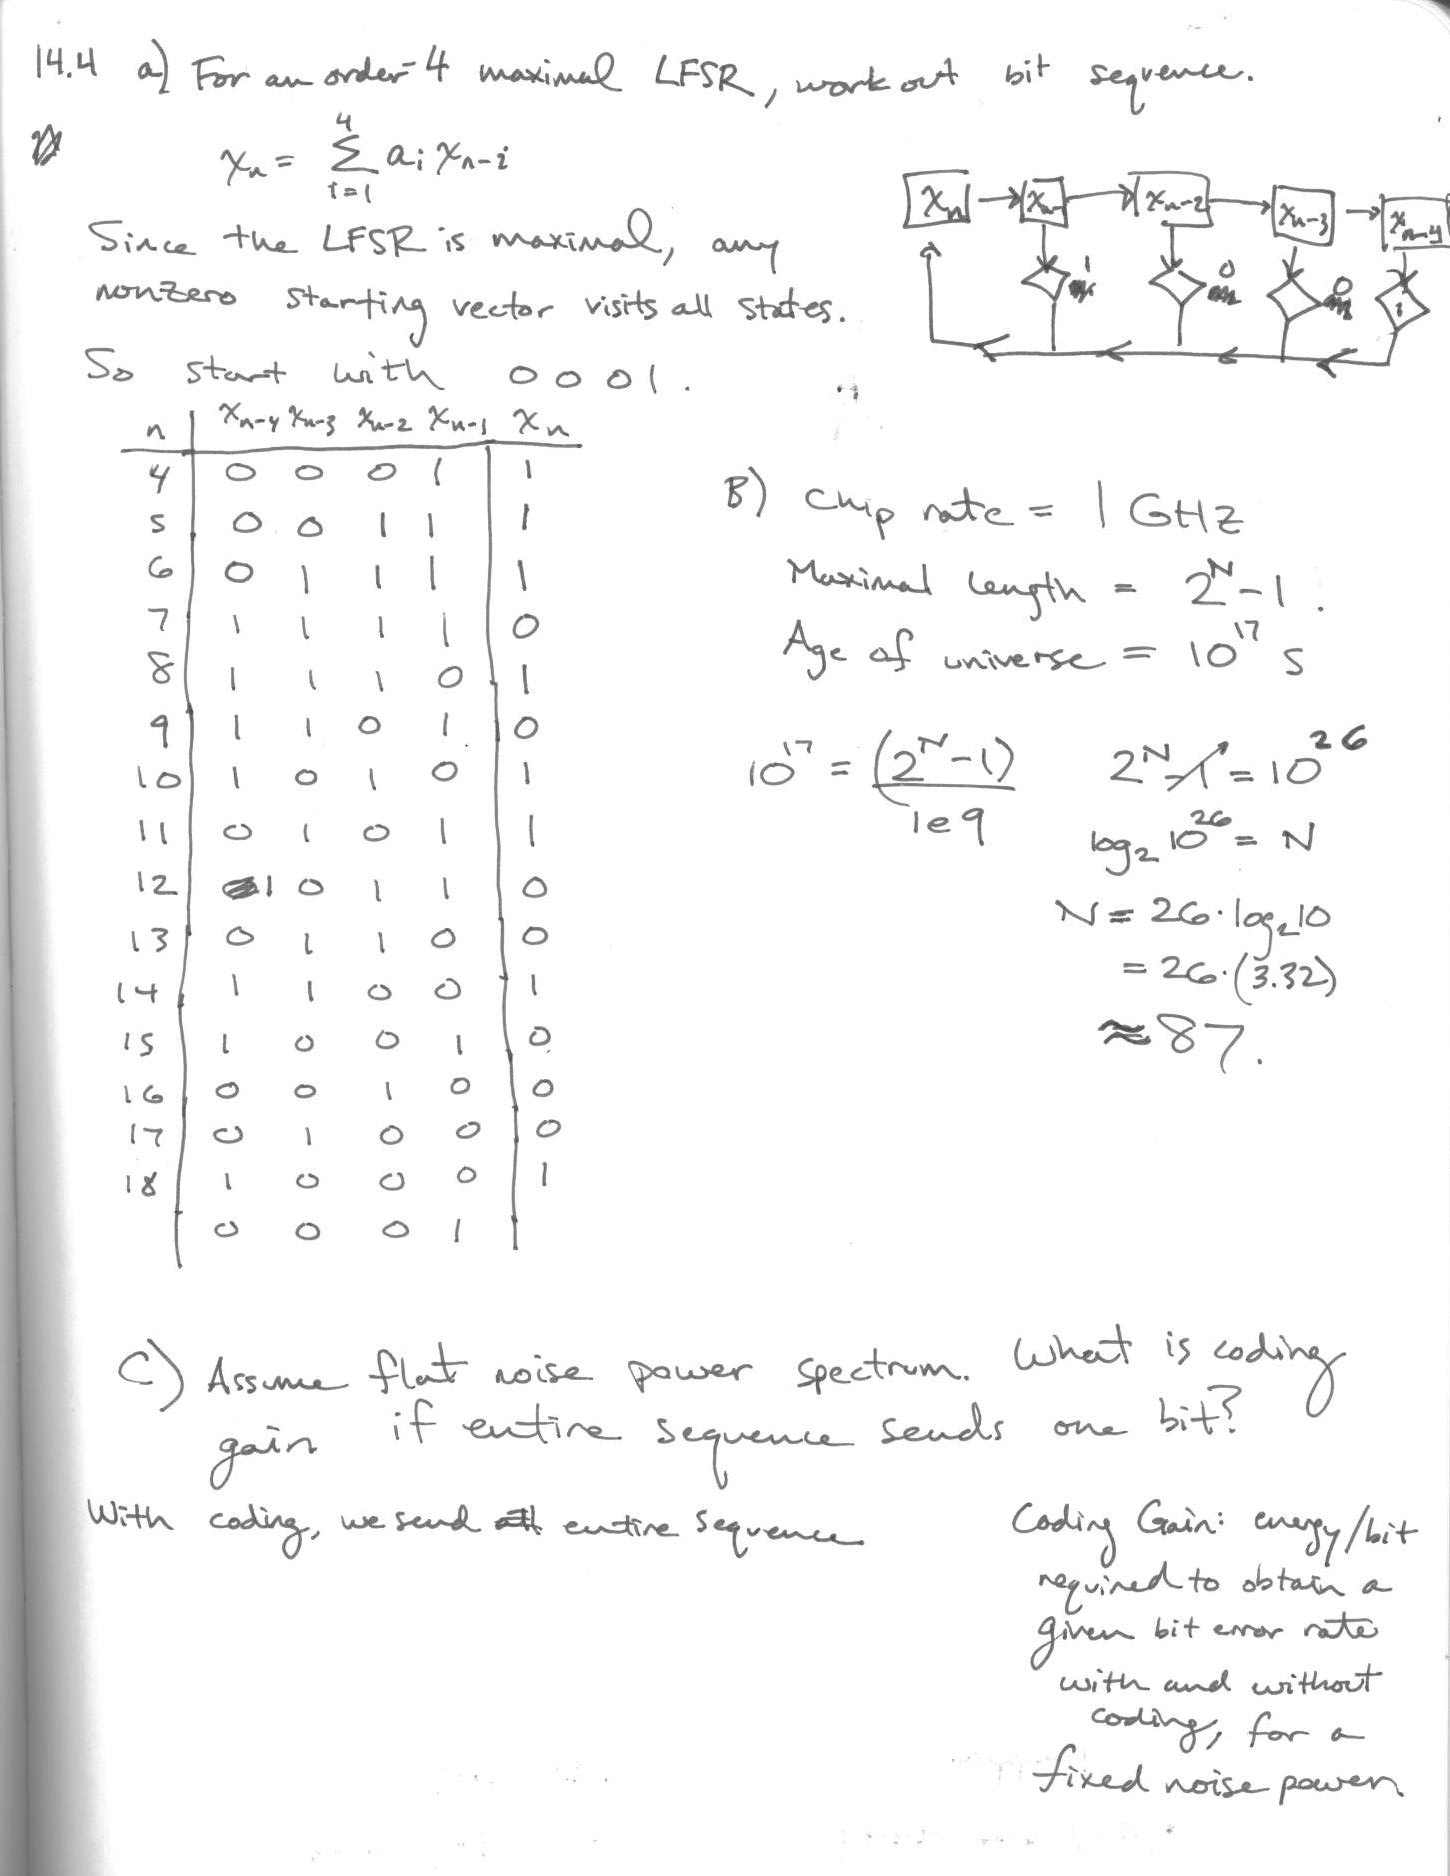
14.4
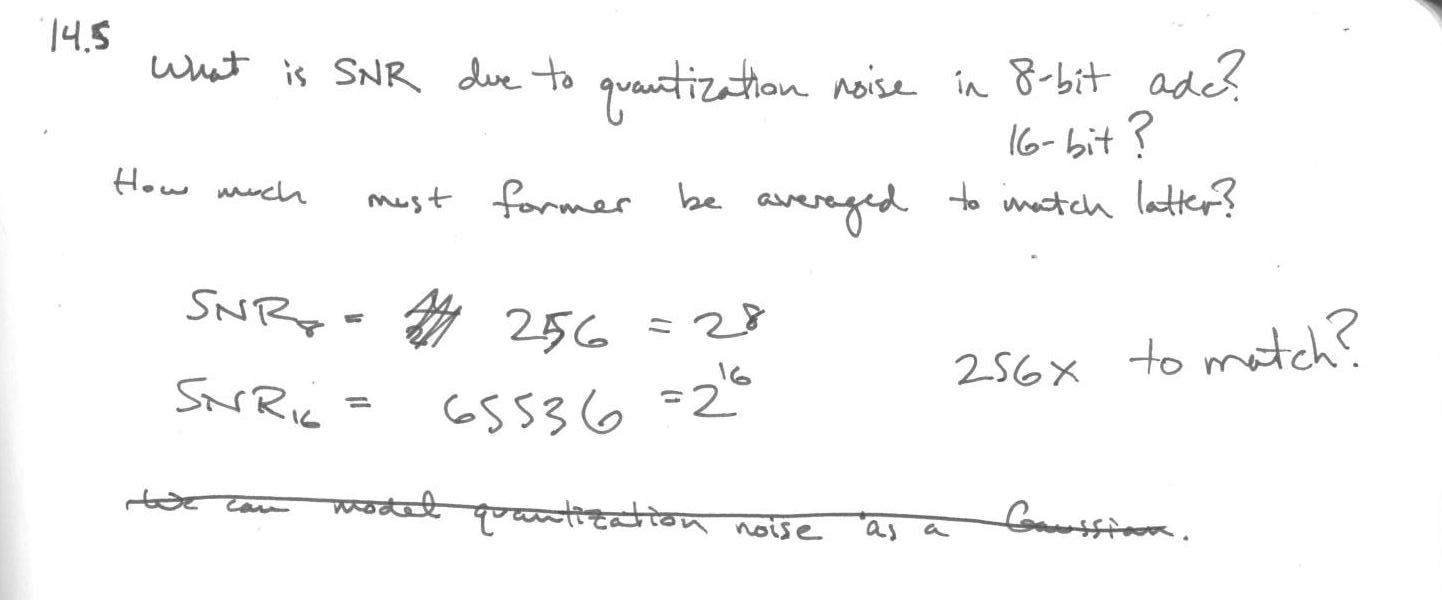
14.5
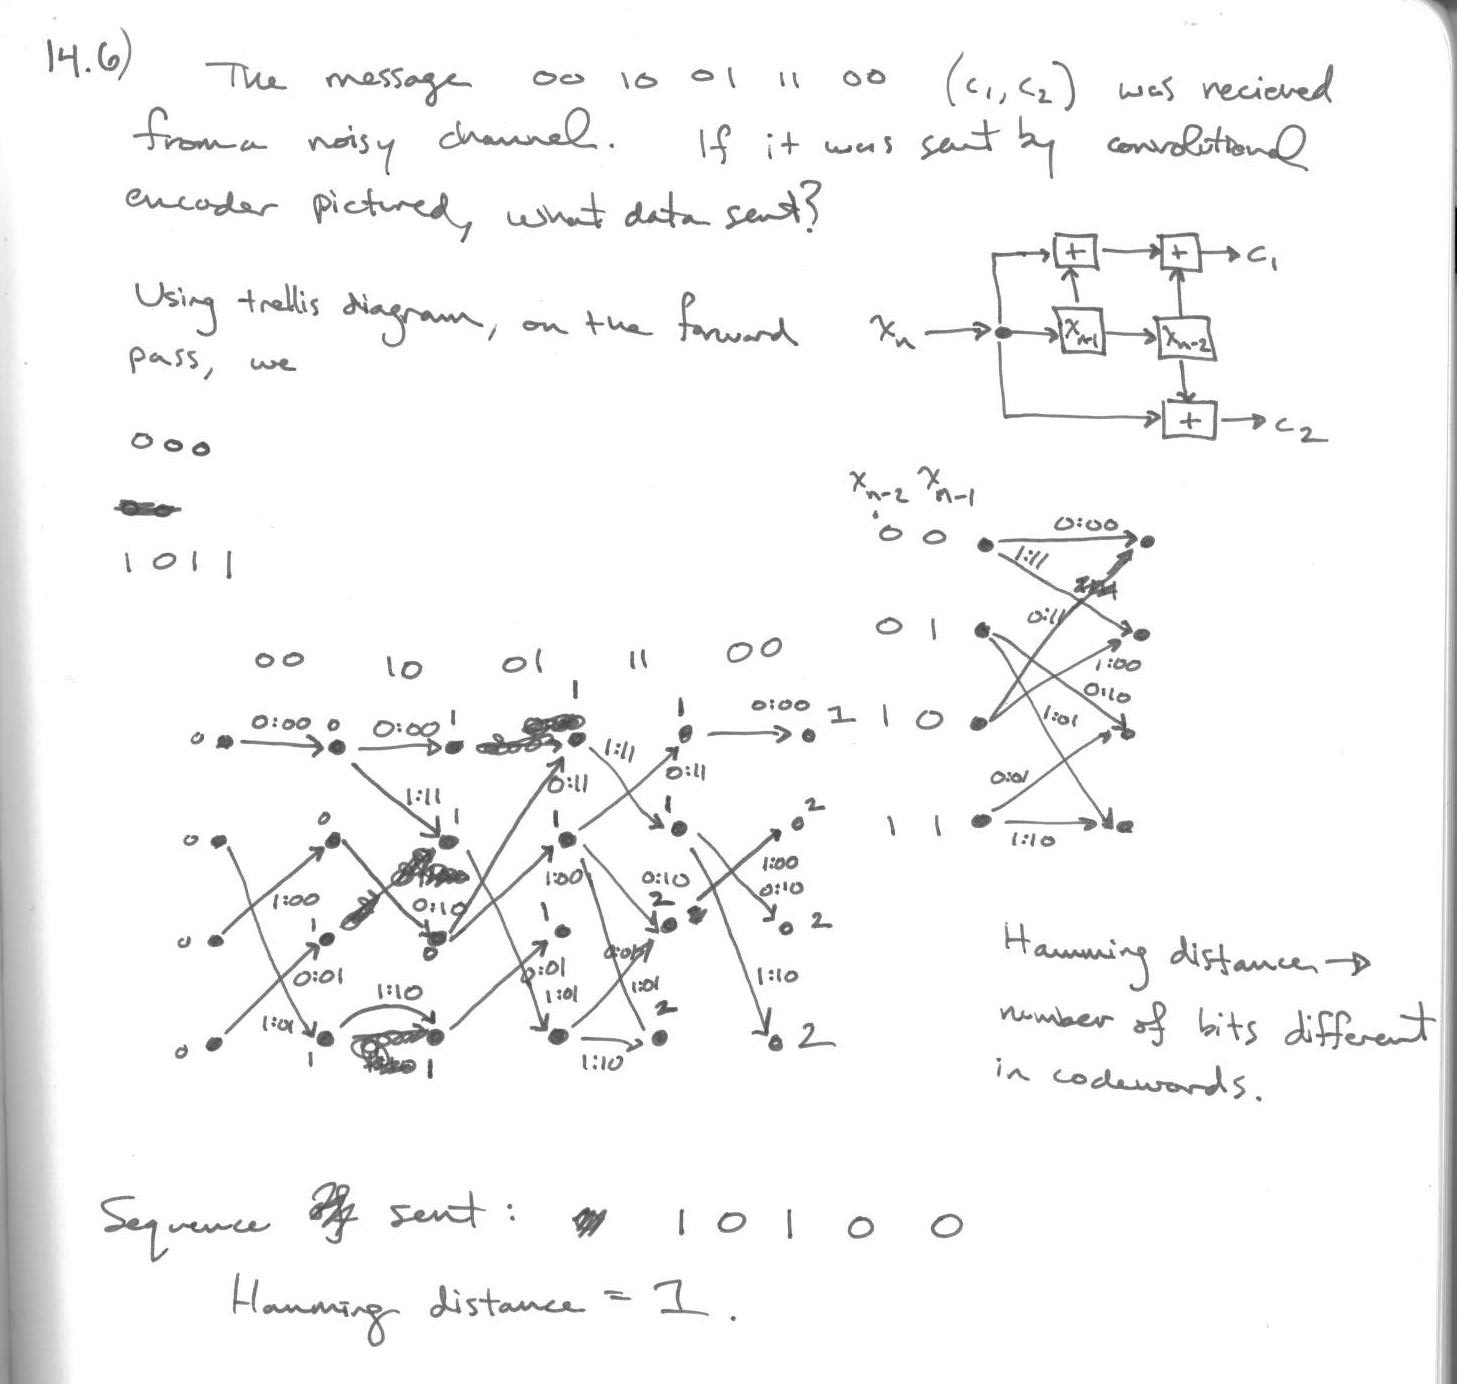
14.6
In [ ]: