Final Interface
This week I made a python matplotlib plotter for the microphone circuit for my final project. The code can be downloaded here
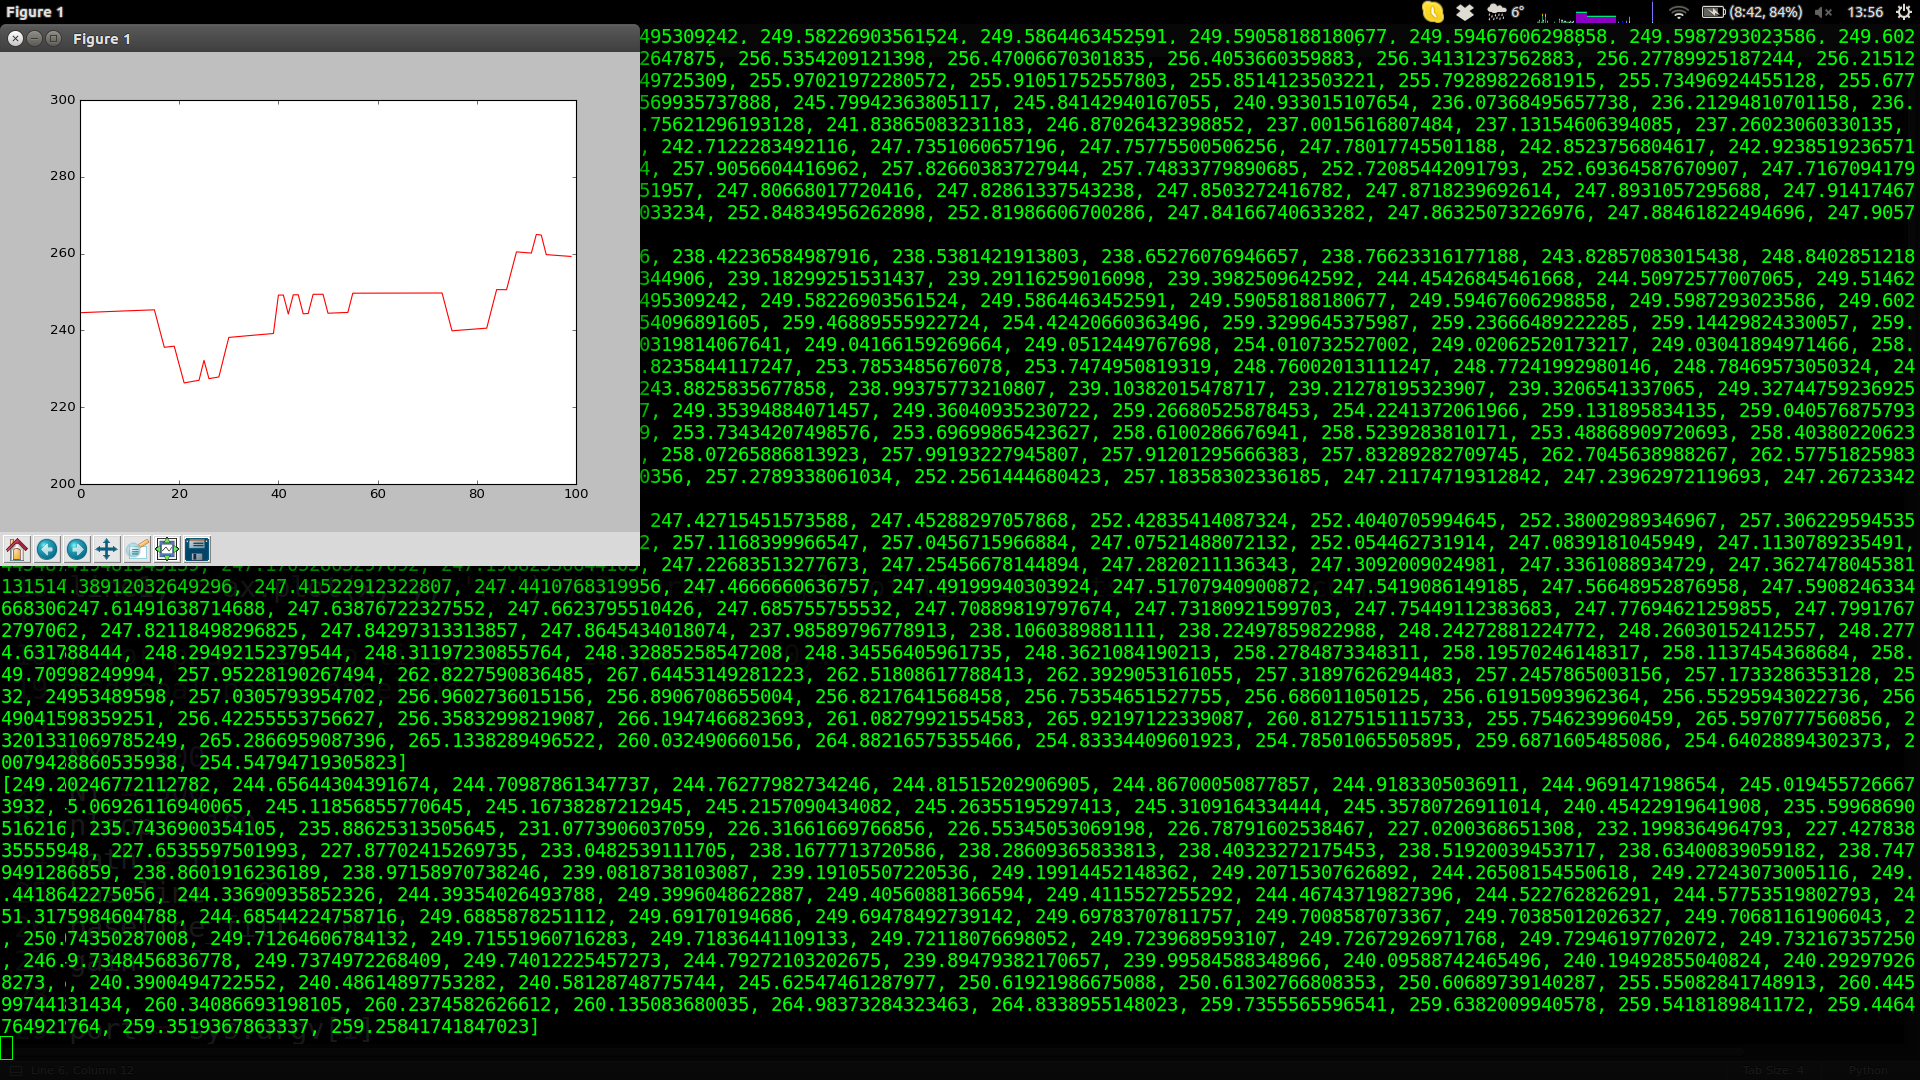
This week I made a python matplotlib plotter for the microphone circuit for my final project. The code can be downloaded here
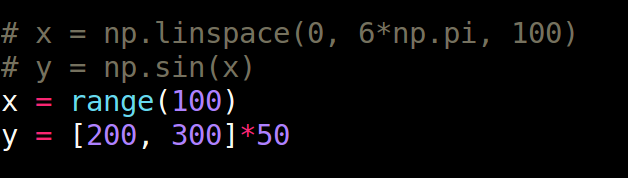
This code sets up the canvas with initial x and y values. The XY value range defines the final range of your plot so it's important to choose them wisely
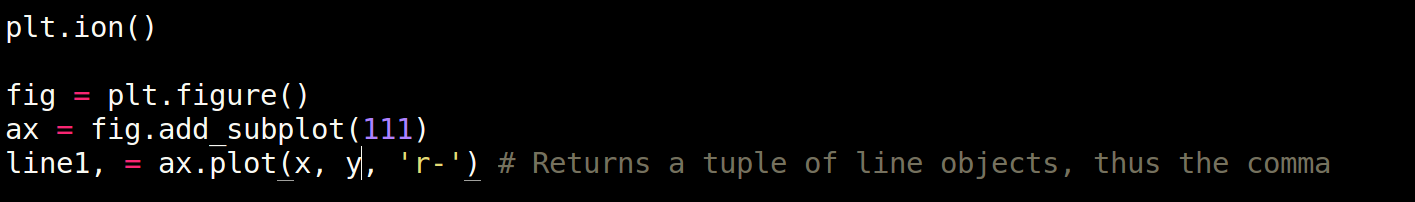
plt.ion() tells matplotlib to make the plot interactive. fix is the figure you're plotting, ax 111 makes it a 1 plot with no subplots and line1 is the line you'll be showing. matplotlib has weird syntax. ggplot2 is so much better at plotting in a human-readable sense
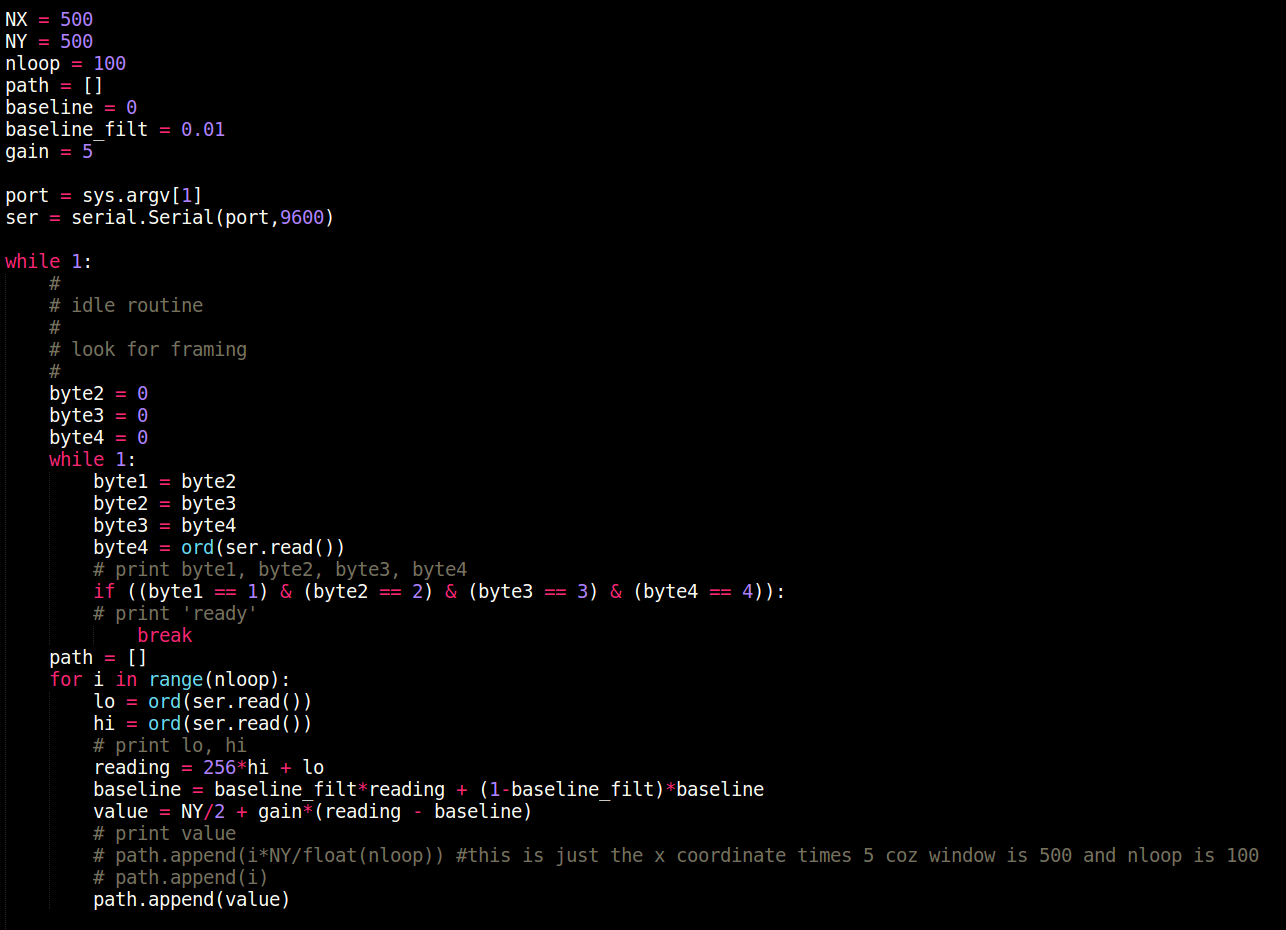
This is just Neil's microphone code from input device week I'm copying in
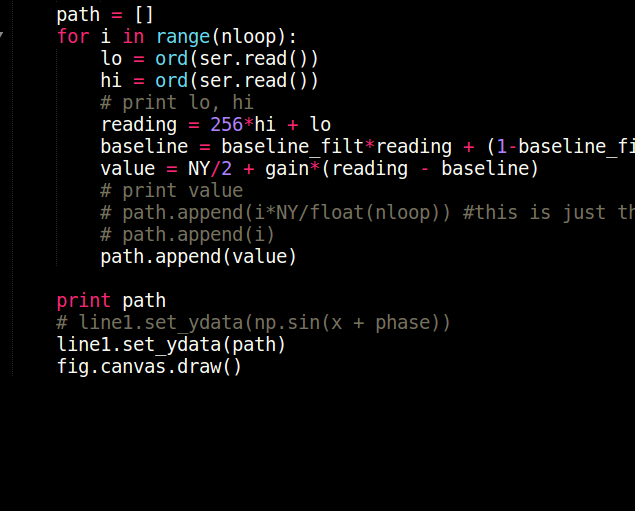
The last two lines is what does the magic. Path collects all the values from the usb serial, and set_ydata plots these values