Design
I initially wanted to create a piece of furniture that was also a data visualization.
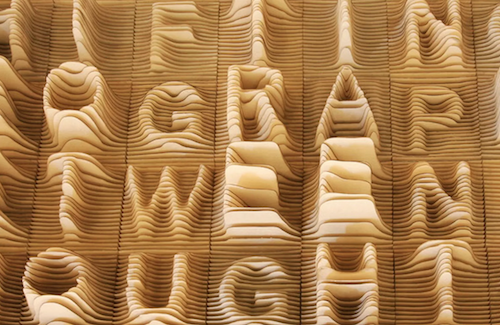
I was inspired by contemporary furniture design which used vertical slats to form a horizontal structure — they reminded me of line graphs and bar charts.

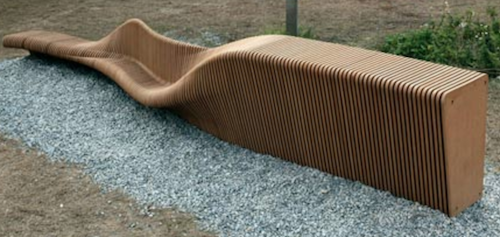
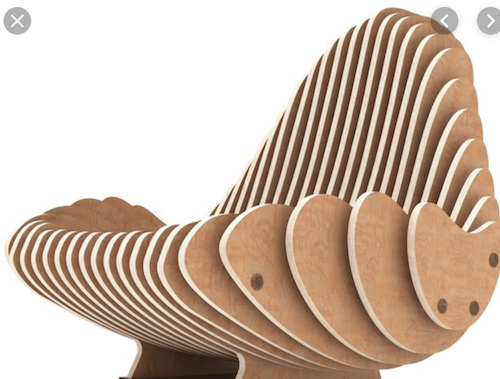
However, this was my first time creating something with these machines. Due to my limited fabrication experience, I decided to start with something less ambitious and try to make a 3D data sculpture. I was inspired by a few designs I saw online of 3D line graphs.

I looked at several sources of data. I was interested in finding data that had multiple dimensions — it needed to show high variation over time (so that the line would be distinctive and dramatic), and there needed to be multiple slices of it (years, demographics) so that I could create a structure with multiple layers.
I eventually settled on using data for California wildfires, since CA is my home state and these have been in the news a lot lately. Data on CA wildfires over time shows strong volatility but an overall increasing trend.
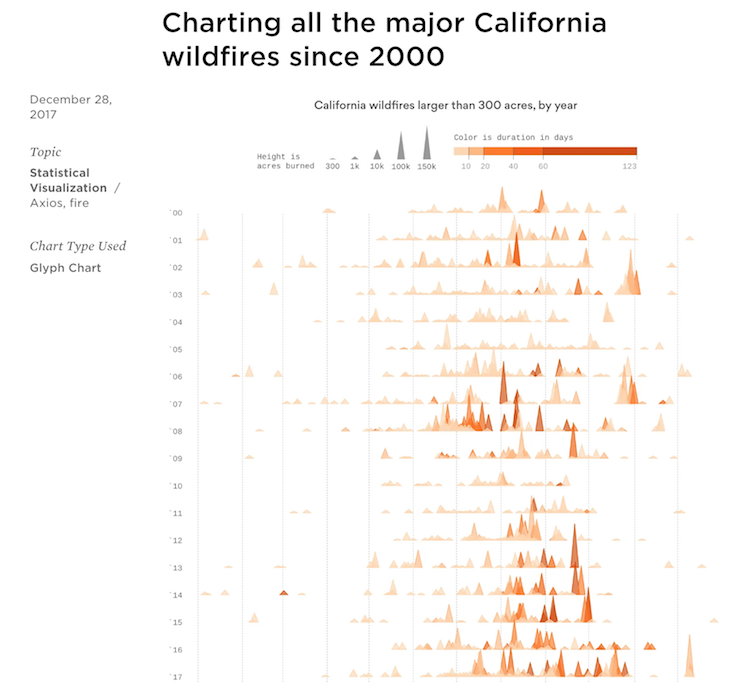
I created the design in illustrator.
