Laser Cutter
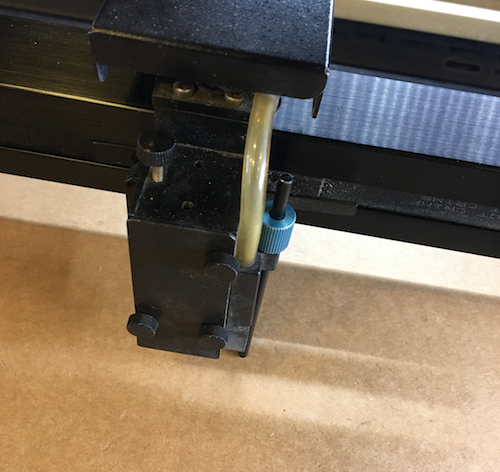
We learned how to focus the laser cutter using the focus tool.
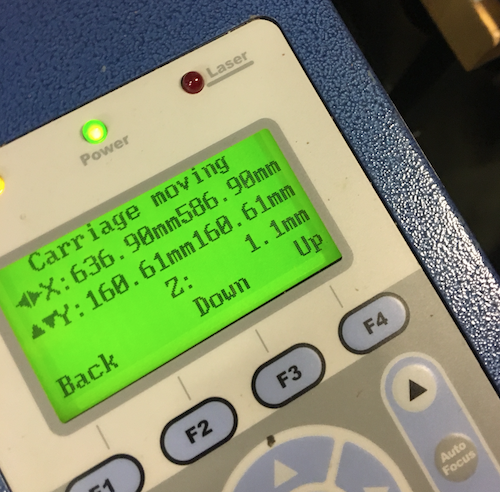
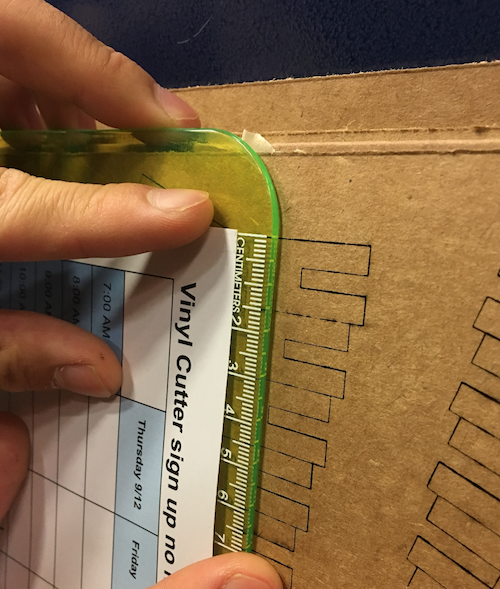
We found the optimal power (100), speed (2.5) and rate/PPI (200) for the laser cutter. We measured the kerf at 0.1mm and the joint clearance at 4.3mm for cardboard.
Press Fit
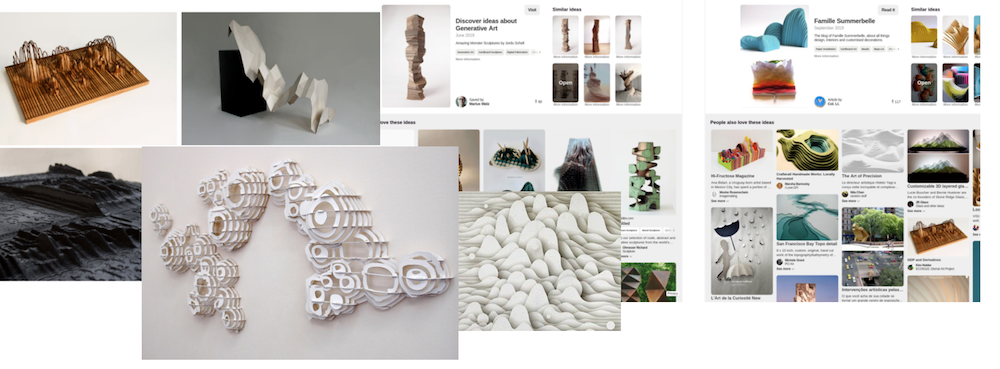
I wanted to create a press-fit data visualization. I was inspired by various physical data visualizations I saw online such as:
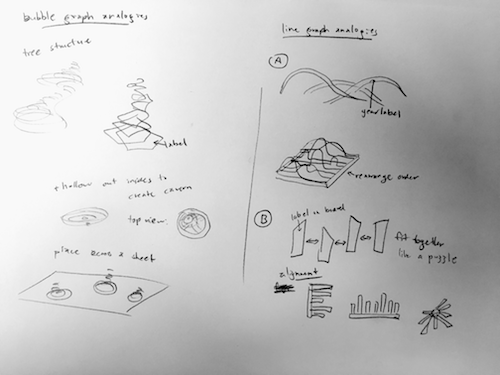
I first sketched a few ideas.
Then I did research and found a dataset.
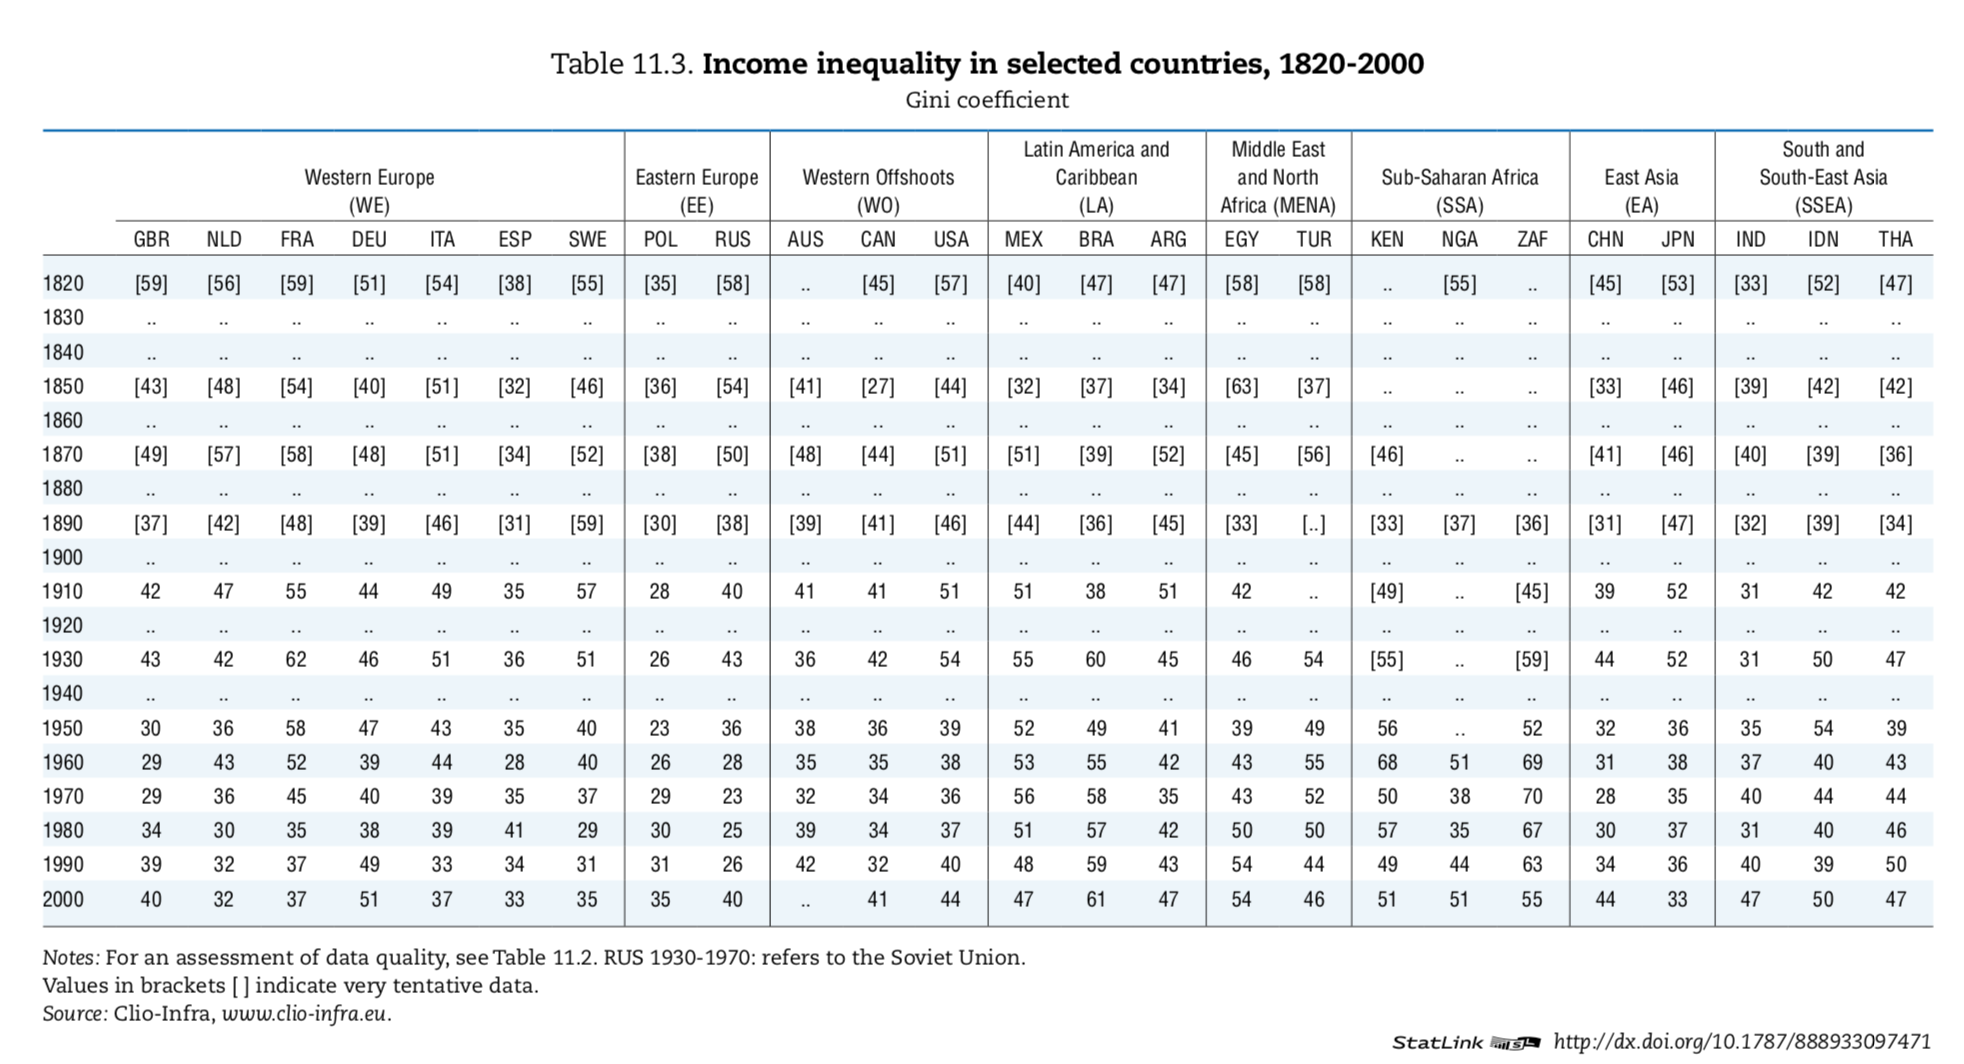
I first played around the data on income inequality but decided it wasn't a good fit for 3-D visualization because the trend was too linear.
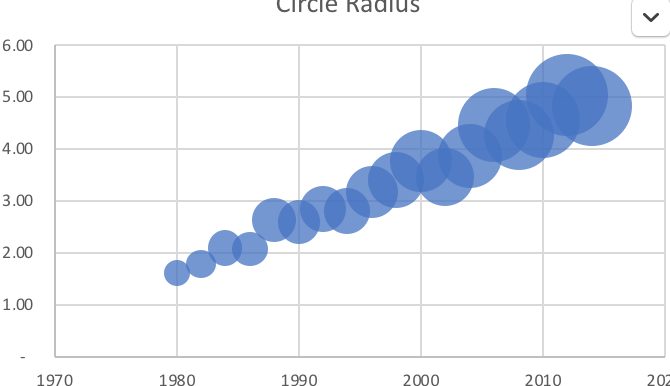
I decided to use Gini coefficients which varied by year and country, and showed greater ups and downs by year for US data. I created bubbles representing the Gini coefficient in the US per year for select years from 1820 to today.
I first attempted to model the data used FreeCad but the program crashed repeatedly before I was able to export my designs. I ended up doing the modeling in Javascript, which did allow me to still create parametric models that I could easily adjust via variables.
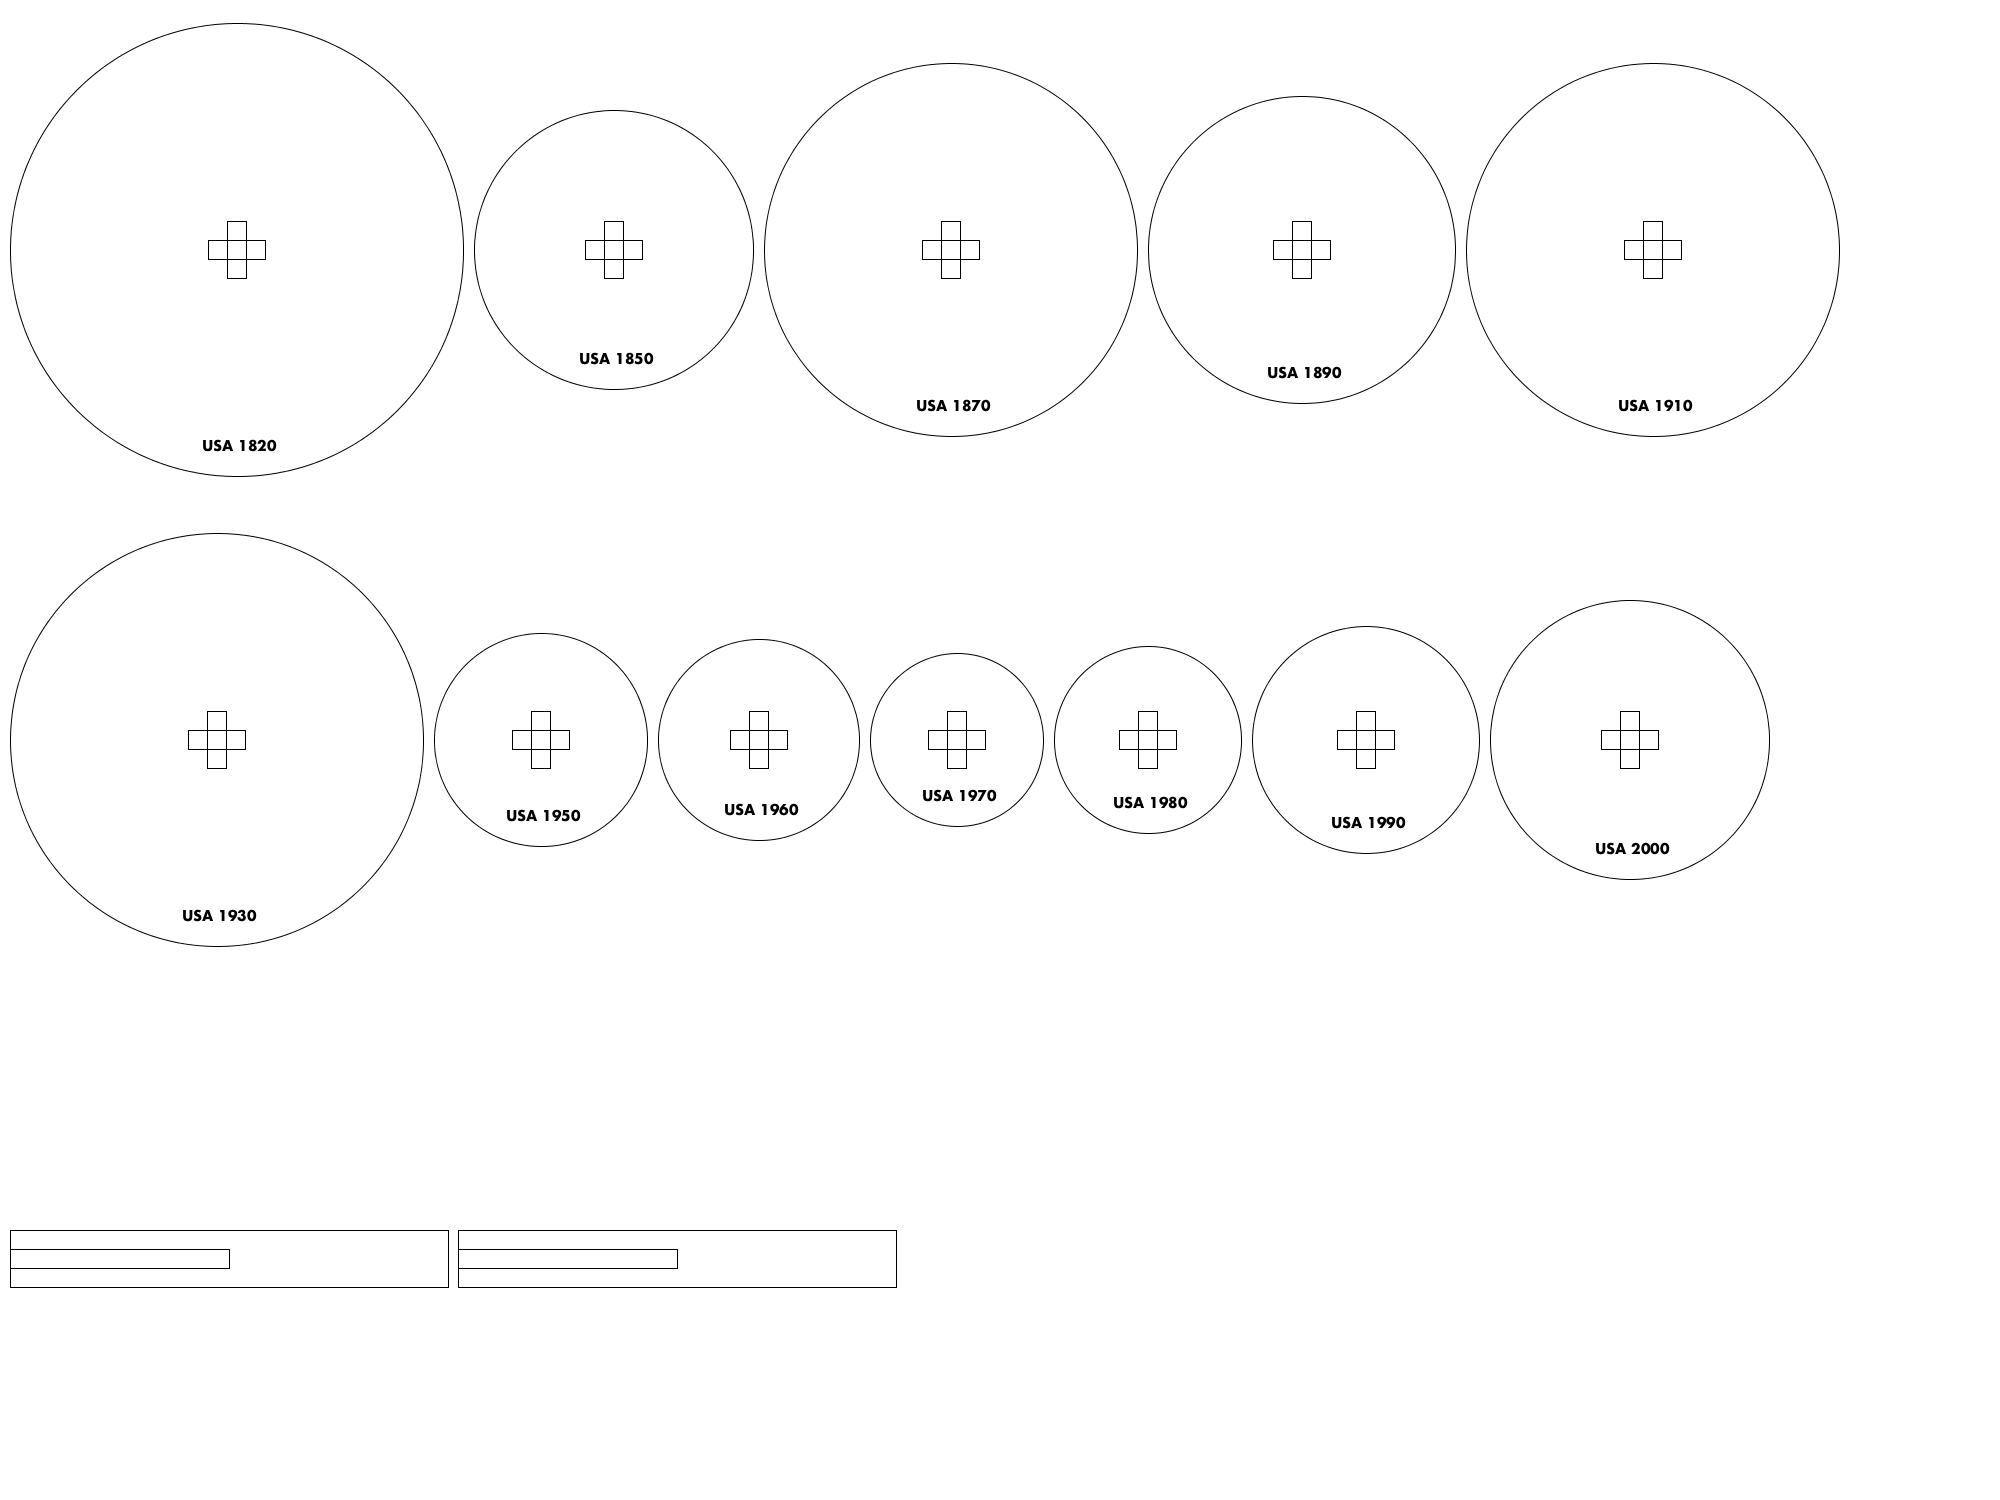
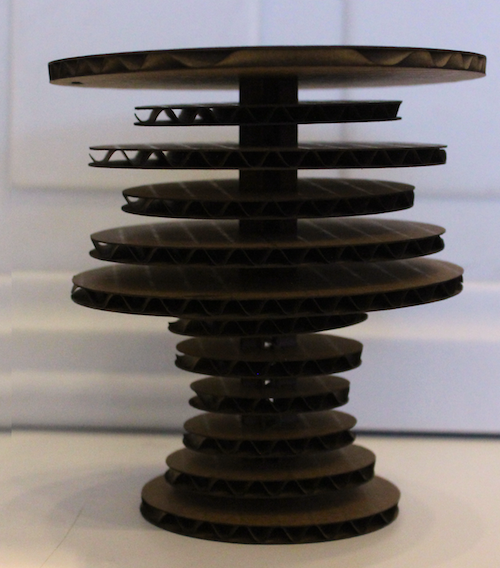
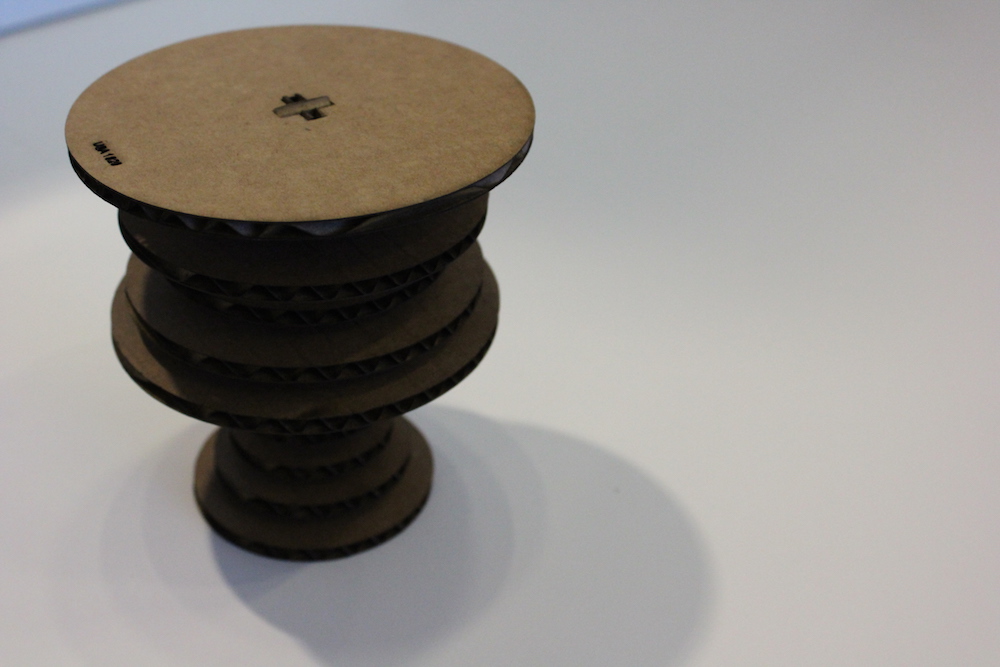
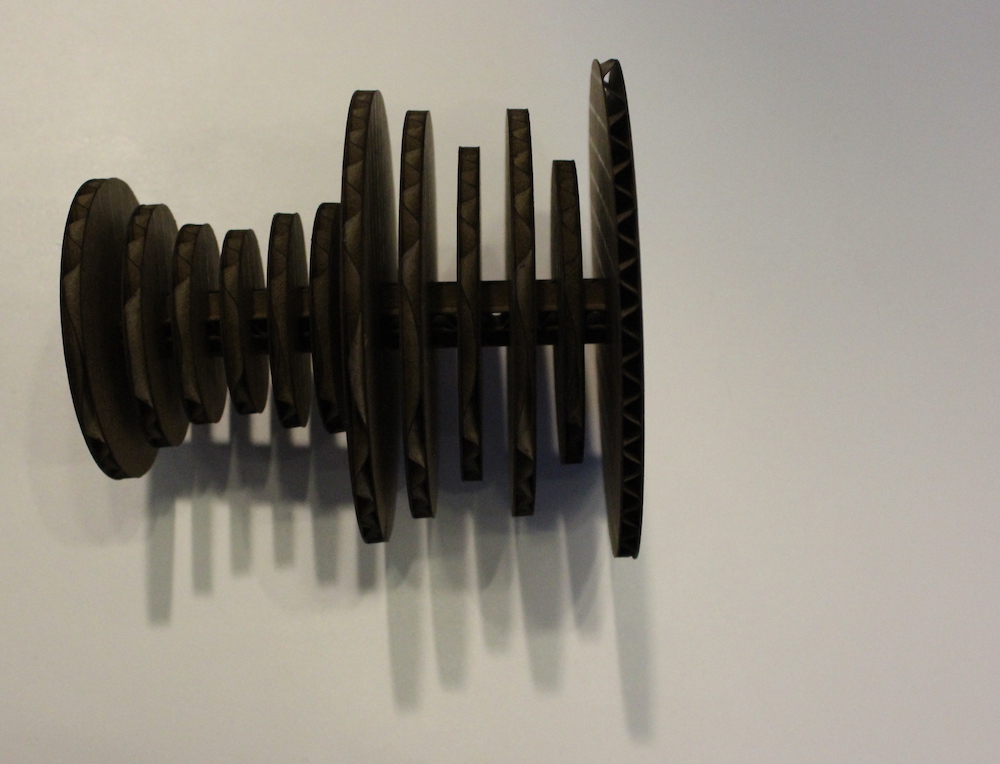
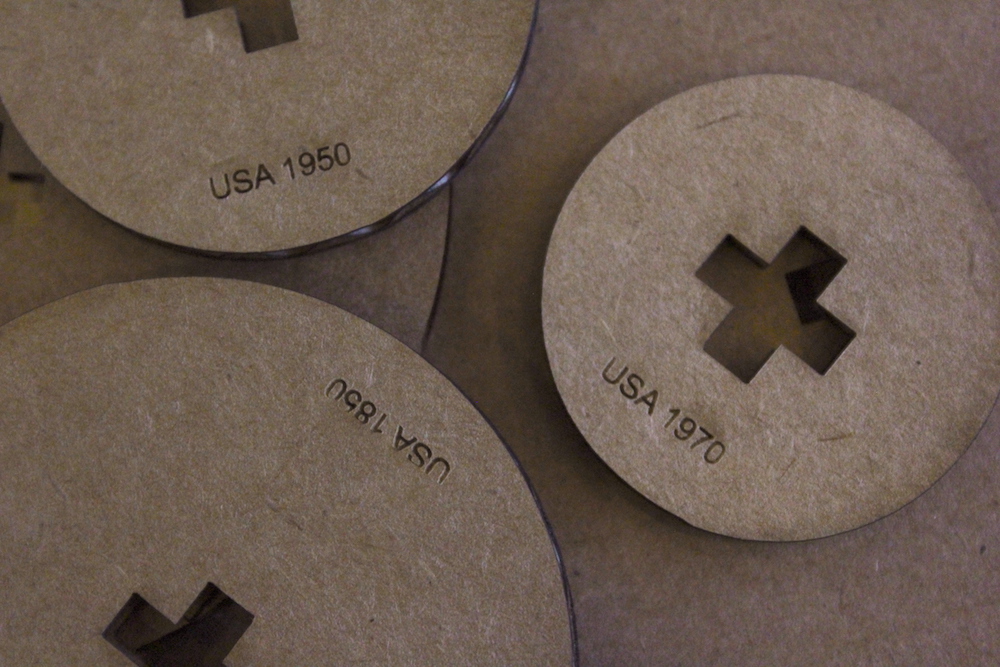
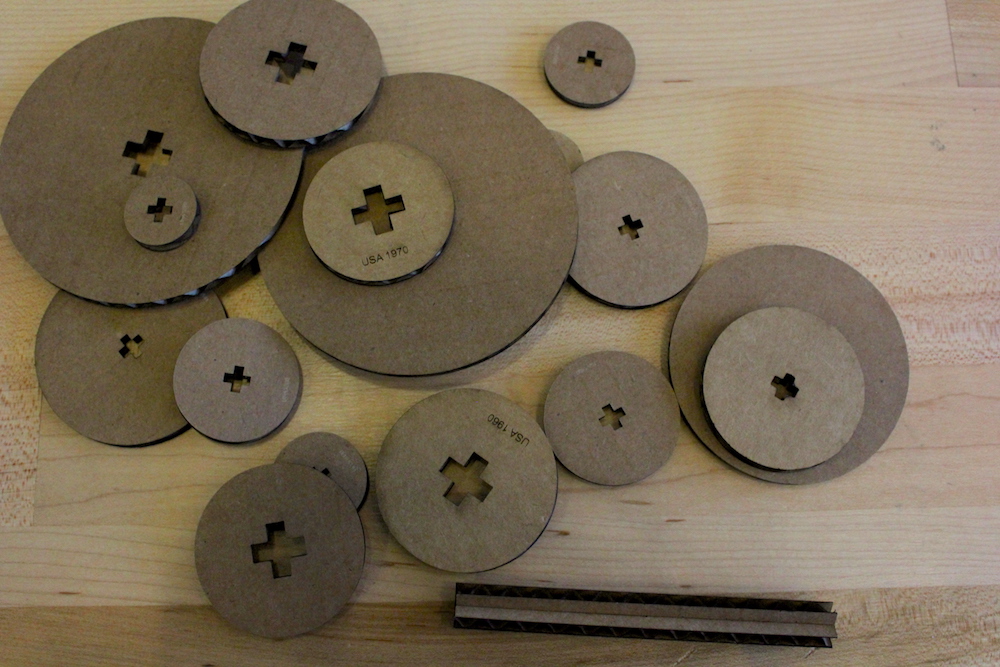
I assembled the final press-fit kit to be a 3-D visualization of the gini coefficient in the US over the last two centuries. Each round represents one year of data with its radius (relative sizes) and is labeled with the country and year.
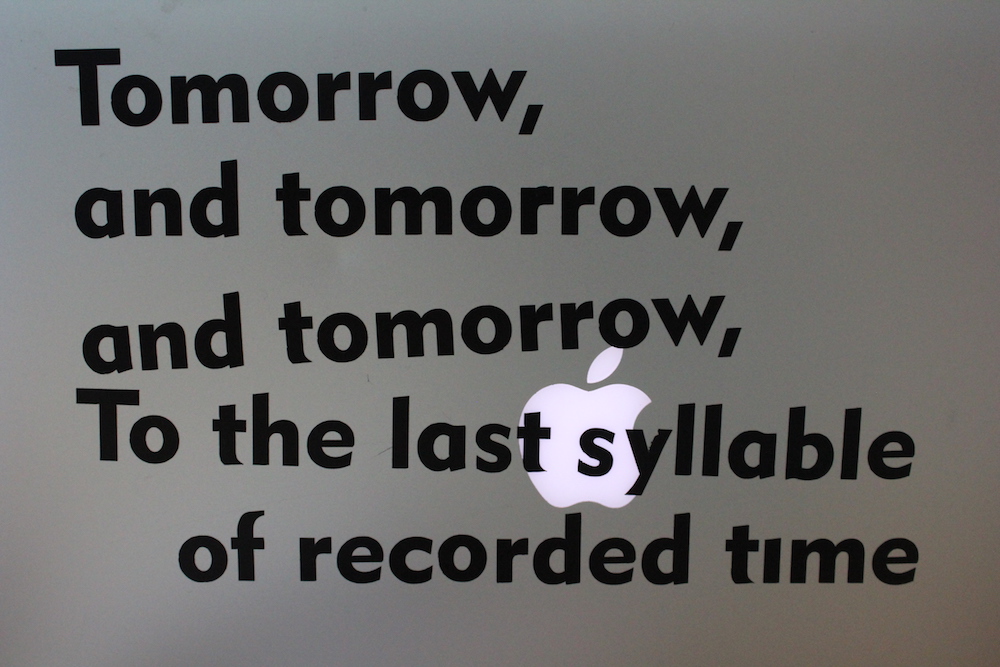
Vinyl Cut
I cut a Shakespeare quote out for my laptop!