Week 12: Interface and Application Programming
For this week's assignment I decided to polish an interface I worked on in the past for extracting audio features and visualizing them in real time.
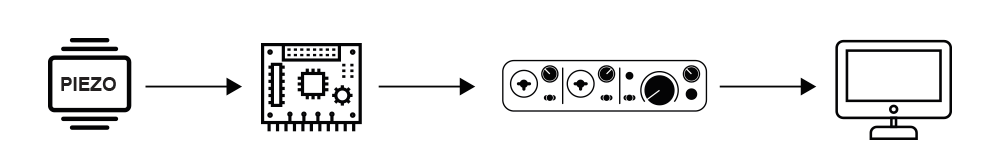
For this task I used the amplification circuit I built for my project and an audio interface for sampling audio at 44100Hz. As visualized in the diagram below, the piezo signal is conditioned by the analog circuit, sampled by the Roland audio interface and the signal is digitized by the MacOS as an audio input (via USB).
For visualizing the sound I wrote an application in OpenFrameworks. OF has a very handy callback function that allows real time sampling from the operating system audio buffer. In the callback function you can specificy the sampling speed and buffer size (example below.

The audio data is then passed from the operating system to openFrameworks based on the sampling rate specified. And the callback function audioIn() is called every time sound samples are available for processing.
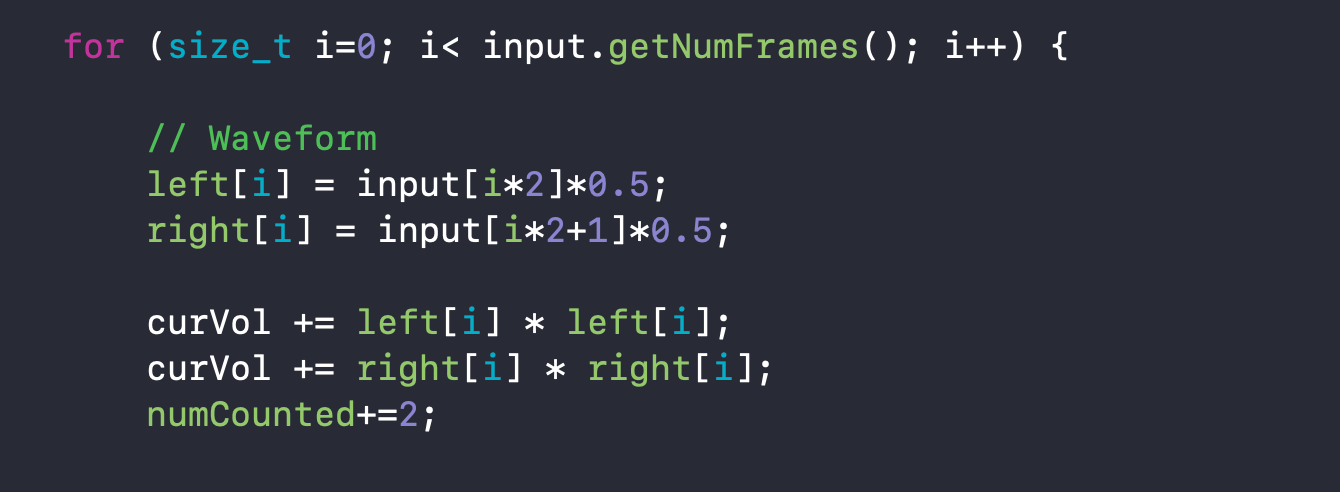
The LR audio samples are orgamized in a vector with a structure of RLRLRLRLRLRLRL so to get the Right channel we access the index i of the vector and for the Left channel i+1. For more channels the same structure applies so i+3 would access the R channel of the second input and so on.
Waveform
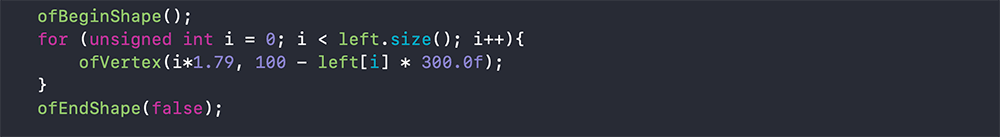
On the top left I am drawing the waveform with a line reacting to the sound in real time. To draw this line I use the function beginShape where I add points refering to the XY of the line and close the procedure with a closeShape.
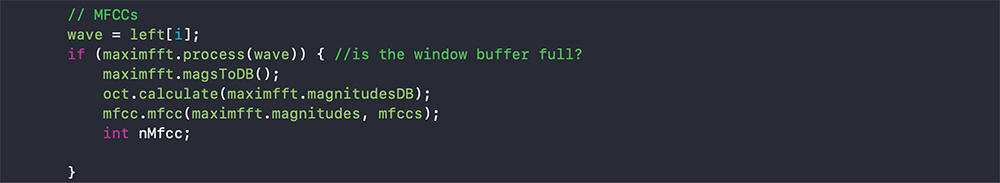
MFCC
For computing the mFCCs I use a library for audio called ofxMaxim that can compute 12 bins of MFCC coeficients in real time. These features are particulary useful for audio classification tasks as they refer to the sort term power spectrum of sound
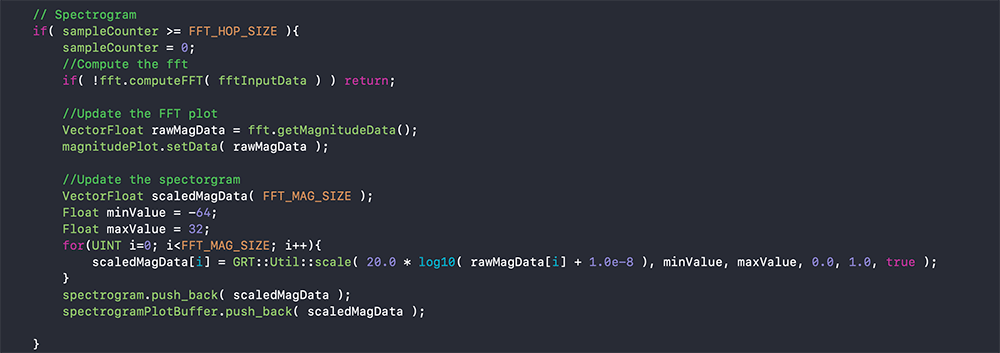
Spectrogram
To plot the spectrogram I experimented using the ofxGRT library that has a handy function for plotting a magnitude plot of a sound. I am scaling and resampling the data as new audio samples come into the buffer.
RMS
The RMS graph just shows the intensity of the sound and it's calculate by taking the root mean squared value of the sampled value as it comes in. Here I am using the ofxHistoryPlot addon to visualize the change of volume with the green line.
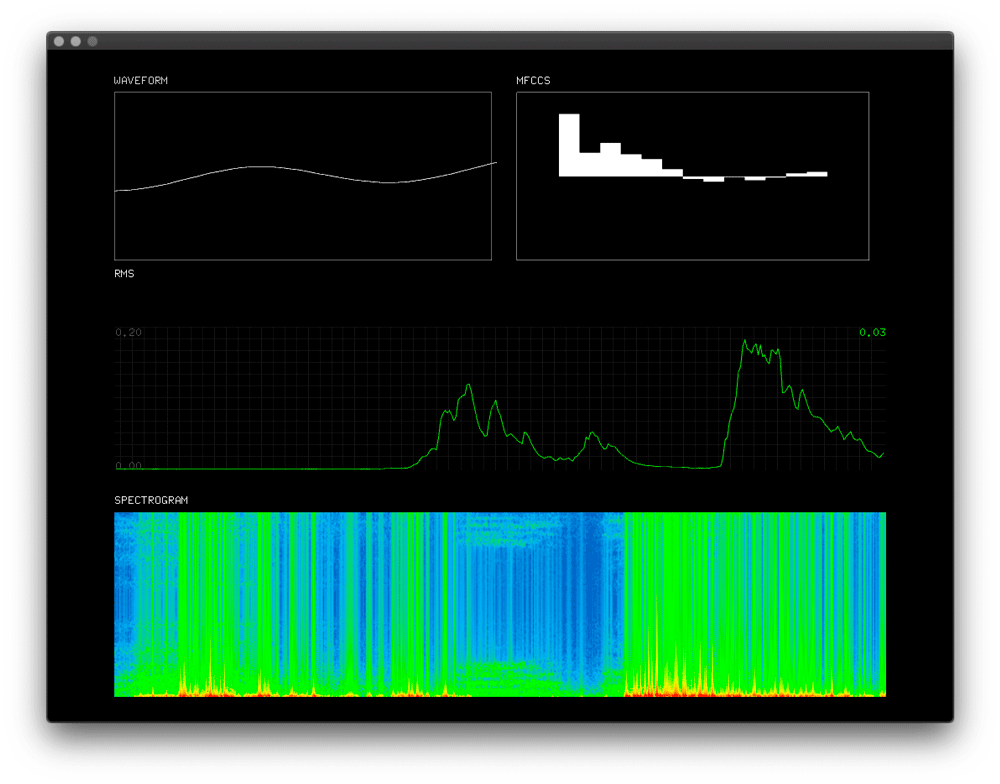
Final Result
Final result is a dashboard that displays the different audio features of sound captured by my piezoelectric sensor embedded in paper. I aim to use this to feed into classifier algorithm and detect sound with this algorithm.