
For week 1, the assignment was to plan and sketch a potential final project. I’d been playing around with an idea for a 3D visualization of weather forecast data, inspired by some grid-style weather visualizations. that I love + the opening ceremony of the 2008 Beijing Olympics, which I remember being very impressed by.
Here was my initial sketch. The X axis is the next twelve hours, and there are rows for three forecast variables: Temperature, humidity and wind speed. The height of the bar encodes the value, and an indicator light on top will turn red if the value is “extreme.”
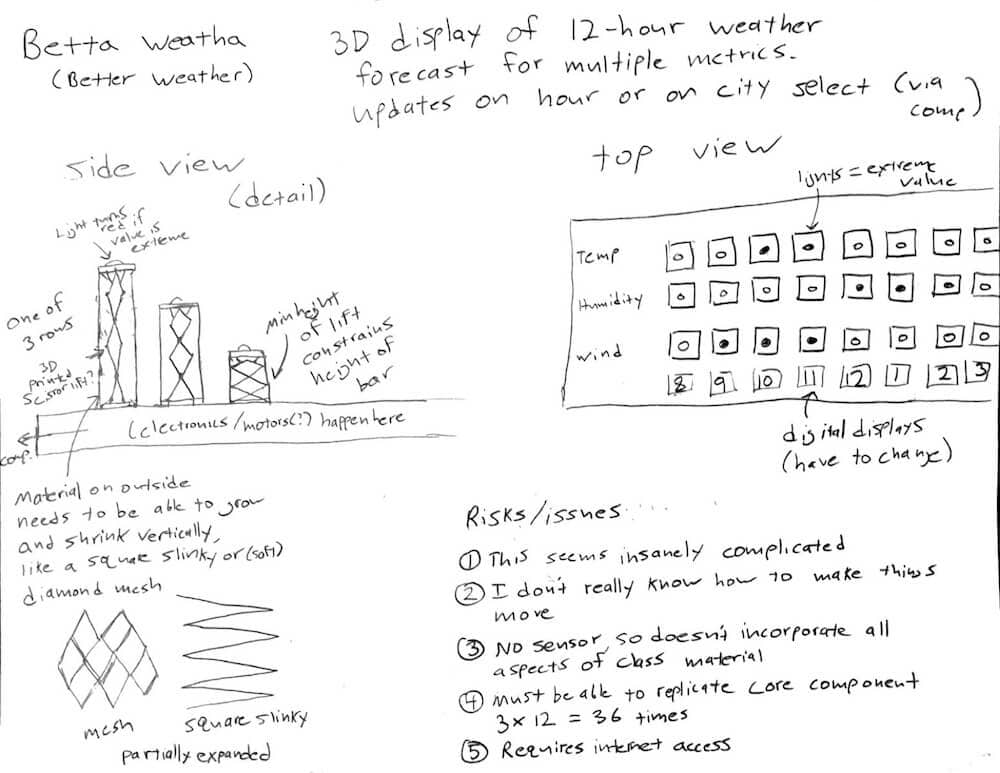
Users would be able to select their city from a computer interface. The bars would update/move on the hour and when a new city was selected.
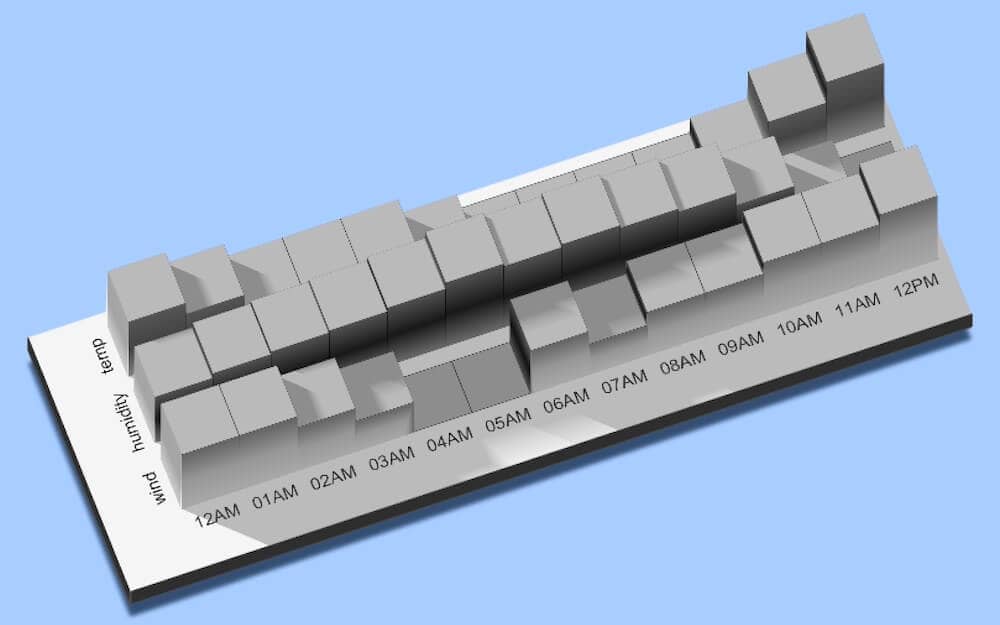
I’m terrible at drawing, and especially at drawing 3D. So I mocked up a 3D version of this visualization in R using the rayshader package and ggplot.
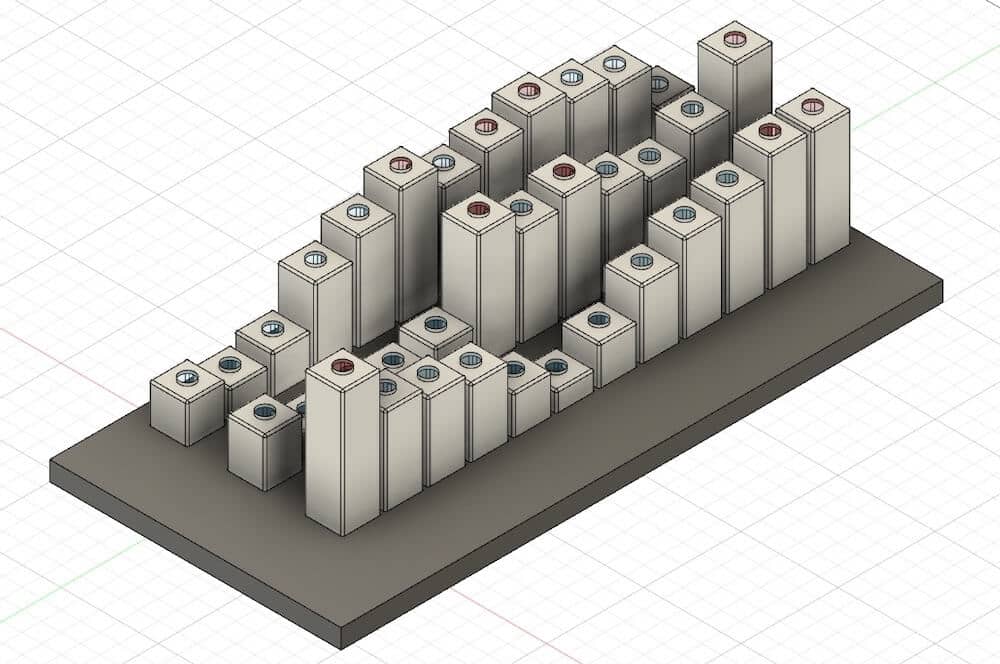
I also tried to tackle it in Autodesk Fusion 360, which let me add features like the indicator lights on top. Boy was I not prepared for that. I got something I was sorta happy with by just brute force creating solids and copying them. But I didn’t once open up the sketch tool or set any constraints. Not good!
There are three biggish issues with this project:
So I bet I’ll end up doing something else. But thanks for reading.
Files: Here’s the data and R code I used to generate the rayshader chart. I refuse to link the Autofusion 360 file because I did a horrible job.