29. November 2022
Interface Programming
This week’s assignment was to write an application that interfaces a user with an input or output device.
Program
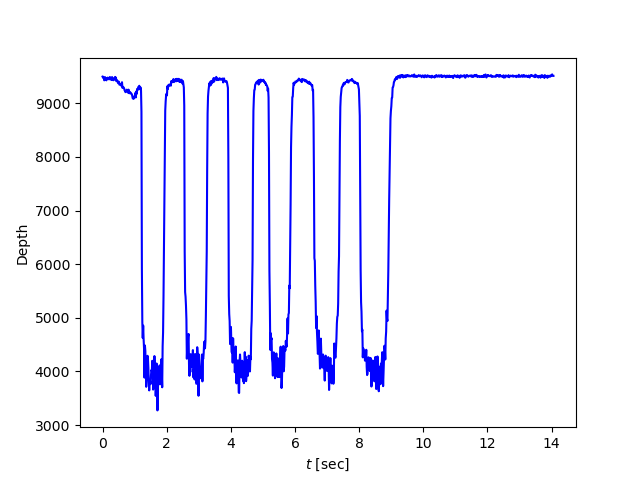
Using my capacitive touch sensor, I wrote a Python script that converts the serial measurements into a nice graph.
 1import serial
 2import numpy as np
 3import matplotlib.pyplot as plt
 4
 5def still(L, thresh, dur):
 6    steps = int((dur / dt) + 1)
 7    tot = len(L)
 8    if len(L) < steps + 1:
 9        return True
10    eval = np.sum(np.abs(np.subtract(L[tot-steps:tot], L[tot-steps-1:tot-1])) < thresh)
11    print(eval)
12    print(L[tot-steps:tot])
13    print(L[tot-steps-1:tot-1])
14    print(np.subtract(L[tot-steps:tot], L[tot-steps-1:tot-1]))
15    print(np.subtract(L[tot-steps:tot], L[tot-steps-1:tot-1]) < thresh)
16    if np.sum(np.abs(np.subtract(L[tot-steps:tot], L[tot-steps-1:tot-1])) > thresh) != 0:
17        return True
18    else:
19        return False
20
21if __name__ == "__main__":
22    dt = 13.458914995193481/1000 #calibration
23
24    lauren_port = "/dev/cu.usbmodem4223FB3D1"
25    lauren_baudrate = 9600
26    arduino = serial.Serial(port = lauren_port, baudrate = lauren_baudrate, timeout = 0.1)
27
28    timeseries = []
29    import time
30    start = time.time()
31    plateau = 5 #secs
32    threshold = 100
33    print('sensor running')
34    while still(timeseries, threshold, plateau):
35        data = arduino.readline().decode('utf-8').rstrip().split(" ")
36        timeseries.append(int(data[0]))
37        print(still(timeseries, threshold, plateau))
38        elapsed = time.time() - start
39
40    plt.plot(np.linspace(0, elapsed, len(timeseries)), timeseries, color='blue')
41    plt.xlabel(r'$t$ [sec]')
42    plt.ylabel('Depth')
43    plt.show()
The code detects when the sensor has been idle for 5 seconds. Then, it returns a graph of the touch depth.