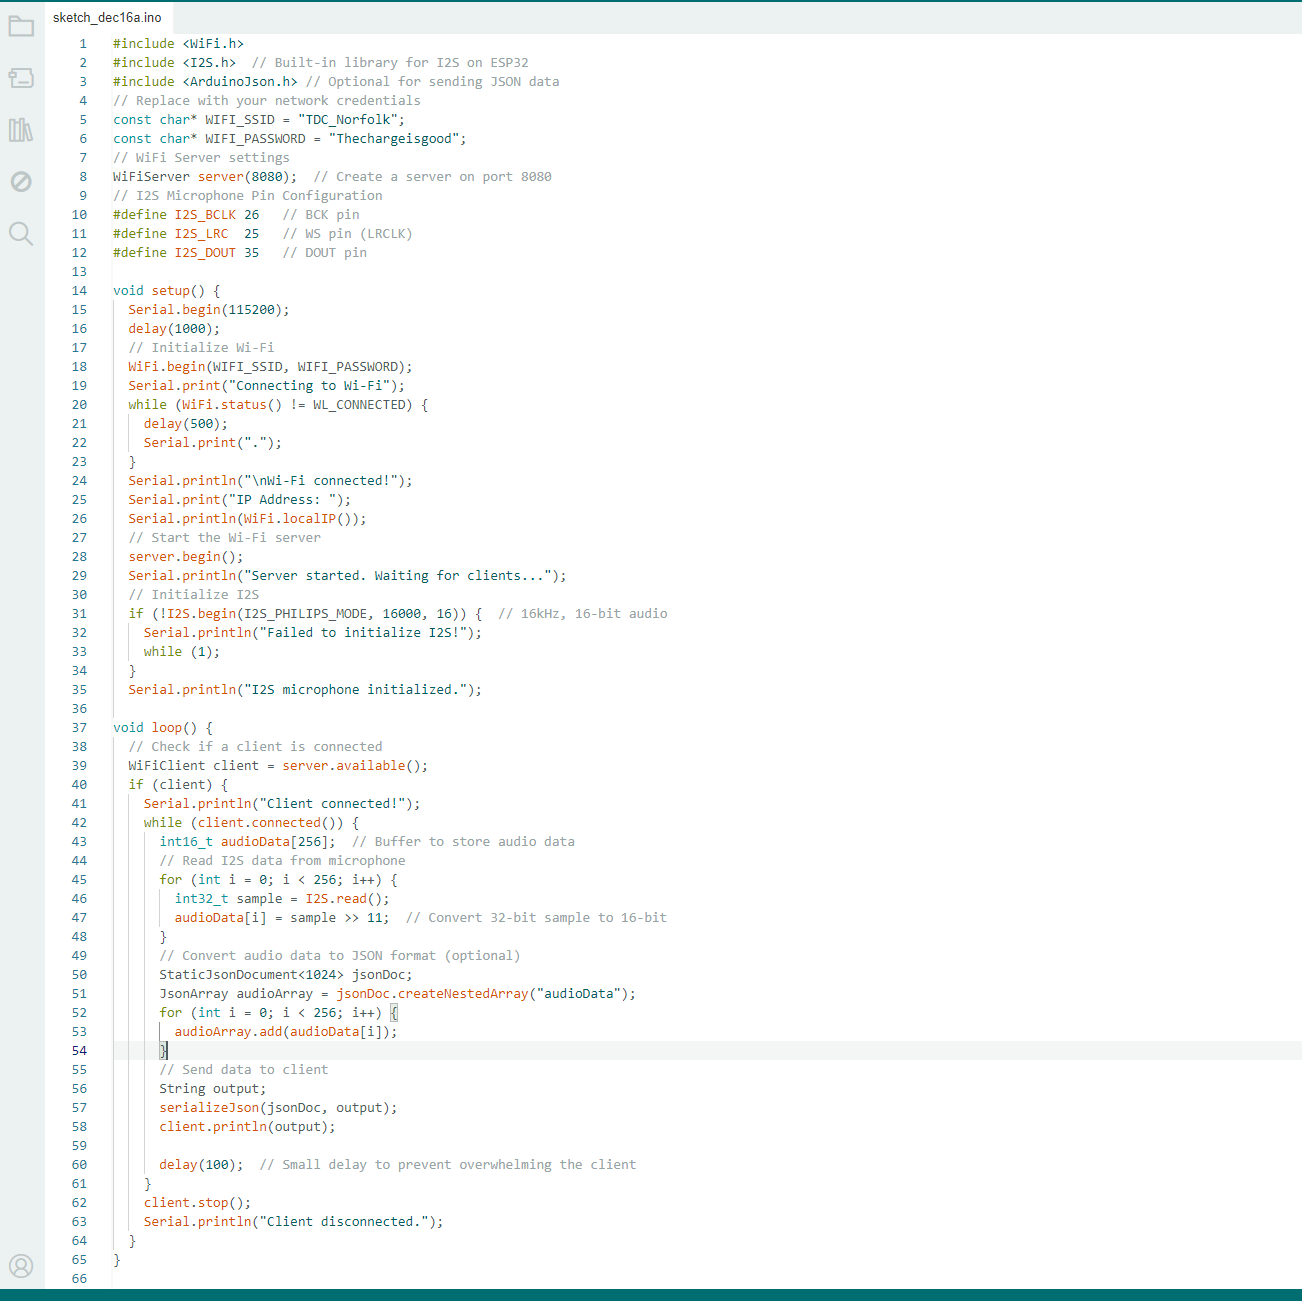
To connect the board to Wi-Fi, I used the WiFi.h library. In my code, I specified the Wi-Fi credentials (SSID and password), ensuring the board could connect to my network. The next step was to set up the I2S microphone. The Adafruit MEMS microphone uses the I2S protocol to send audio data, so I configured the I2S interface on the Xiao Sense S3 using the I2S.h library. I defined the necessary pins for the Bit Clock (BCLK), Word Select (LRCLK), and Data (DATA) pins and initialized the microphone to start collecting samples. I set the sampling rate to 44.1 kHz and specified that the data would be collected in 24-bit resolution. Once these parameters were set, I was ready to send the data over Wi-Fi to my computer.
Once the Xiao Sense S3 was connected to Wi-Fi and the I2S microphone was set up, I moved to the coding phase. I wrote an Arduino sketch that initialized the Wi-Fi connection using WiFi.begin() with the appropriate credentials, and then I checked the connection with WiFi.status() to ensure it was successfully established. After the Wi-Fi connection was stable, I set up a simple UDP or TCP client to send the data to my computer. Using the WiFiUDP library, I configured the IP address and port of the computer where I would be receiving the data. In the main loop of the code, I used the I2S.read() function to capture audio samples from the microphone and store them in an array. These samples were then sent over the network using udp.beginPacket() or a similar method. I also included some error-checking routines to ensure that if any data was lost or the connection was interrupted, it could be handled gracefully. The data was sent continuously in small packets, ensuring a constant stream of information. Once the data was being transmitted successfully over the network, I uploaded the code to the Xiao Sense S3 and verified that it was working as expected by checking the serial monitor for any debug messages and confirming that the Wi-Fi connection was established.

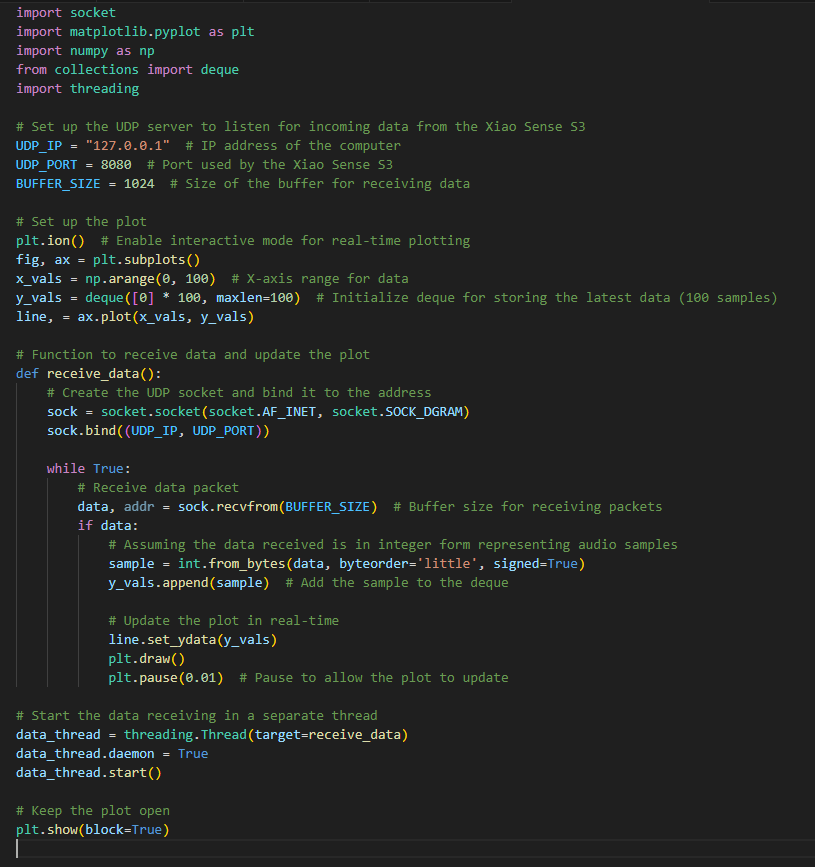
With the data being sent from the Xiao Sense S3 to my computer, I wrote a Python script to visualize the received data. The Python script used the socket library to listen for incoming data packets from the board. I set up a simple UDP or TCP server on the Python side that matched the port and IP address used by the Xiao Sense S3. When the data packets were received, the script stored the samples and began plotting them in real-time using the matplotlib library. The script continuously updated the plot by adding new data points every time a packet was received. I used a real-time plotting method to create an animated graph, allowing me to visualize the audio waveform as the data streamed in. To ensure smooth visualization, I set a buffer size and added some smoothing techniques to the data. I also implemented a refresh rate for the plot to update at a reasonable interval without overwhelming the system with too much data at once. Once the code was running, I was able to observe the real-time display of the microphone’s output, and it provided a clear representation of the sound data captured by the I2S microphone.
