Week 3
Embedded Programming
first step was to look through the datasheet for the microprocessor I wanted to use. I chose to use an esp32-c3 because I've used esp32s before and it seemed to be a pretty small but powerful chip. I looked at the pinout and the clock speed and both seemed good.
I took 6.08 my freshman year which is intro to eecs through embedded programming so I came into this week with some background knowledge. I came up with the idea of making something that would visualize sound somehow. My first idea was to make a circle that got bigger as sound increased and smaller as volume decreased. side note: If you love to hear people whistling, you came to the right place.
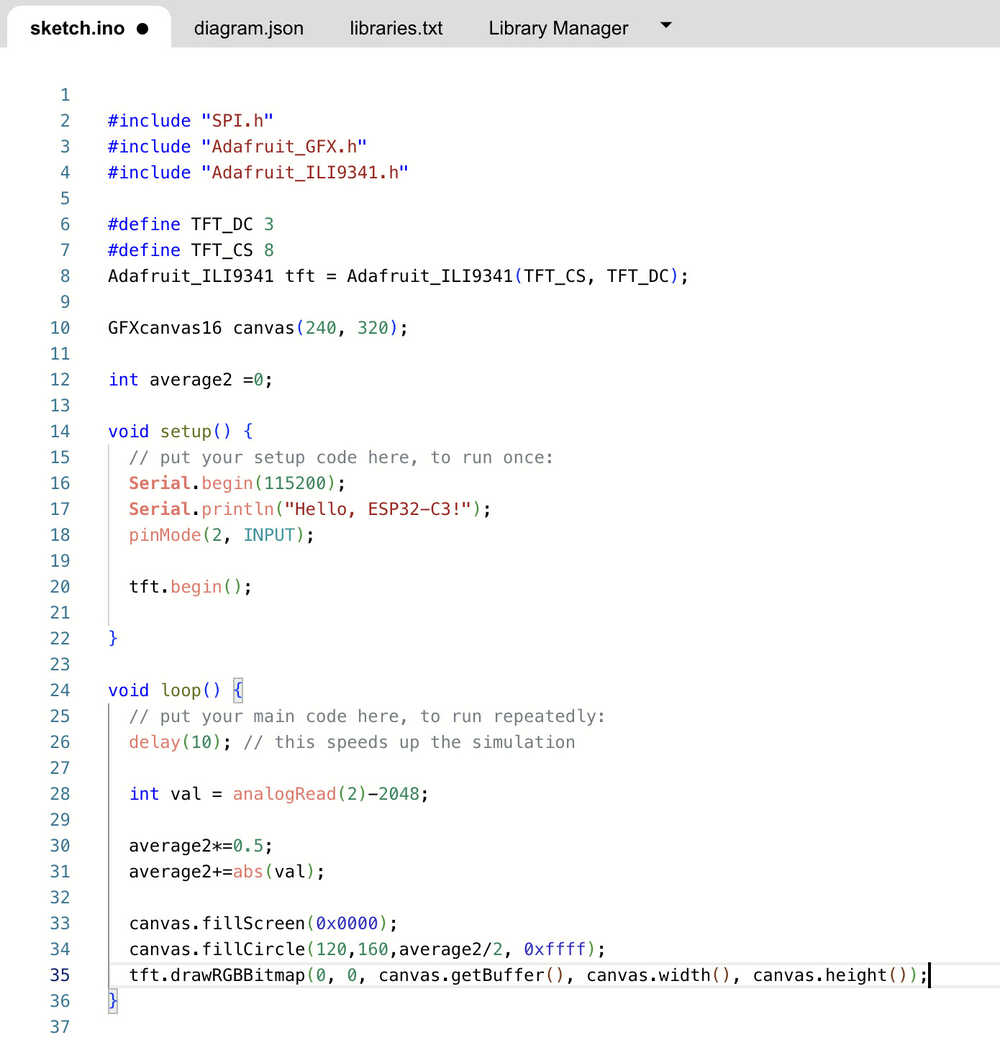
my initial attempt at a embedded programming project to visualize sound
I thought this was cool but wanted to make something a little more complex that depended on the frequency of sound. I'd heard of fourier transforms before and wanted to try out using a FFT (fast fourier transform) to calculate the main frequencies. I ran into an issue though because the frequency of the measurements was too slow to get meaningful information about frequency. This was especially compounded by the slowness of the simulation. just calculating the fft of a length 100 vector was taking 5 seconds which seemed ridiculously slow for this. I tried length 10 but even that was taking 50ms in the simulation which means the sampling is too spread out to be reasonable. I'm hoping to try this out on physical hardware to see if I can get rid of some of the latency and actually capture frequency.
ok, turns out some of the latency was because implemented a fourier transform yourself can be slow. So I found out that esp has a built in fourier transform library called ESP-DSP. I started with the library's example for a fft. Tbh, it was pretty confusing to understand. I played around with it some and modified it to fit my use case. I printed out the peak frequency and managed to get it about the same as the output of a tuner app on my phone. I then wrote some code to convert this frequency into a lettered note and its octave. So what I had at the moment is basically a music tuner. After getting the fourier transform working somewhat on the simulation I moved to hardware. I set up an ESP32 C3 connected to a microphone from the EECS Lab. It took a little messing around to get my arduino IDE to connect to my board but I added the esp board library and selected ESP32-C3 dev module board. I also had to press the boot button on the device to get it to start working.
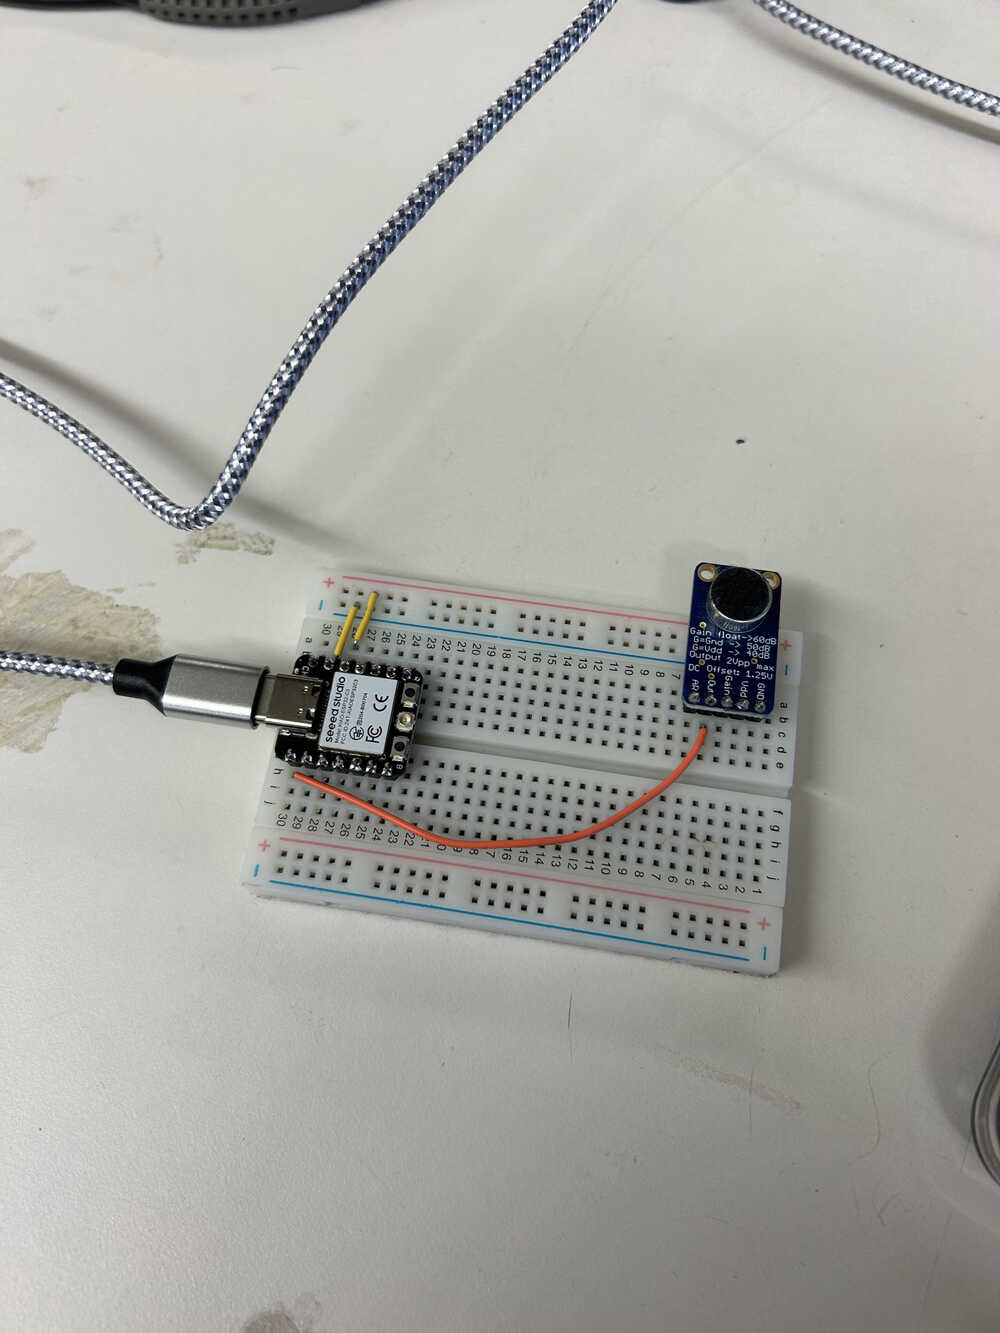
Next goal is to hook it up to a tft display and make something that moves along with music.
I started by testing out my graphics in the simulation. My plan was to have a sort of bar graph for each musical note A, A#, B, etc. This required summing over frequencies of each note. I managed to get something that looked reasonable in the simulation albeit there was enough latency (especially with the additionof the tft) that it wasn't super meaningful.
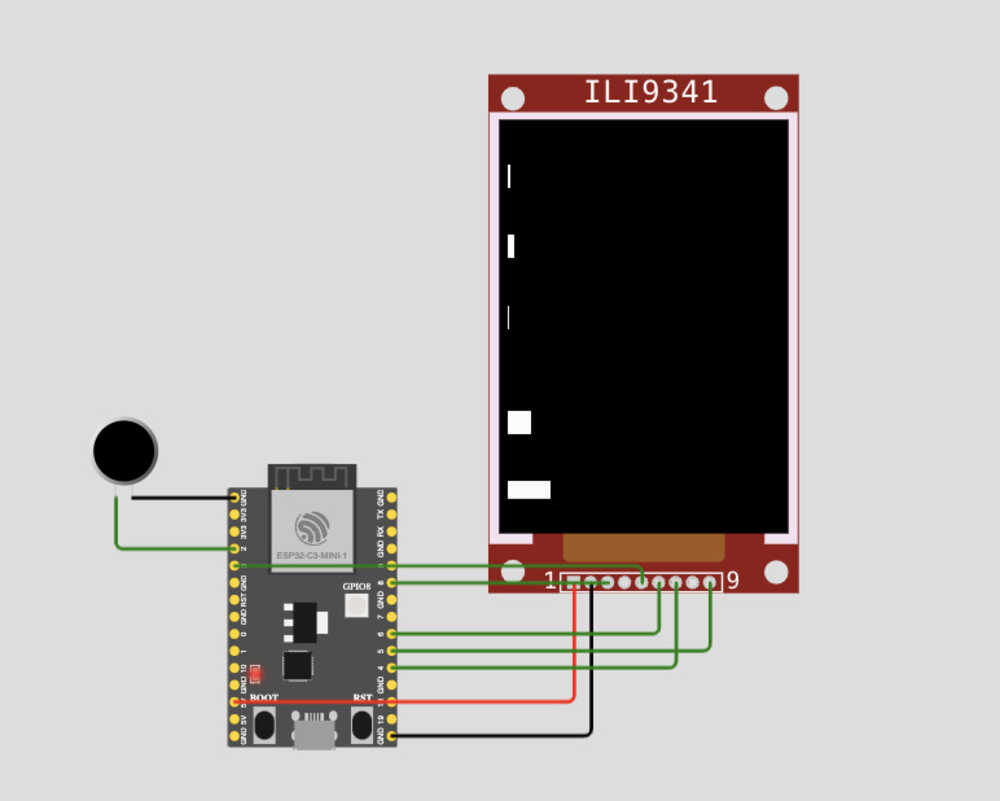
simulated version of visualization graphics
Setting up the physical tft was a lot more work than expected. I thought it would be easy because I had used the same tft in 6.08 but I was very wrong. First I had to figure out how to wire it to the esp32-c3. then I tried using the same TFT_eSPI library we used in 6.08 as a driver for the tft. I updated the settings with the correct pins but for some reason, this was not working. I found a youtube video where someone had similarly connected the same type of tft to the same esp32 c3 and I tried to follow along with that, but that was also unsuccessful. So I found a library made by adafruit to interact with the board and I figured I'd try that out. I managed to get color to show up but it looked really funky at first.
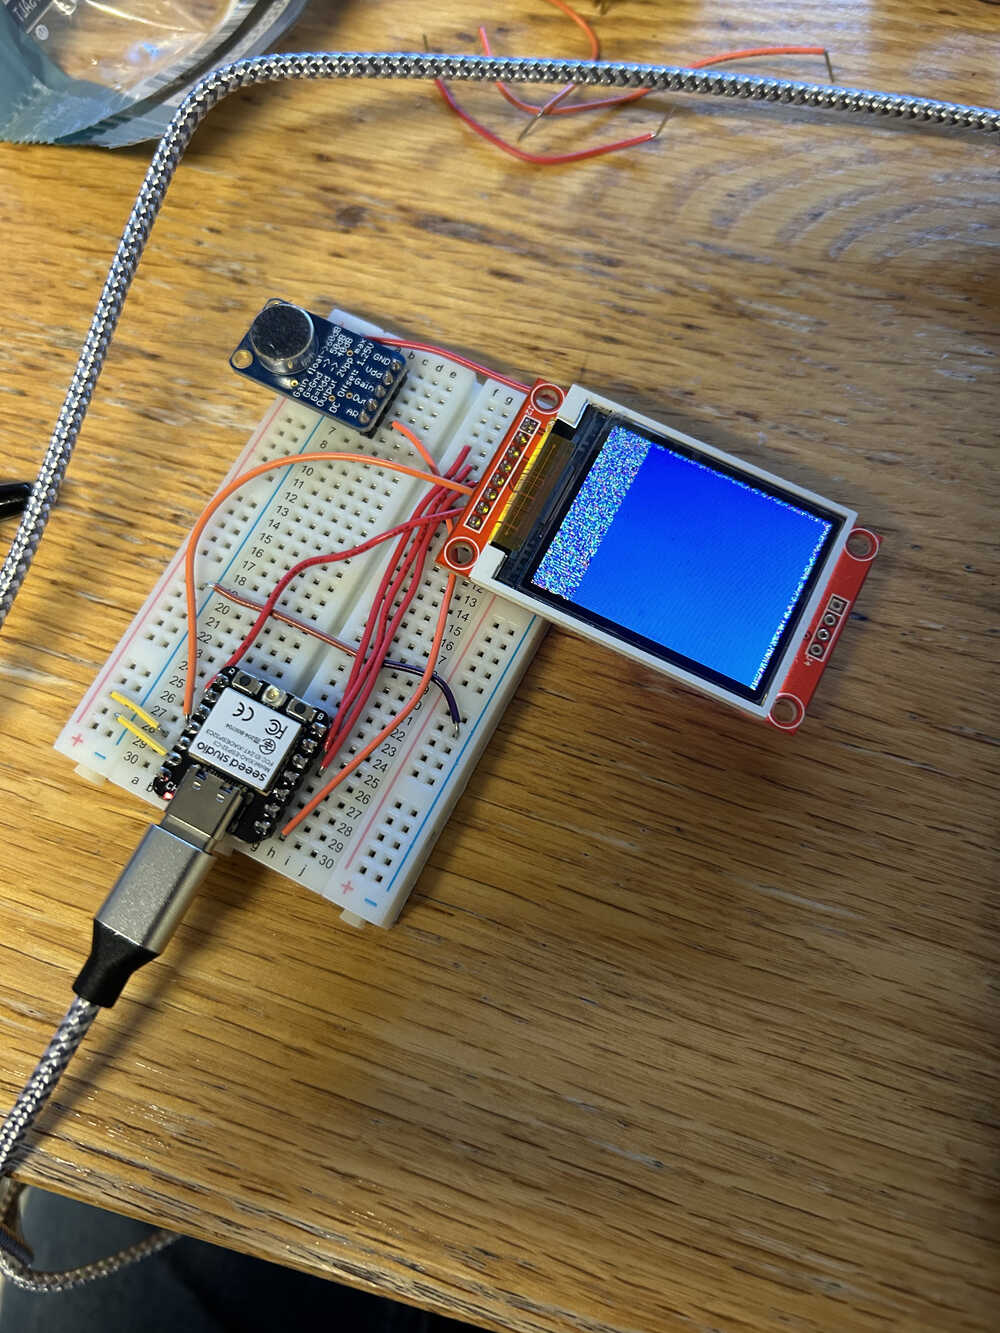
the ugliness I experienced at first
It seemed to have something to do with the subtype of display R or B and the tab type. This might have also been what was wrong with TFT_eSPI but I decided to stick with Adafruit once it was working. I used the music note code I had written for simulation and it was working pretty well. I did some calculations to minimize redrawing since the screen updates were really slow. with the changes I got it working quite nicely. I also added colors for funsies.
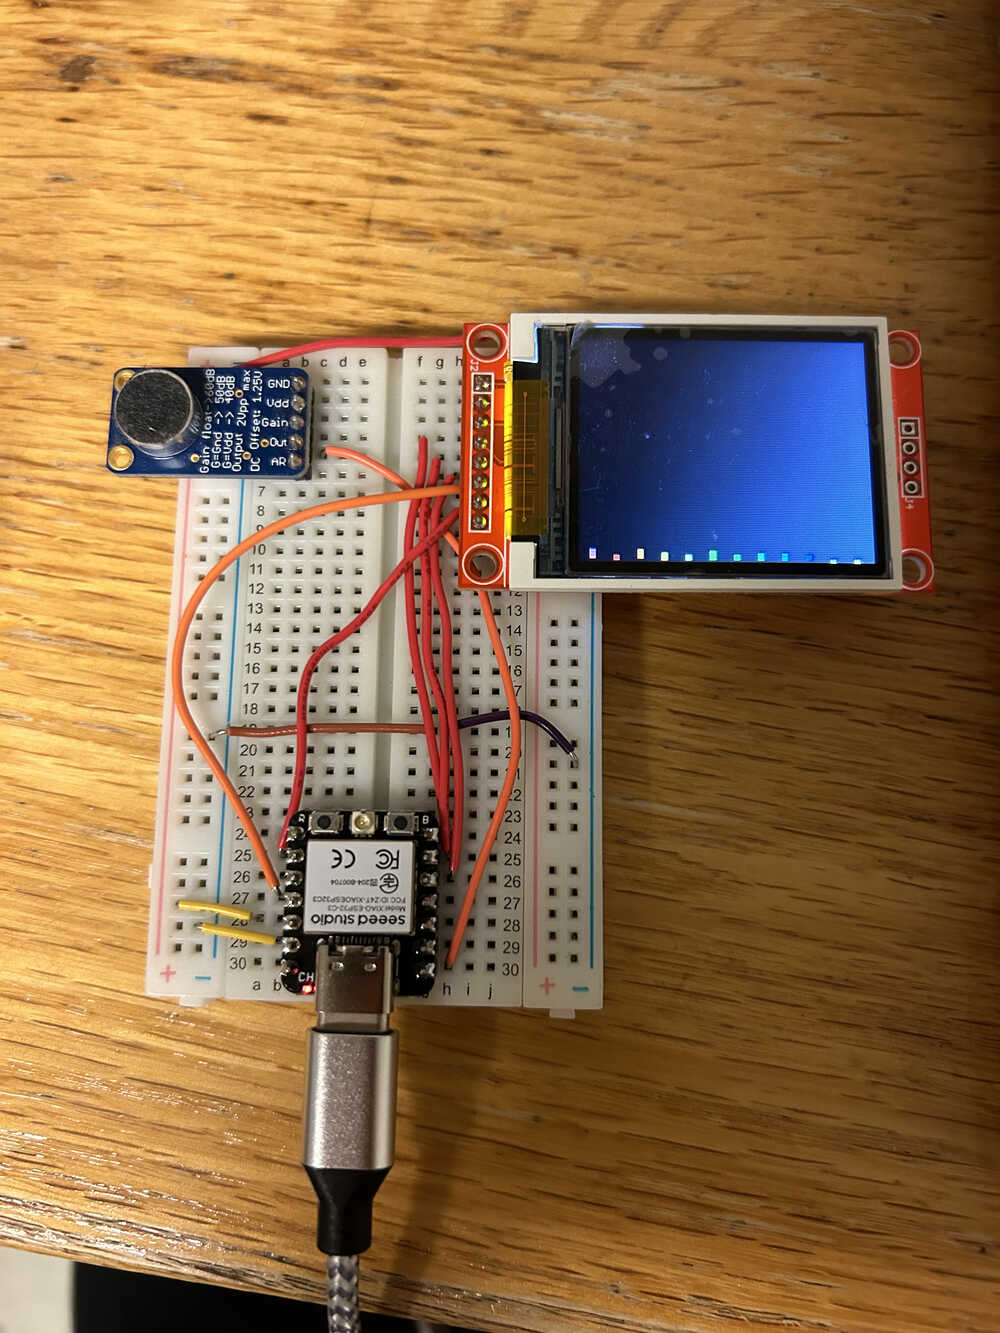
my final breadboard setup
(left) my visualization along with the song "Don't Stop Believing" (right) my visualization to whistling. more pure tones but less fun to watch
Here's my code. If I had more time I might play around more with sampling rate and number of samples for the fourier analysis.
Main takeaway: hardware is annoying to set up but cool when it works.