Project Overview
This week I worked on output devices, focusing on creating a simple display screen that will connect with my digital nose project to display sensor results. The display output device will provide visual feedback showing the scent detection results from the LIG sensor array developed in Week 8, creating a complete input-to-output system for the incense detection project. This assignment demonstrates how output devices can be integrated into custom PCBs and how their signals can be controlled by microcontrollers to display information.
The Output Device: Display Screen
The display screen functions as an output device that provides visual feedback from the digital nose system. When the LIG sensor array detects different incense aromas, the microcontroller processes the sensor signals and displays the results on the screen. This output device enables users to see real-time scent identification results, making the digital nose system interactive and informative.
The display output device will show:
• Scent Detection Status: Whether a scent is being detected
• Scent Classification: The type of incense identified
• Confidence Level: The certainty of the scent classification
• Sensor Data: Real-time sensor readings and patterns
• Visual Patterns: Genji-ko pattern visualization matching the cultural design theme
• Scent Classification: The type of incense identified
• Confidence Level: The certainty of the scent classification
• Sensor Data: Real-time sensor readings and patterns
• Visual Patterns: Genji-ko pattern visualization matching the cultural design theme
Output Device Integration
The display screen was designed to integrate with the digital nose system through a custom PCB. The output device connects to a microcontroller that processes the LIG sensor array signals and generates visual output. This creates a complete input-to-output workflow: LIG sensors (input) detect scents → microcontroller processes signals → display screen (output) shows results.
The integration allows the digital nose system to provide immediate visual feedback, making it an interactive device that bridges traditional Japanese incense rituals with modern digital sensing and display technologies.
PCB Design Process
I followed Quentin's tutorial for creating the display output device PCB design, editing the PCB design directly from his tutorial files. This approach helped ensure I was following the correct workflow and using proper design practices. The PCB design process involved:
1. Starting from Tutorial: Using Quentin's tutorial design as the foundation
2. Editing the Schematic: Modifying the circuit design for the display output device
3. PCB Layout Design: Arranging components and routing traces for the display screen
4. Component Placement: Positioning the display controller and supporting components
5. Trace Routing: Creating proper electrical connections for the output device By following Quentin's tutorial and editing the design directly, I was able to learn the proper workflow for PCB design while customizing it for my specific output device requirements.
Fabrication Process
I started by exporting the PCB design as Gerber files and processing them through mods to generate CNC toolpaths. The process used a 0.4mm end mill for trace milling and 0.8mm end mill for the board outline. Even though I followed Quentin's tutorial steps carefully and edited my PCB design from it directly, I still faced challenges during fabrication. The most critical step was setting the Z-height precisely on the copper surface - even small errors significantly affect trace quality. After milling, I inspected the board under magnification and tested for continuity and shorts.
Challenges: PCB Soldering and Paste Application
I attempted multiple times at PCB soldering, and using paste is not my strong suit. The soldering challenges I faced included:
1. Paste Application: Applying solder paste accurately and in the right quantities
2. Component Placement: Positioning small components correctly on the paste
3. Heat Management: Controlling temperature during reflow to avoid component damage
4. Connection Quality: Ensuring proper electrical connections without shorts or cold joints
5. Multiple Attempts: Learning from each attempt and improving technique Despite following Quentin's tutorial steps carefully, the soldering process required multiple attempts to achieve acceptable results. Each attempt taught me more about the importance of precision in paste application and component placement. Working with output devices requires careful attention to detail since poor connections can prevent the display from functioning correctly.
Output Device Testing
After completing the PCB fabrication and soldering, I tested the display output device to verify it could receive signals from a microcontroller and display visual information. The testing process involved:
1. Connection Verification: Ensuring proper electrical connections between microcontroller and display
2. Signal Testing: Verifying that control signals are being received correctly
3. Display Output: Testing that the screen can render visual information
4. Integration Testing: Preparing for connection with the LIG sensor array from Week 8 The output device testing validated that the display can function as intended, ready for integration with the digital nose input system to create a complete input-output feedback loop.
Images
PCB Design Process
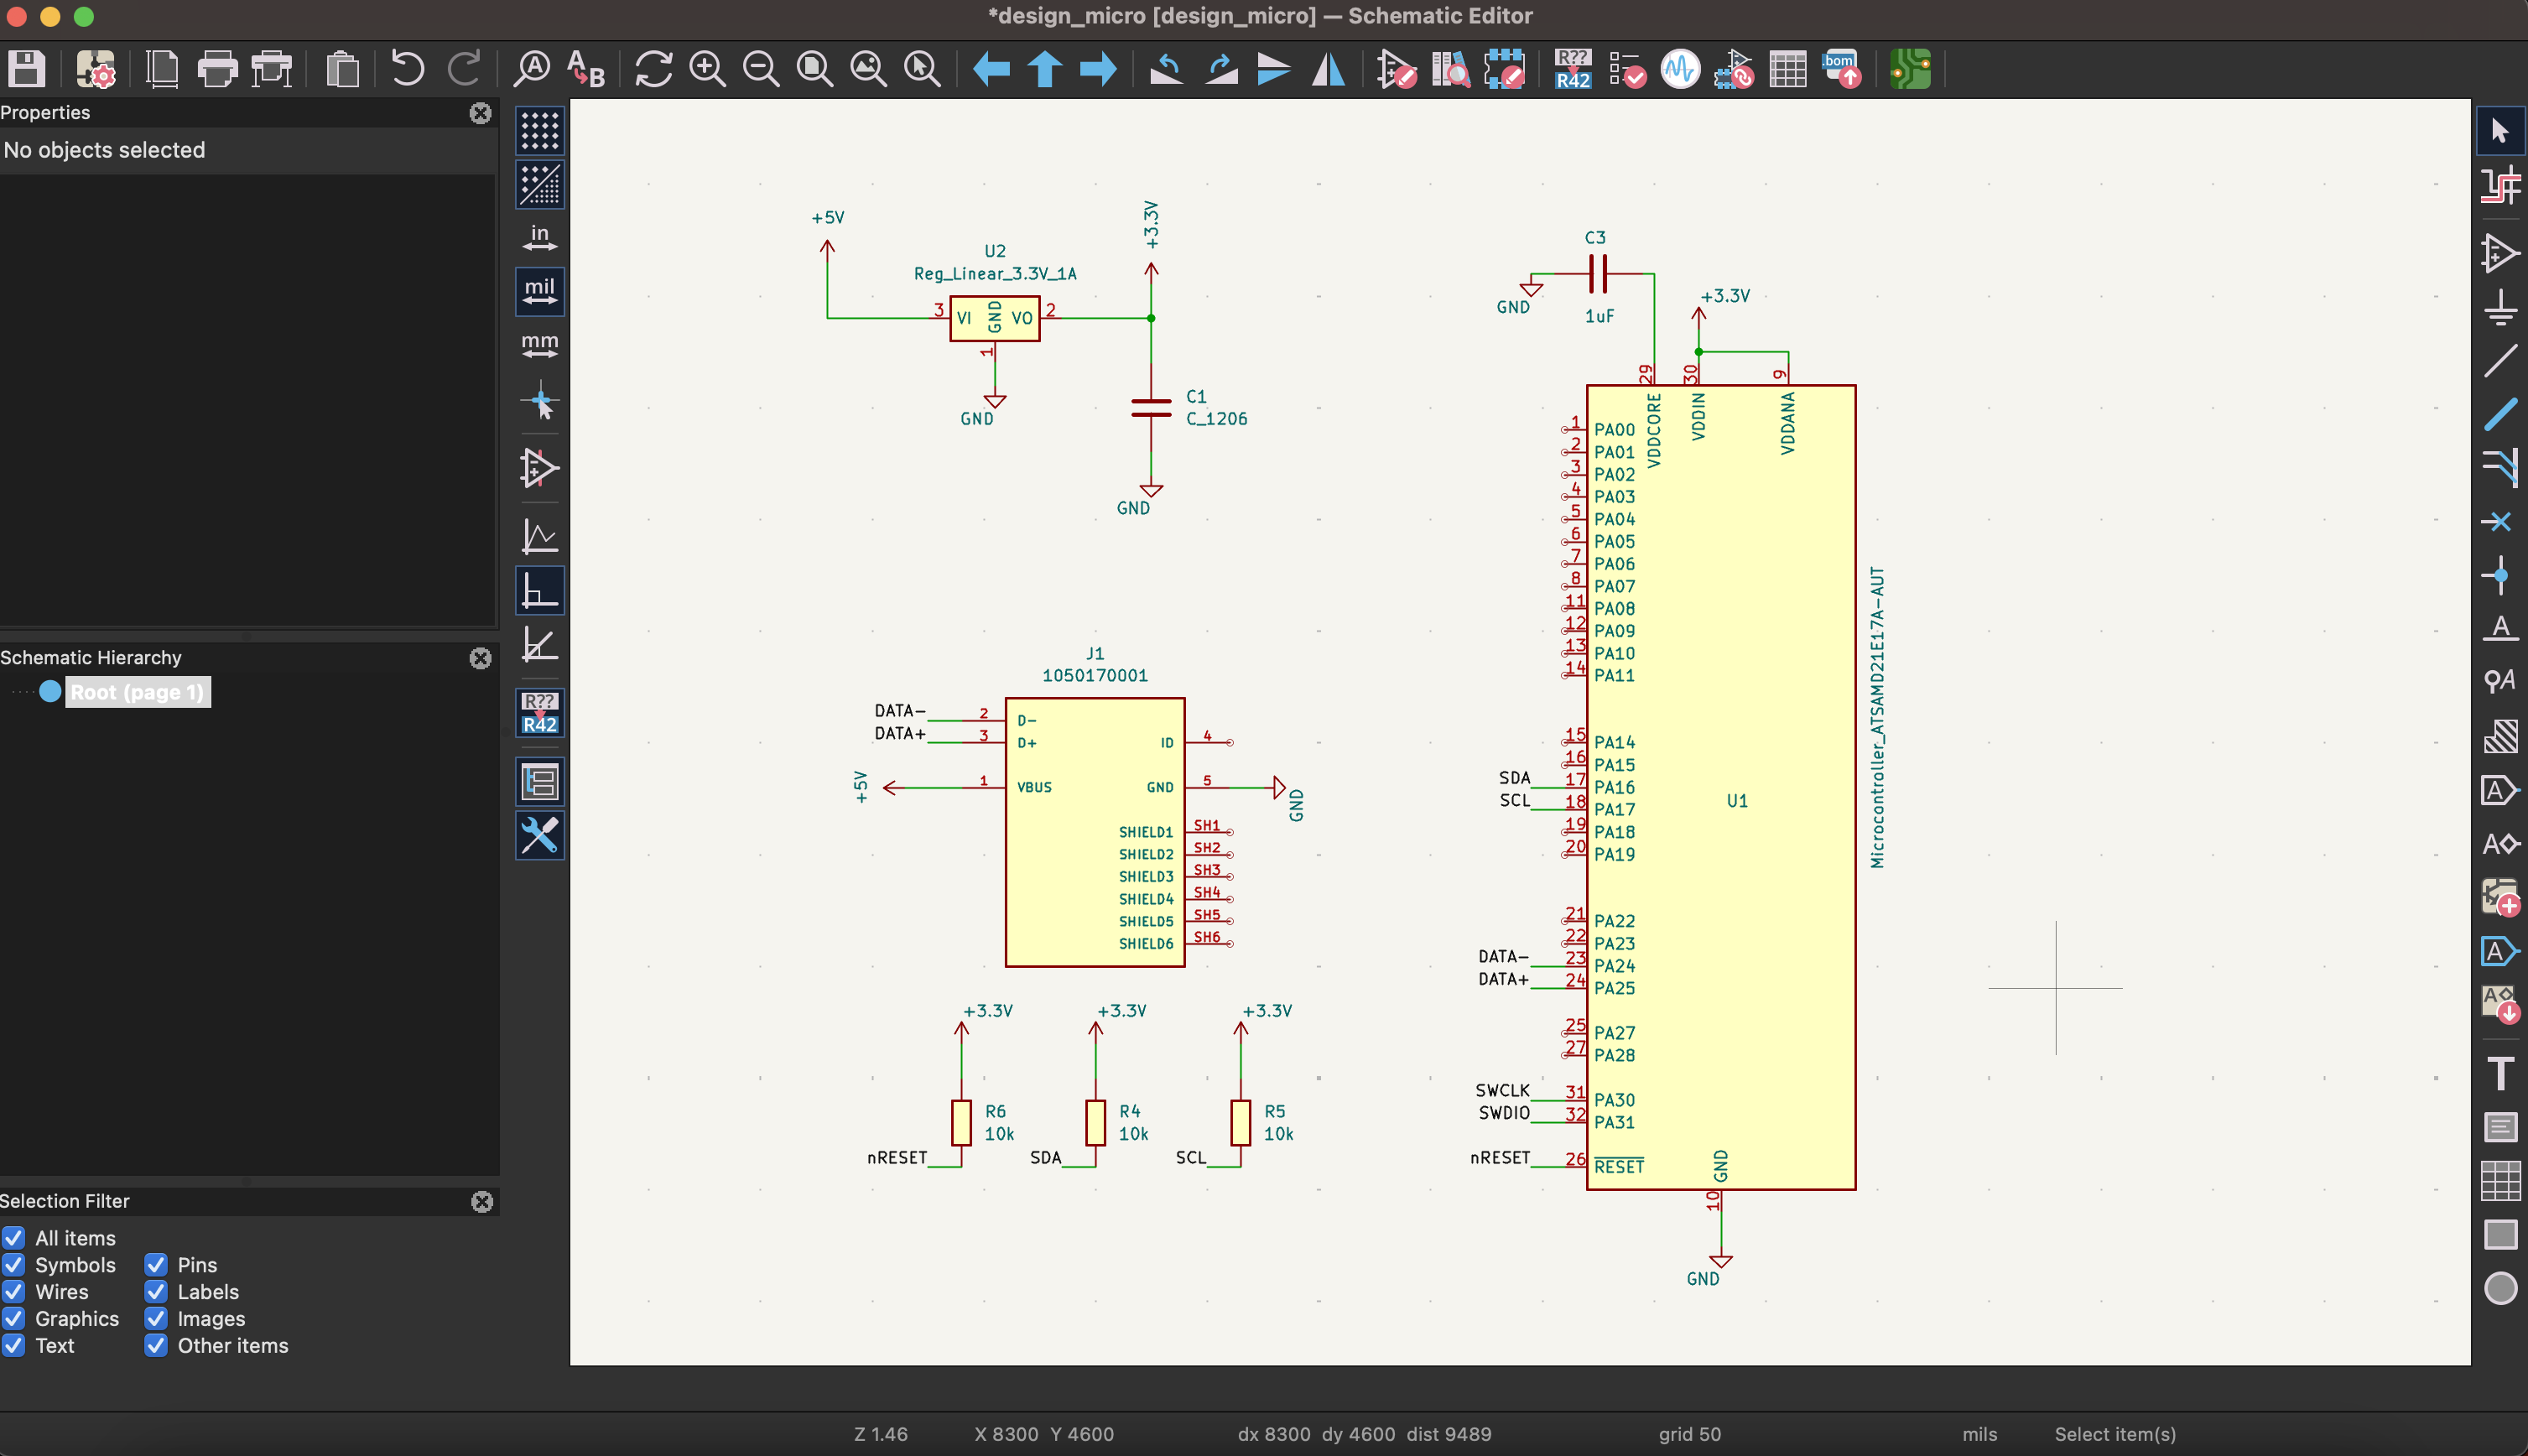
PCB schematic editor showing the display output device circuit design, edited from Quentin's tutorial
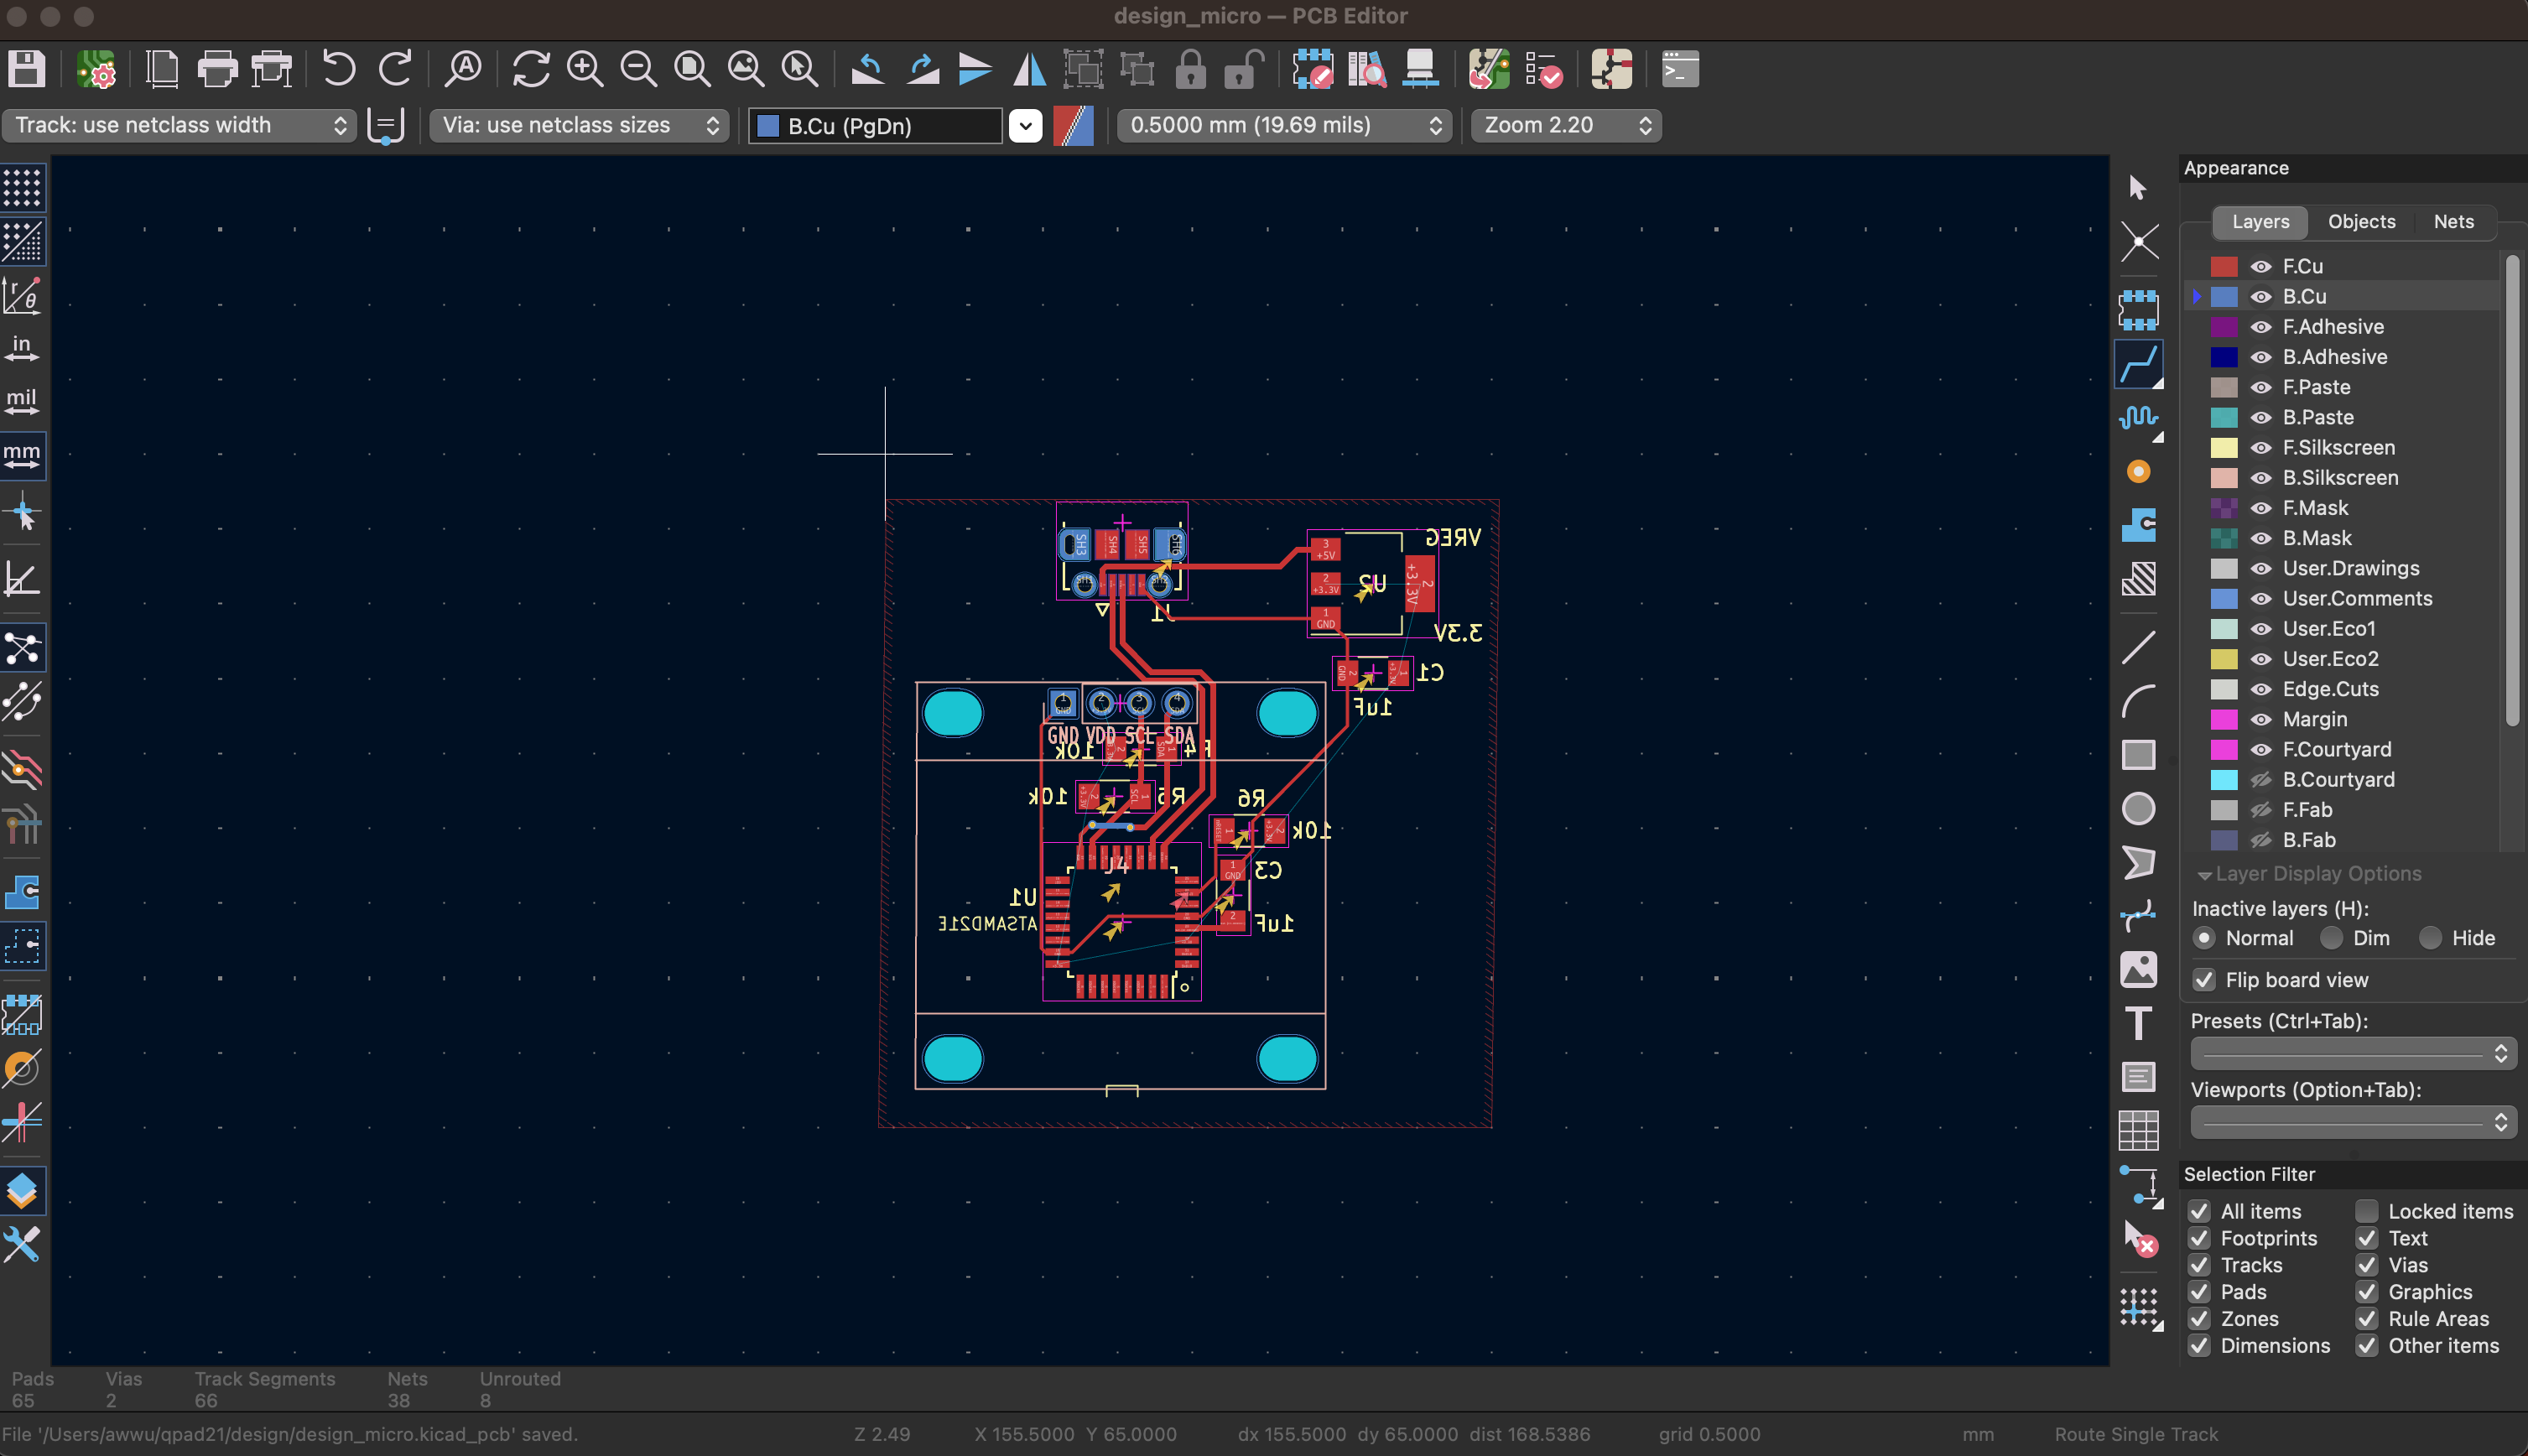
PCB editor showing the complete board layout for the display output device with component placement and trace routing
Gerber File Generation
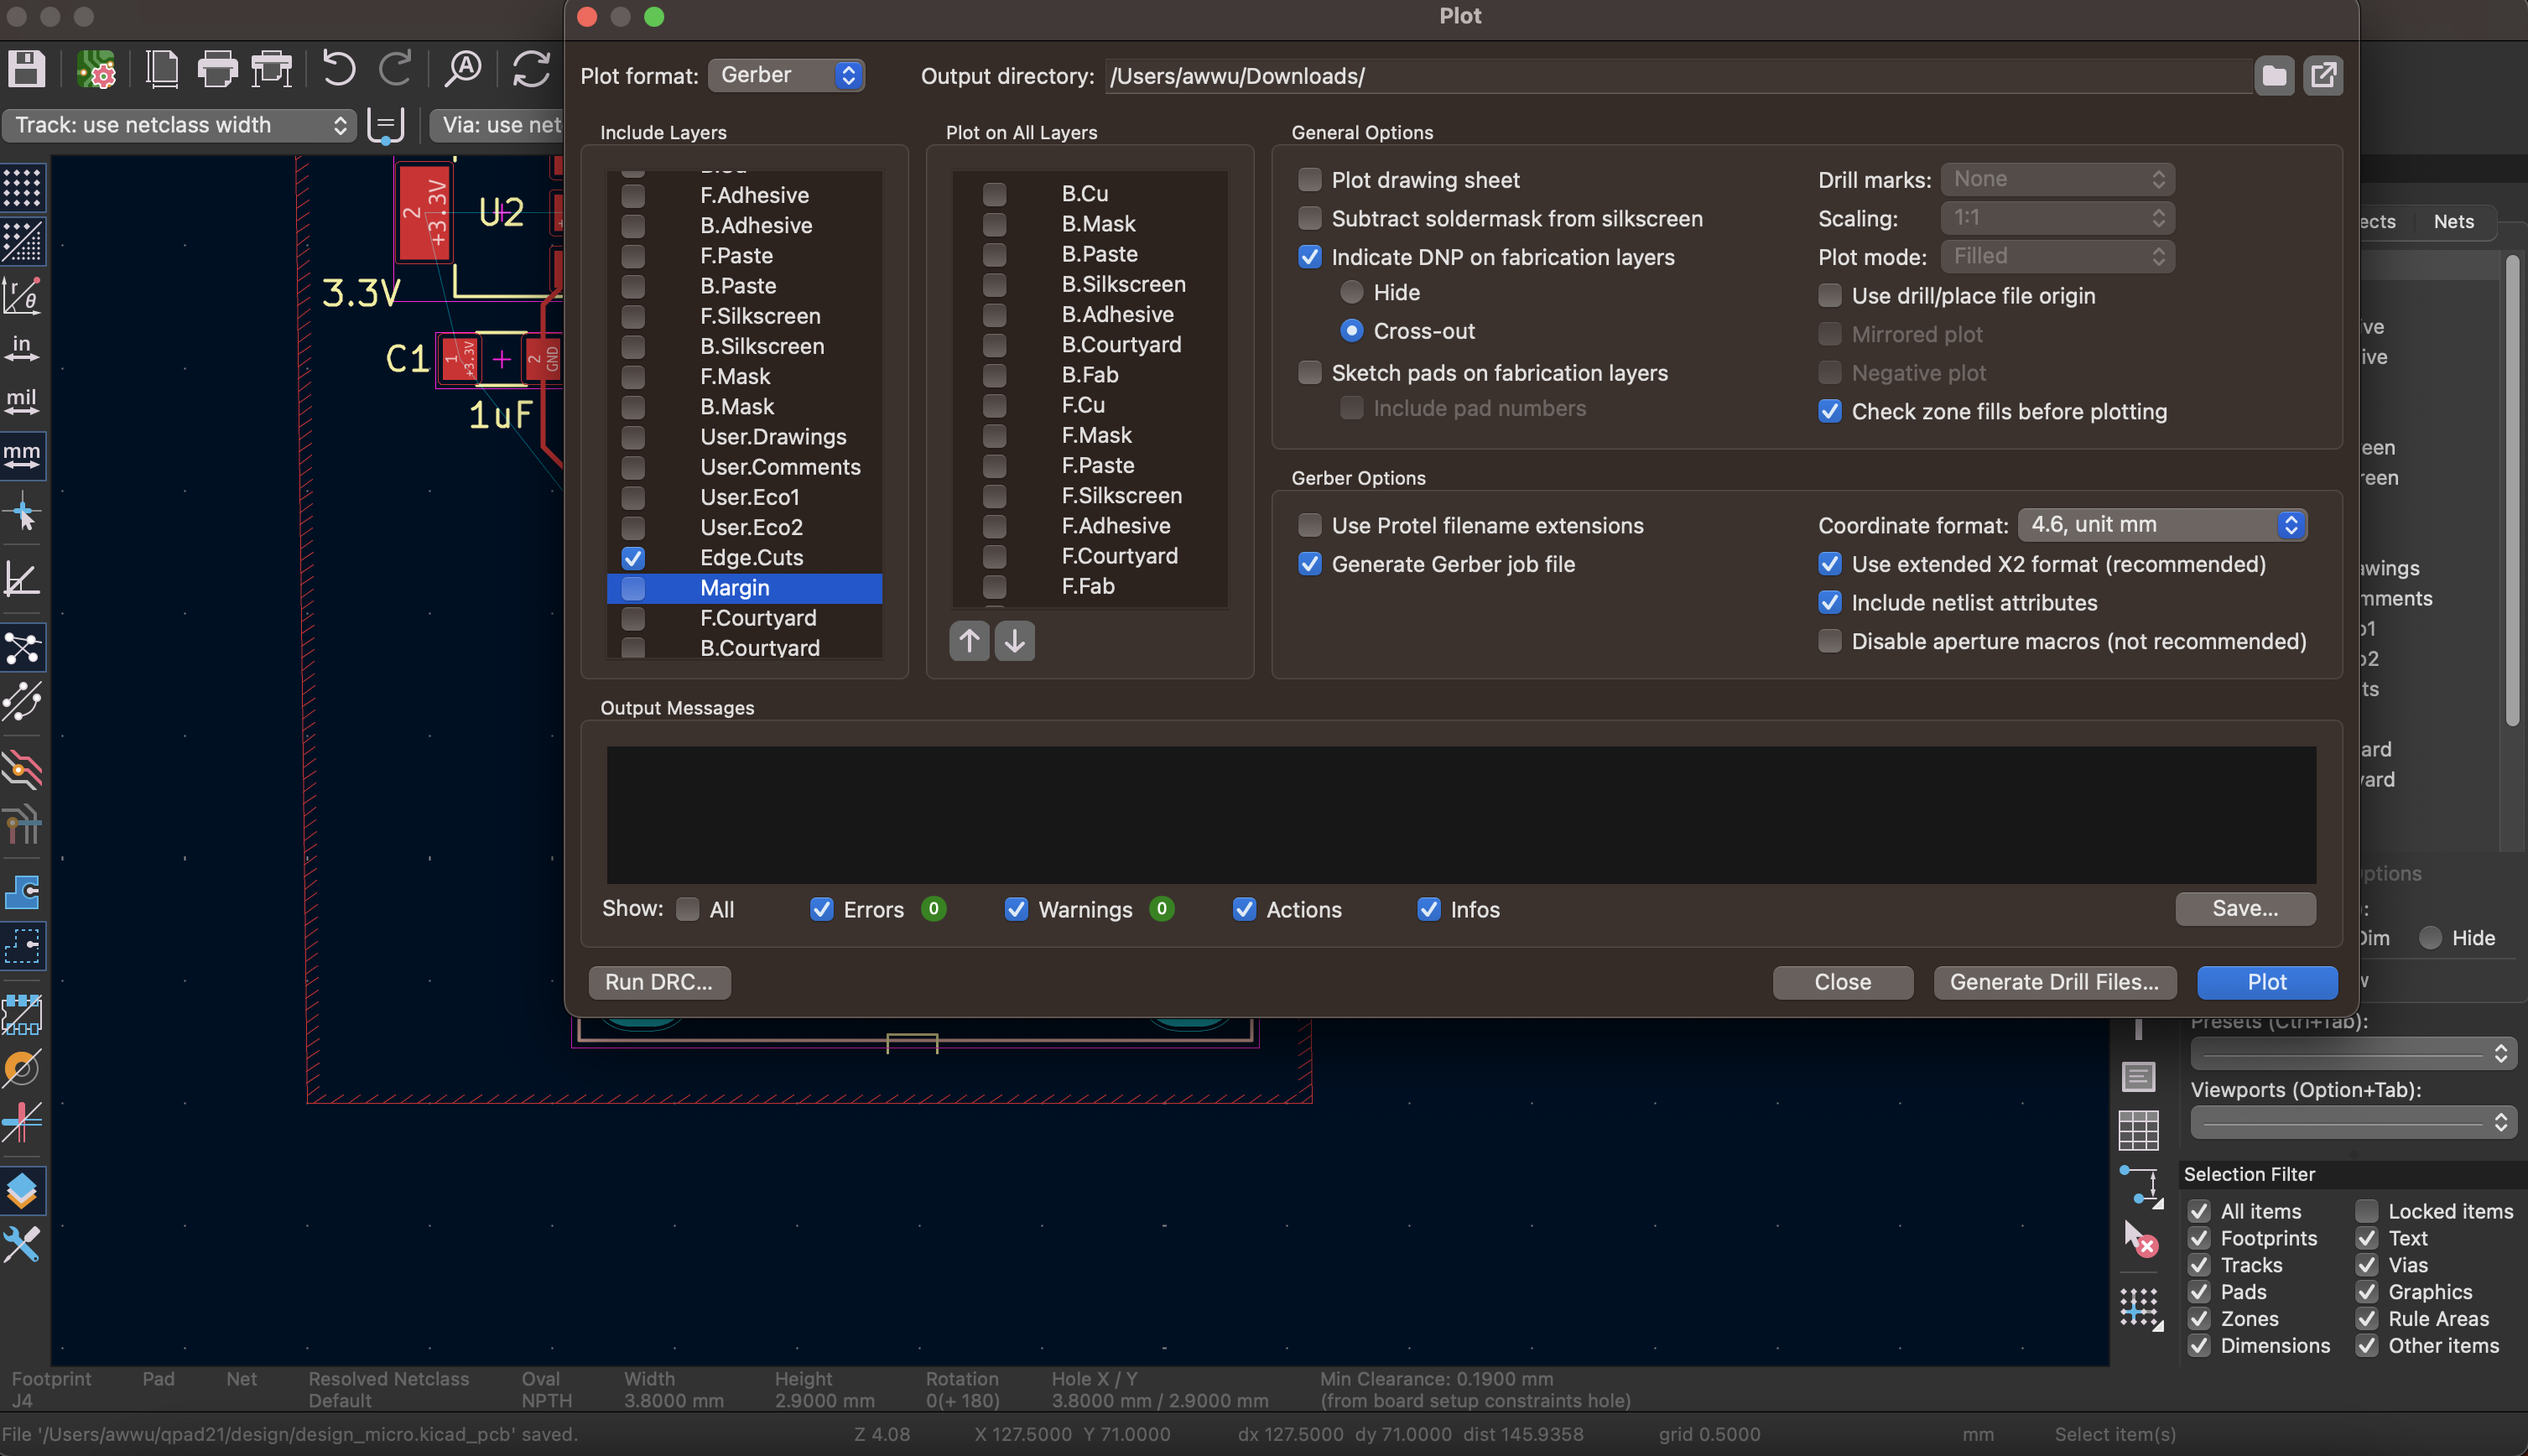
Gerber file showing the PCB trace pattern for the display output device, ready for milling
PCB Milling Process
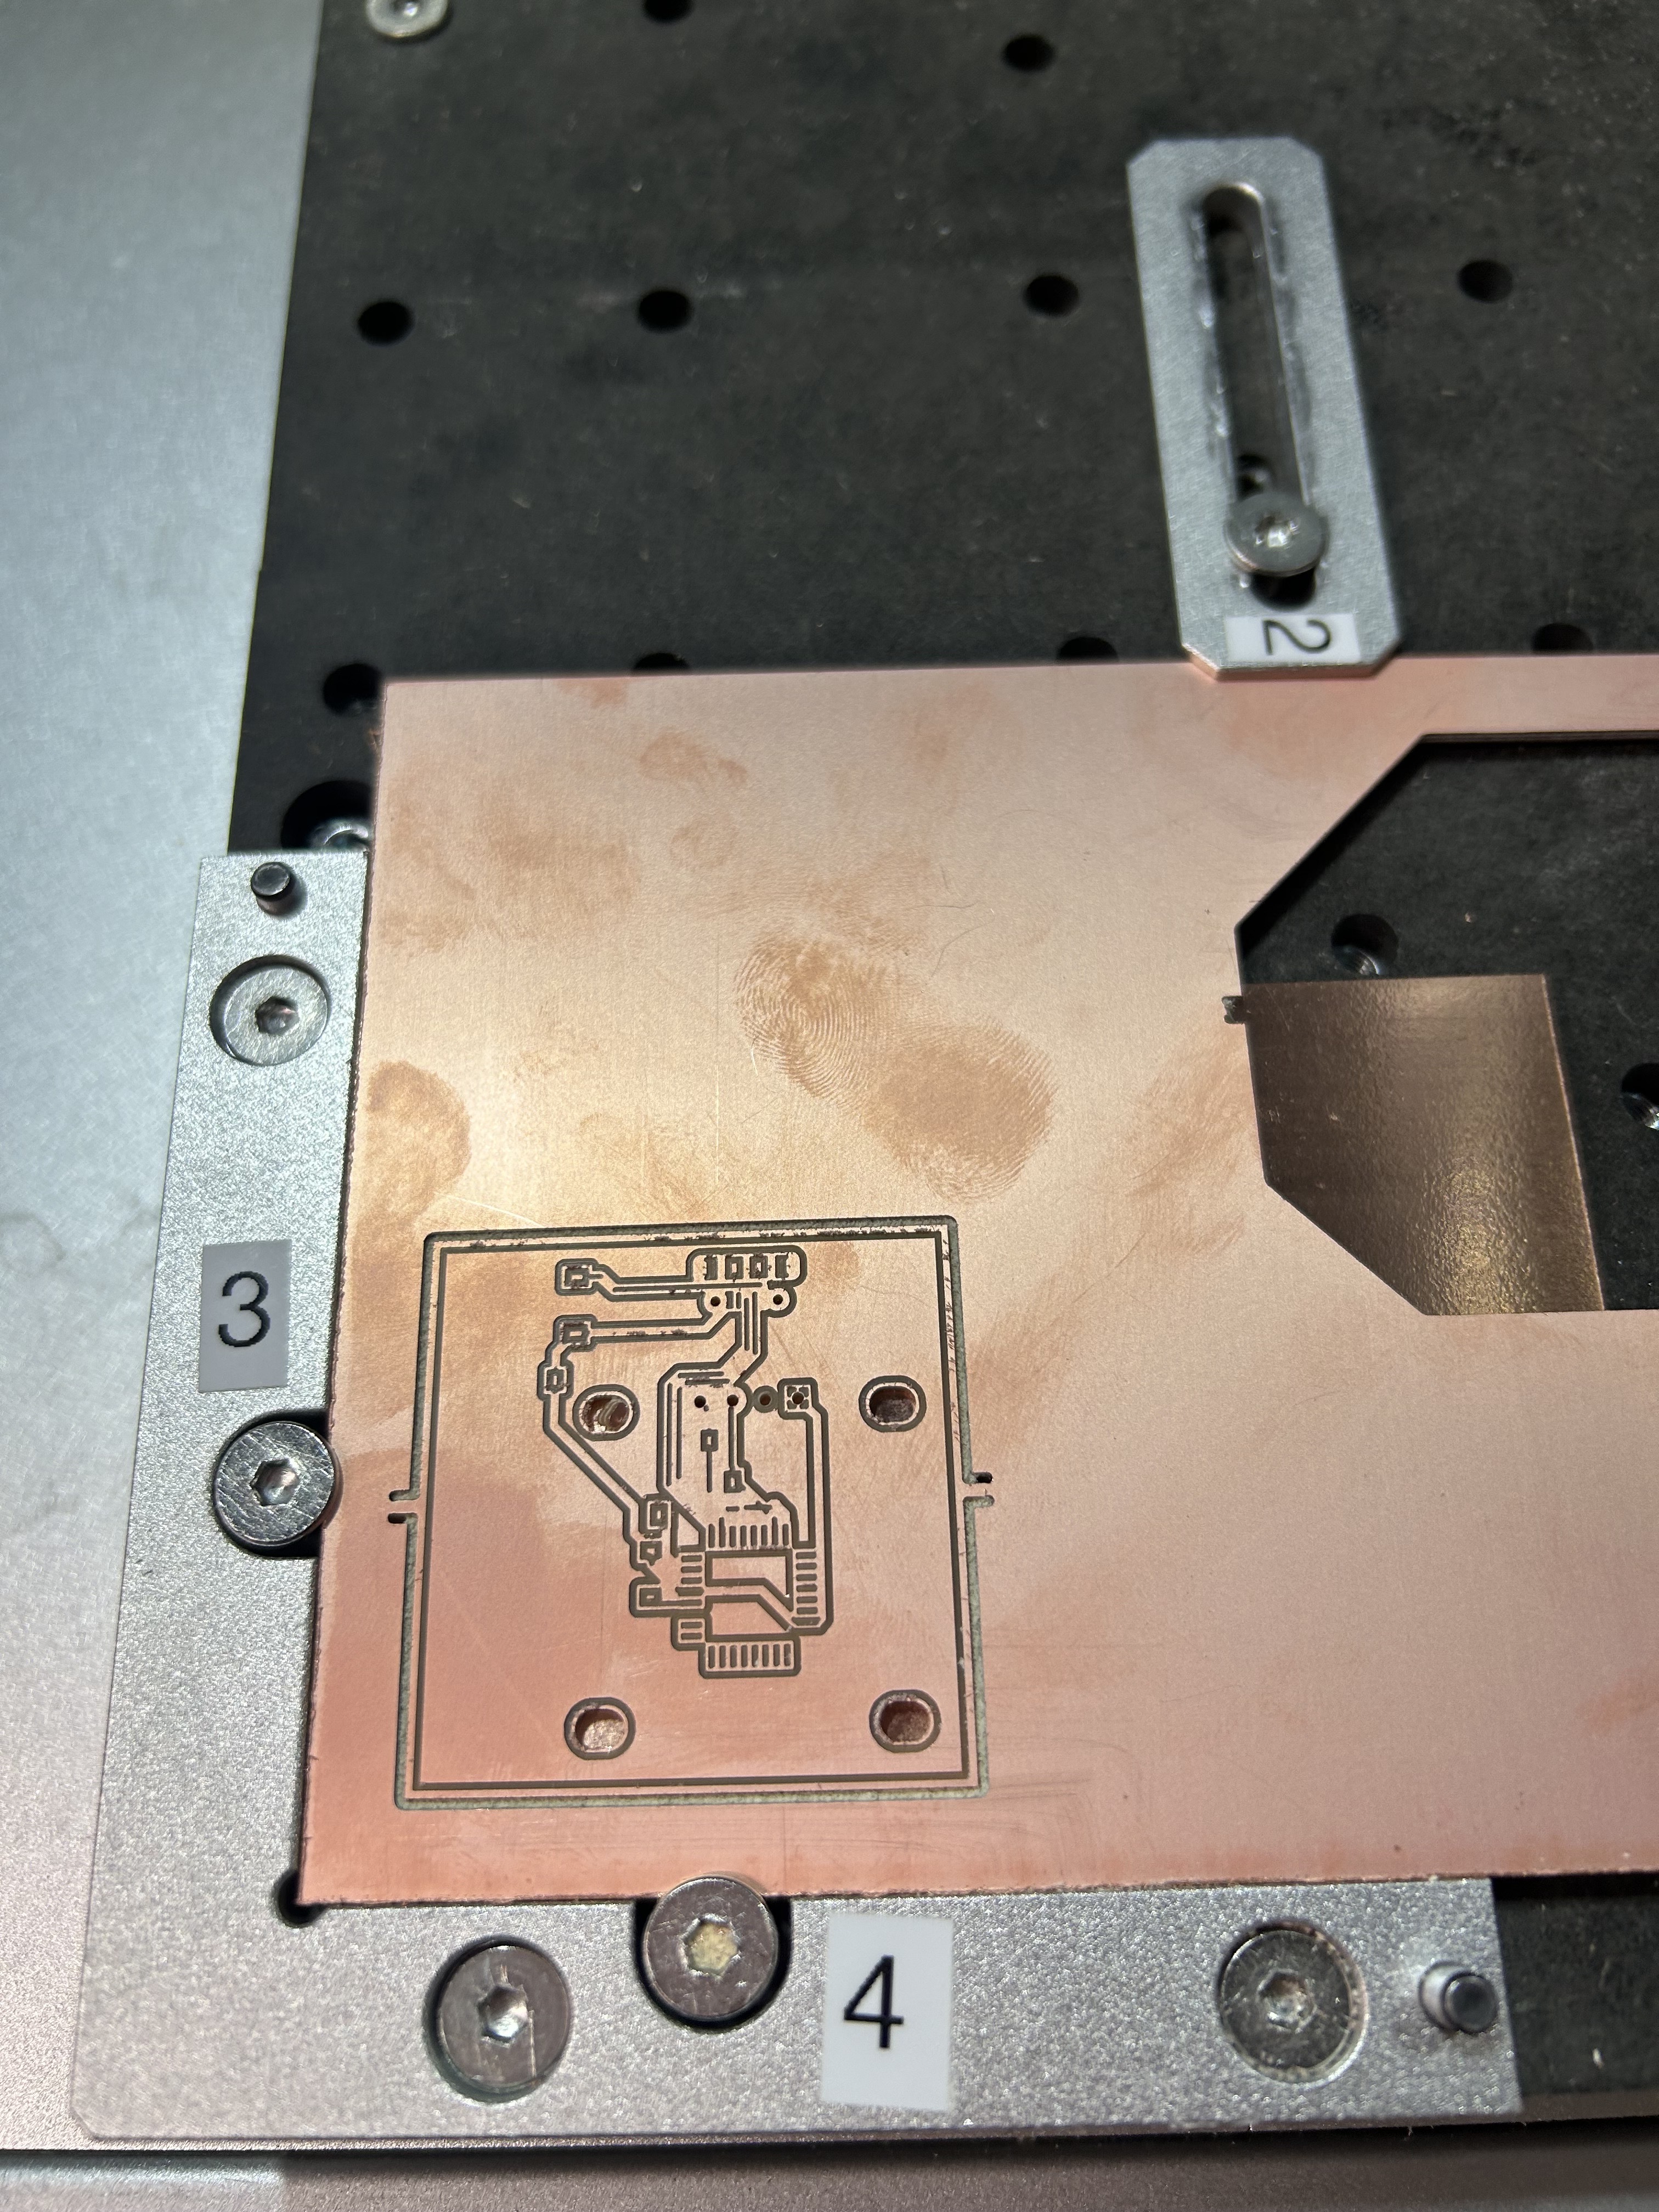
PCB board during the milling process, showing the CNC machine creating traces for the display output device
Soldering Process
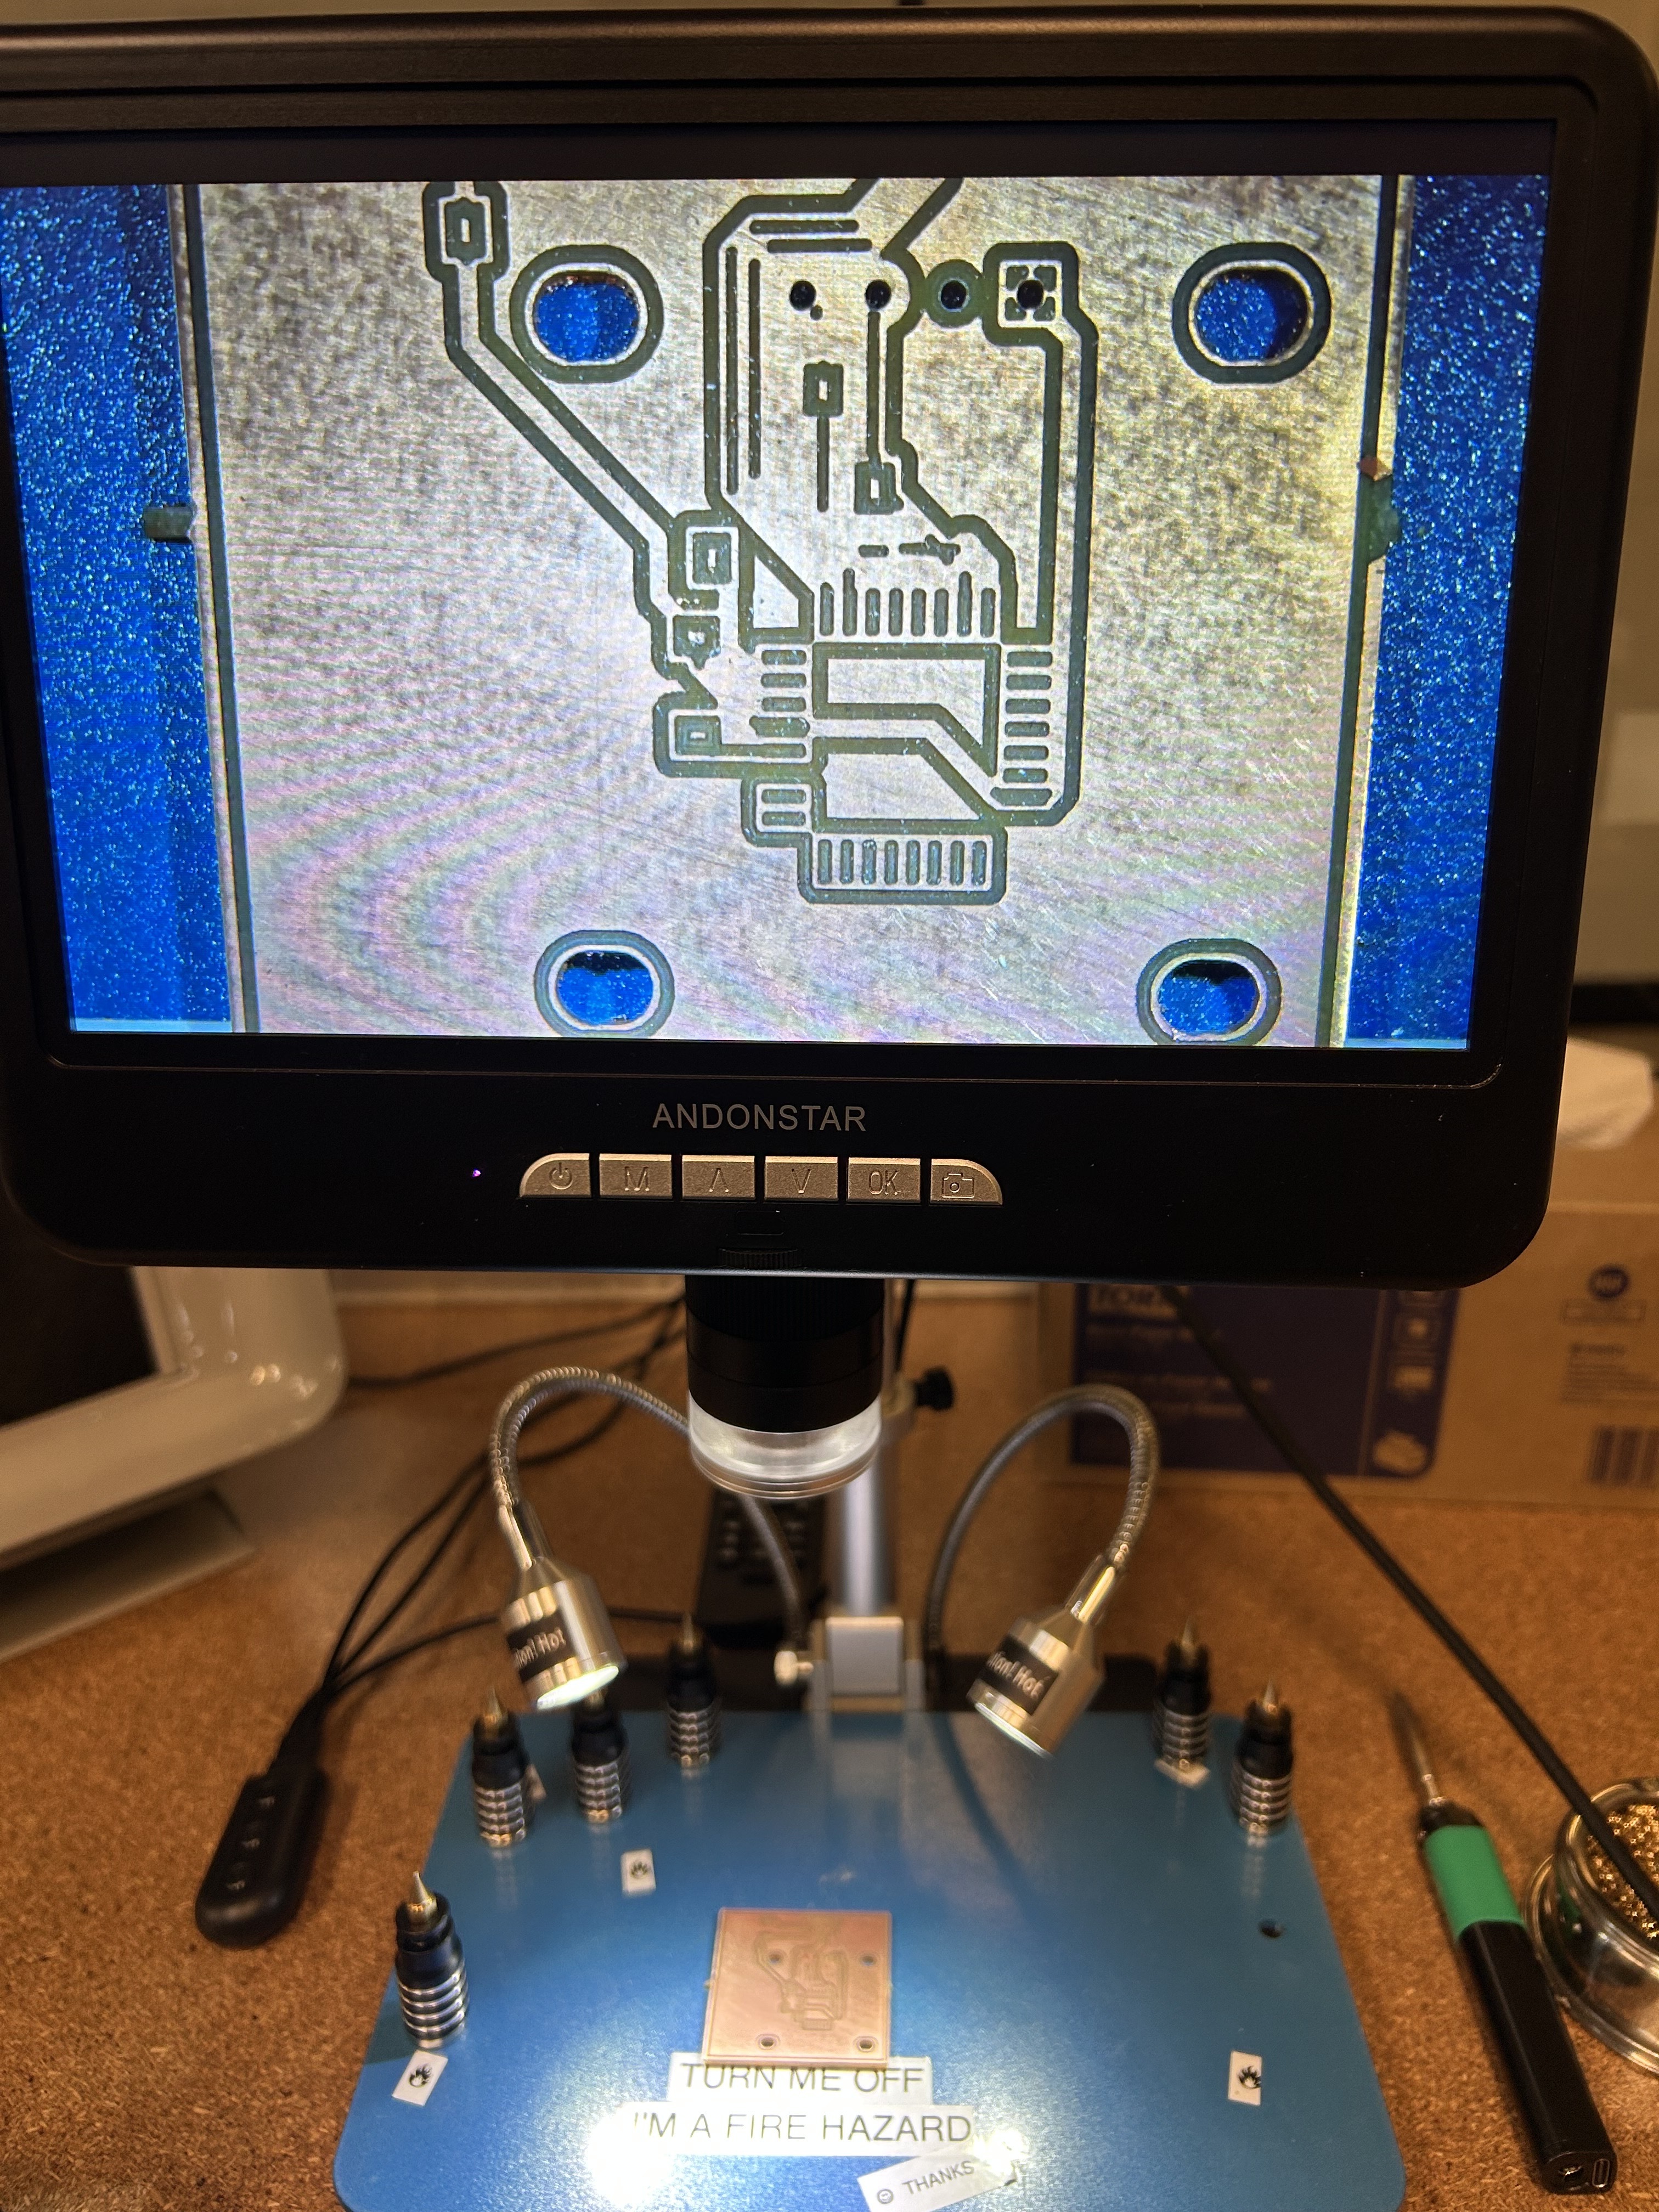
Soldering process showing component placement and paste application during one of the multiple attempts
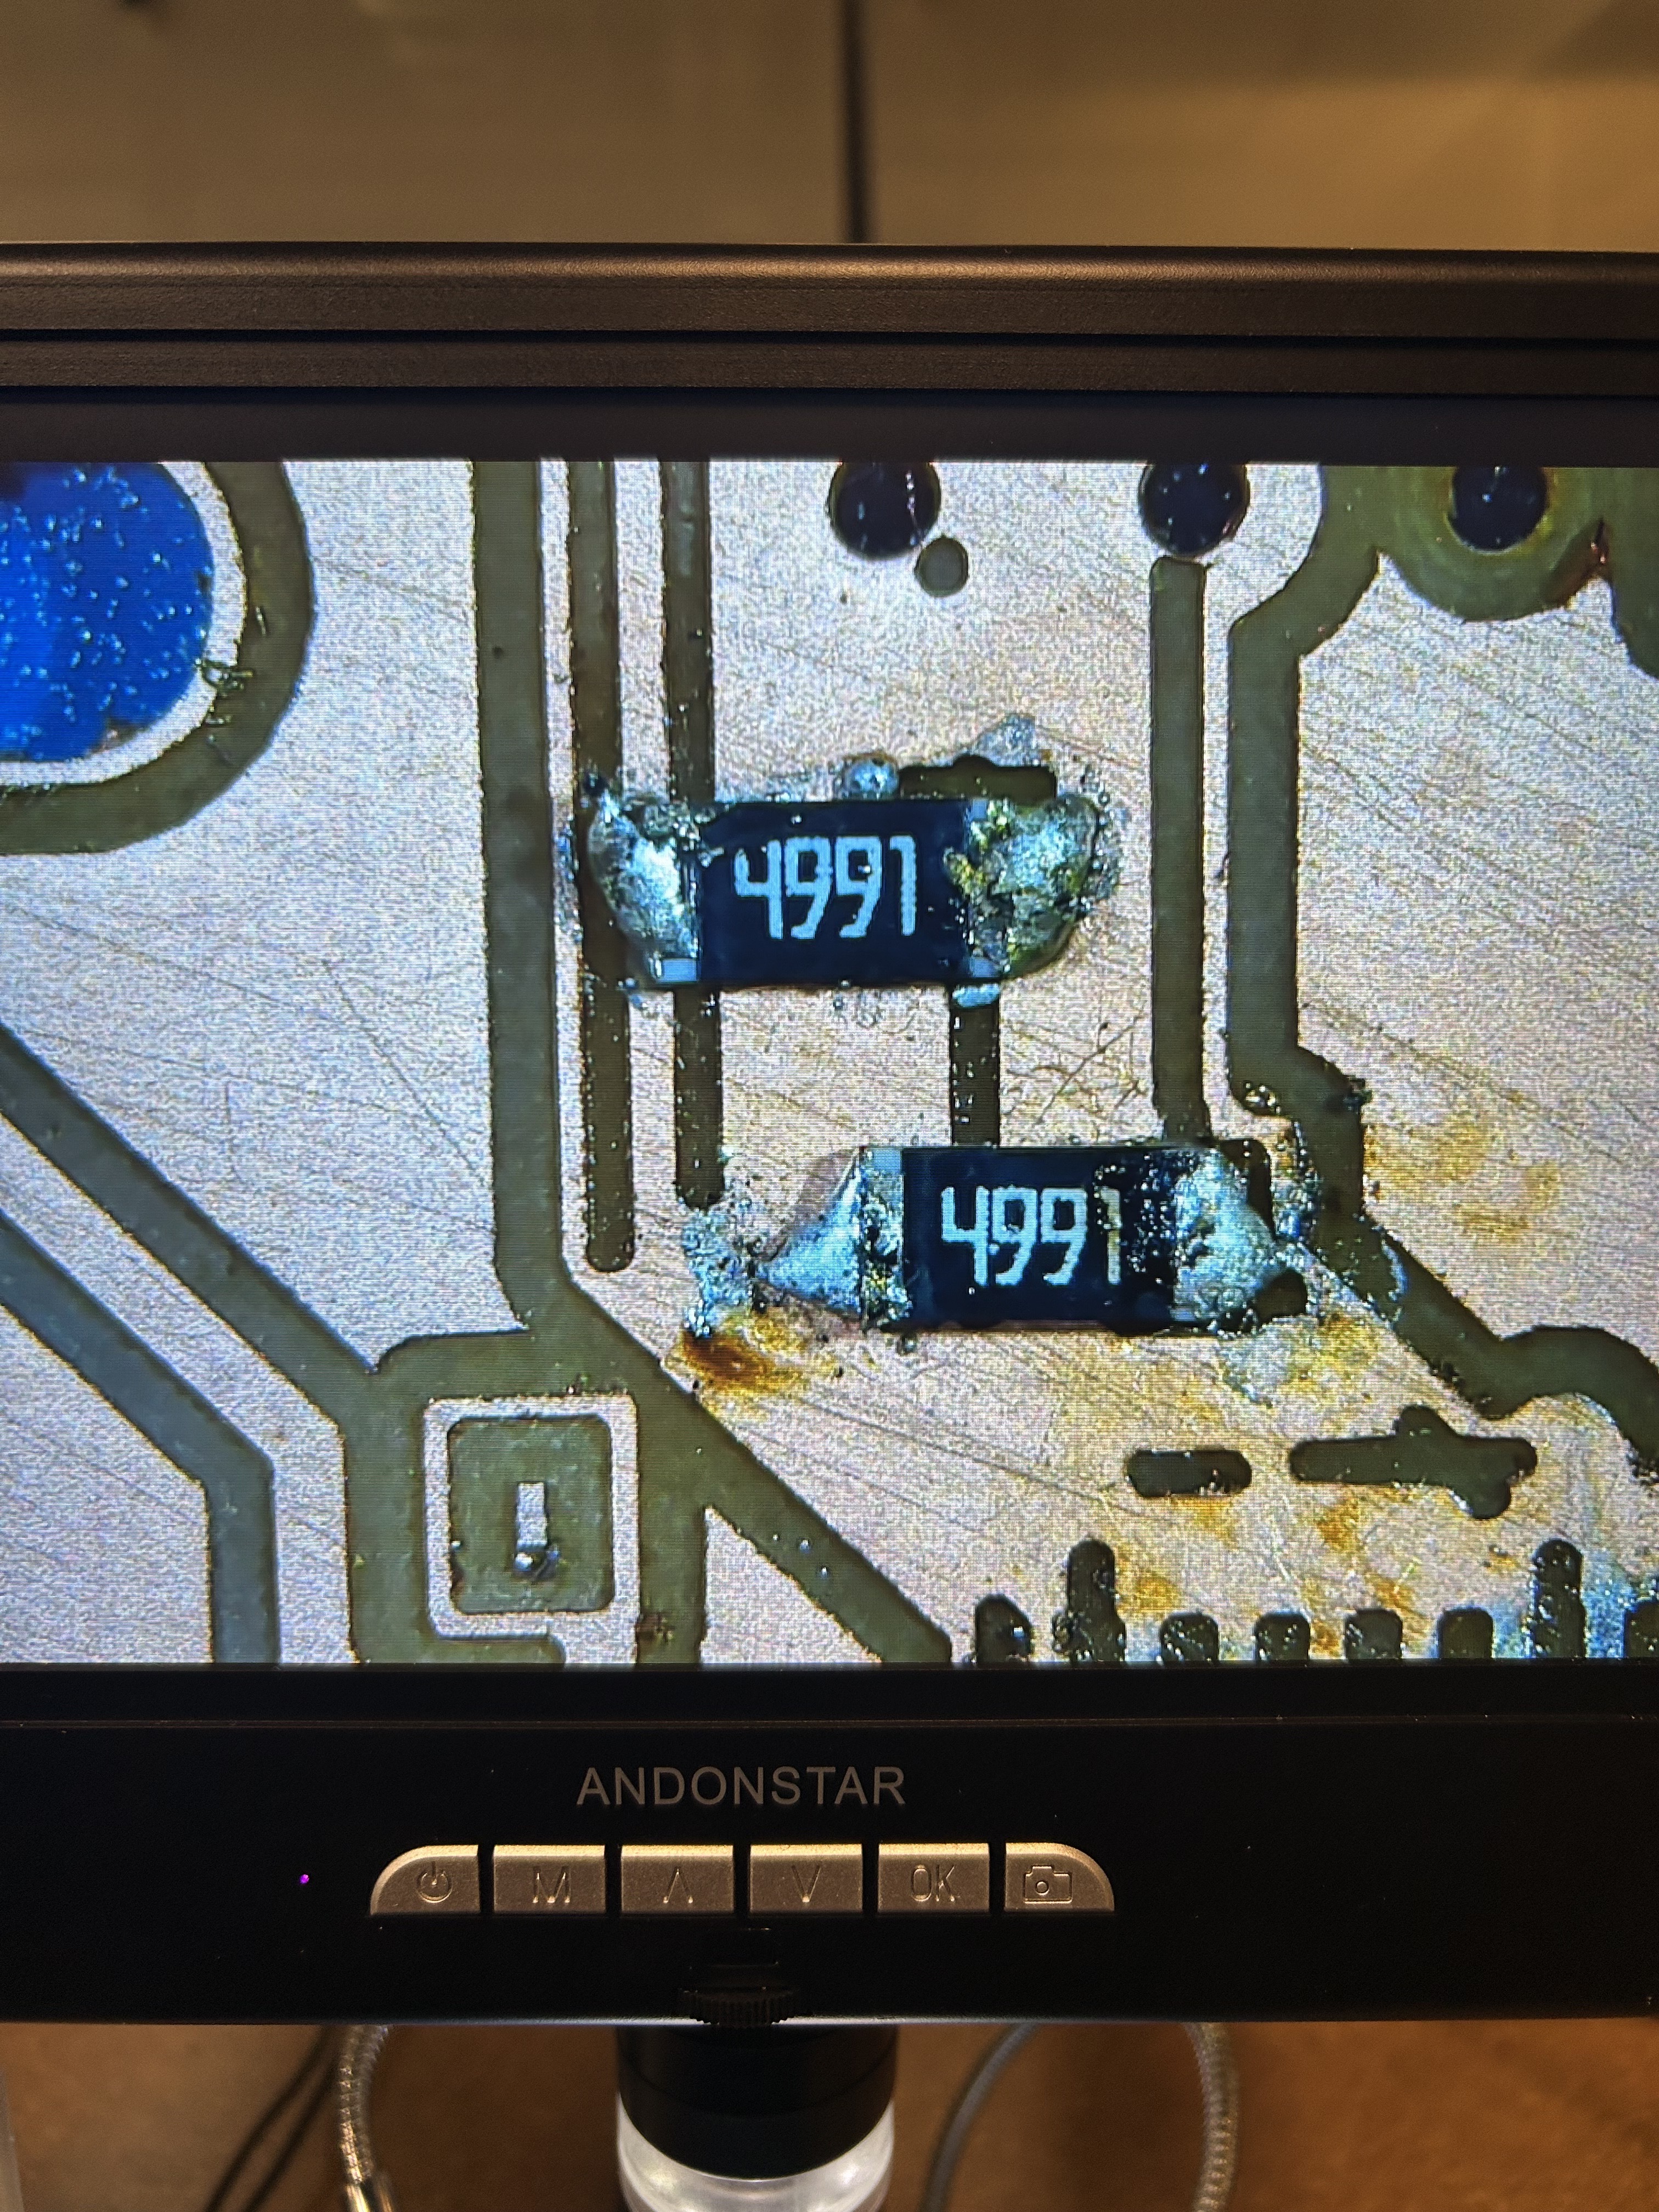
Close-up view of resistor soldering, demonstrating the precision required for paste application and component placement
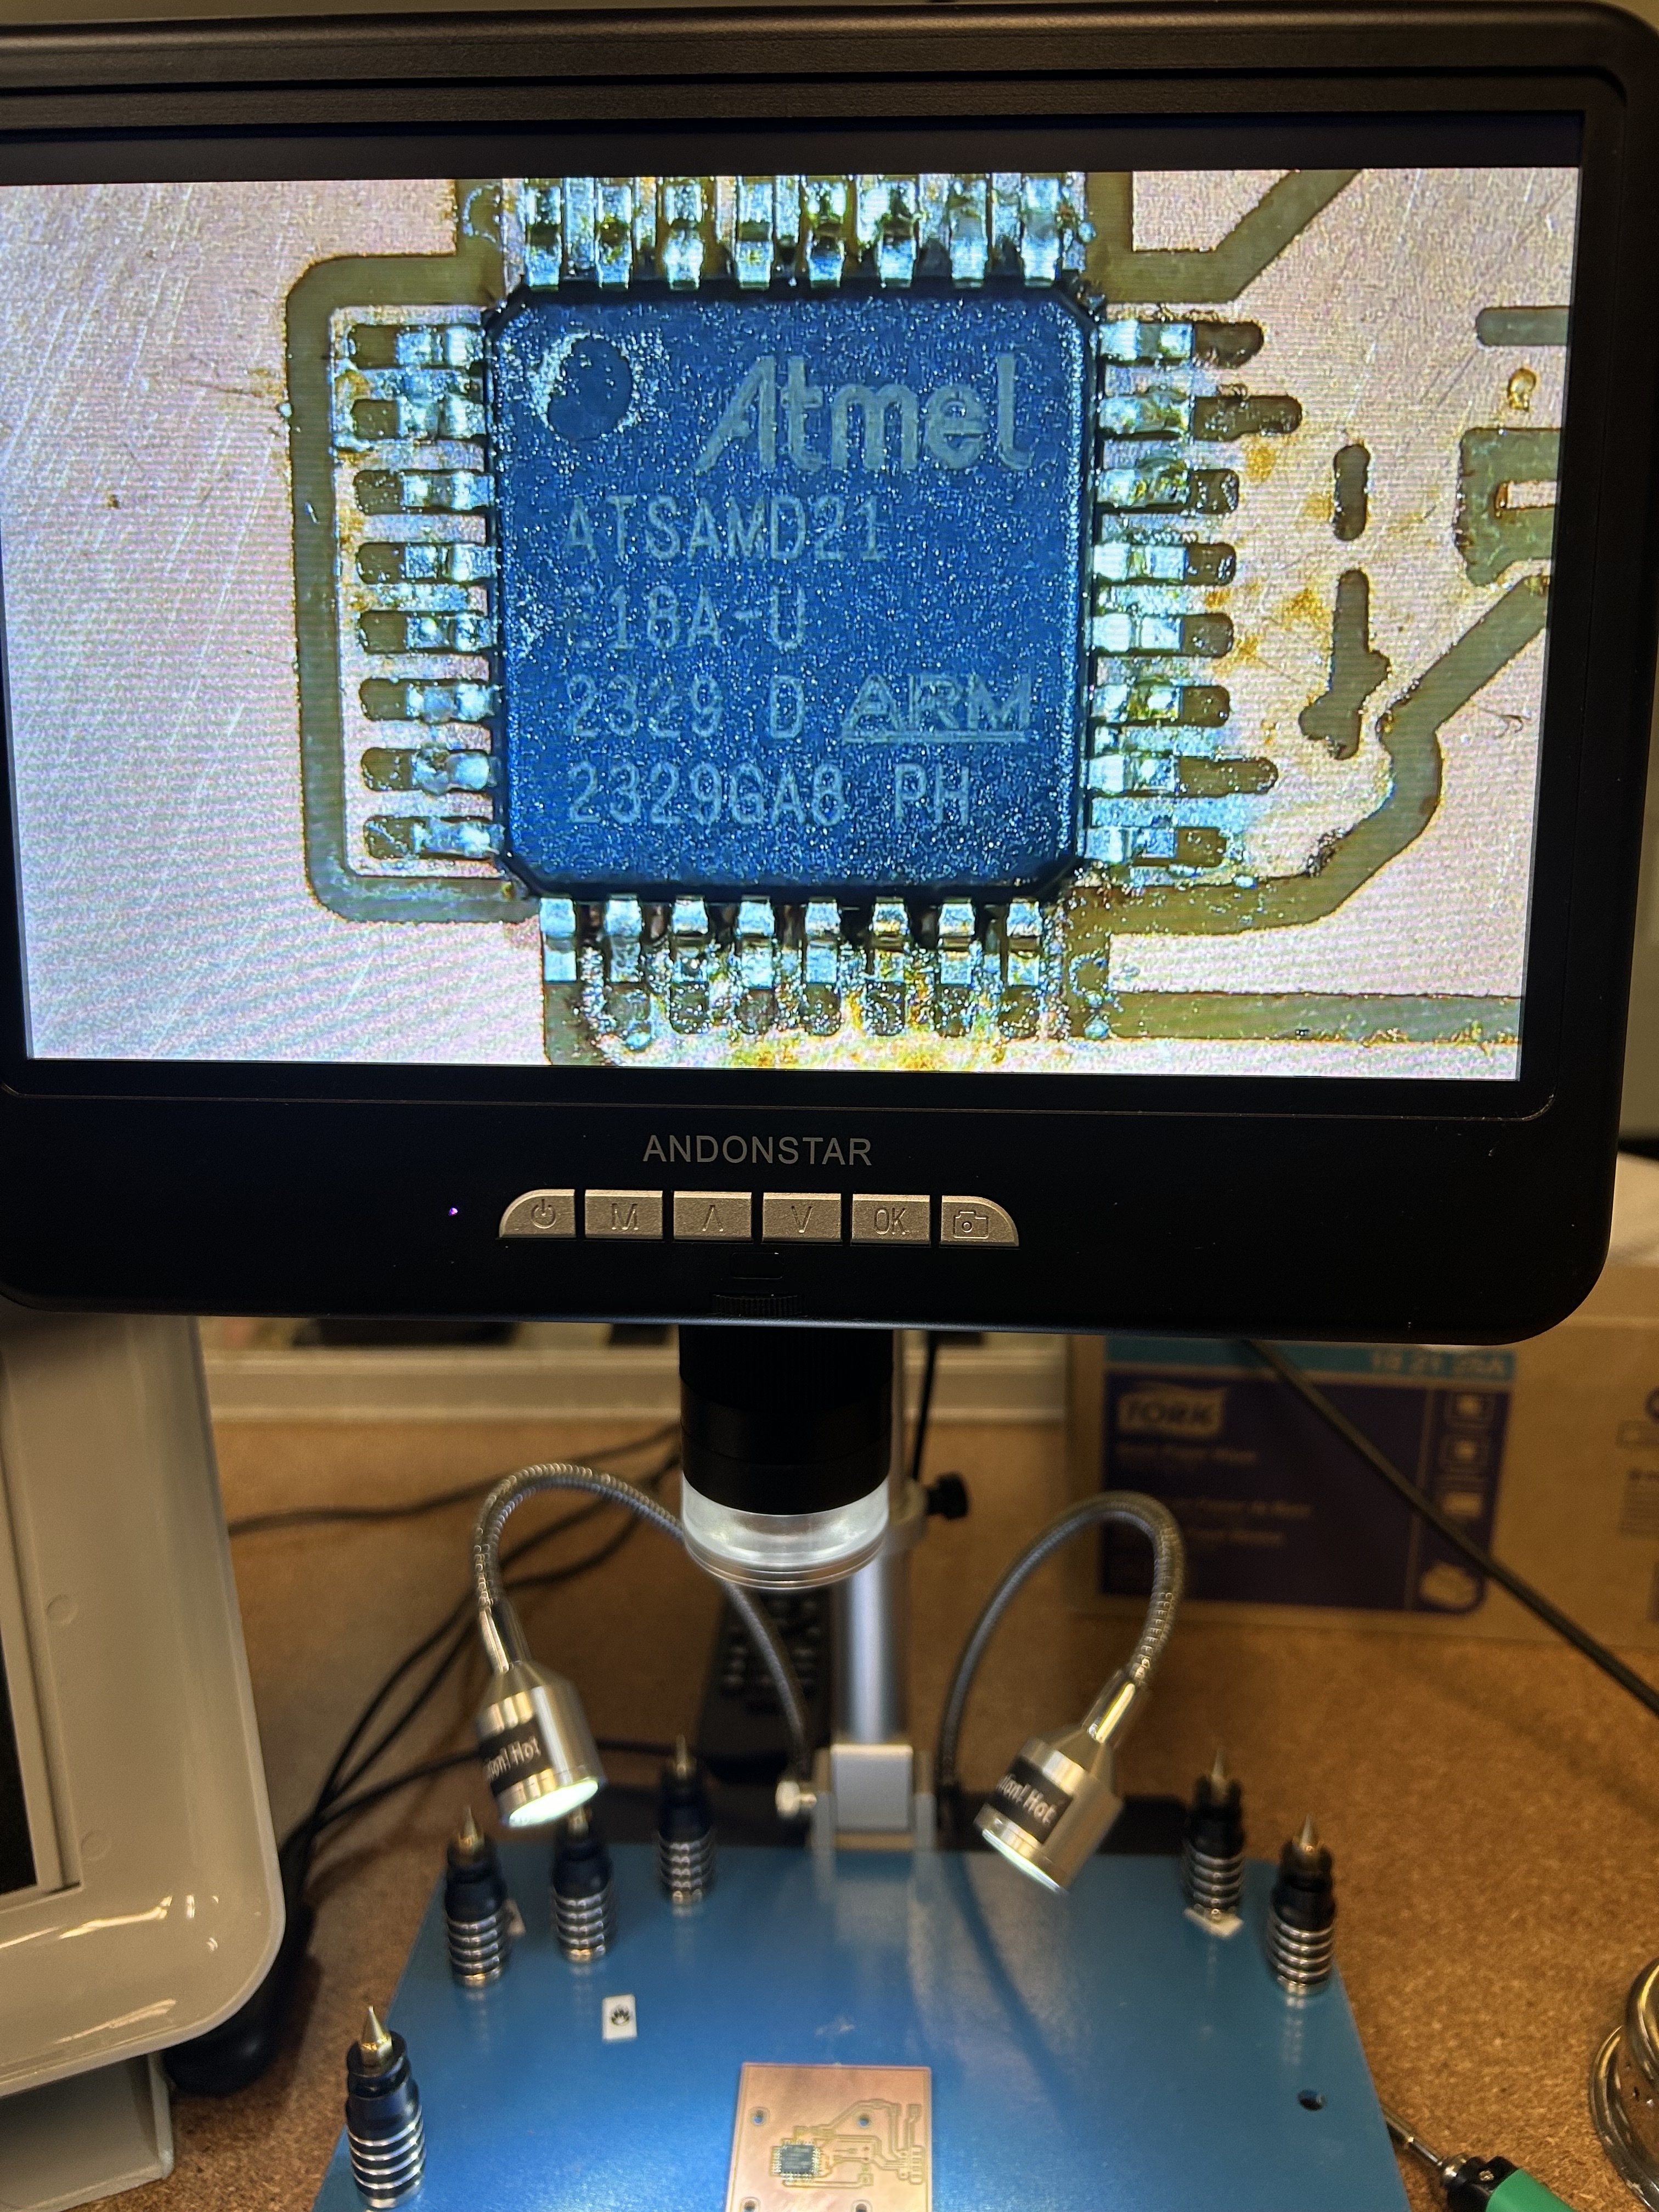
Soldering the SAMD21 microcontroller to the PCB, showing the complexity of working with fine-pitch components and paste application
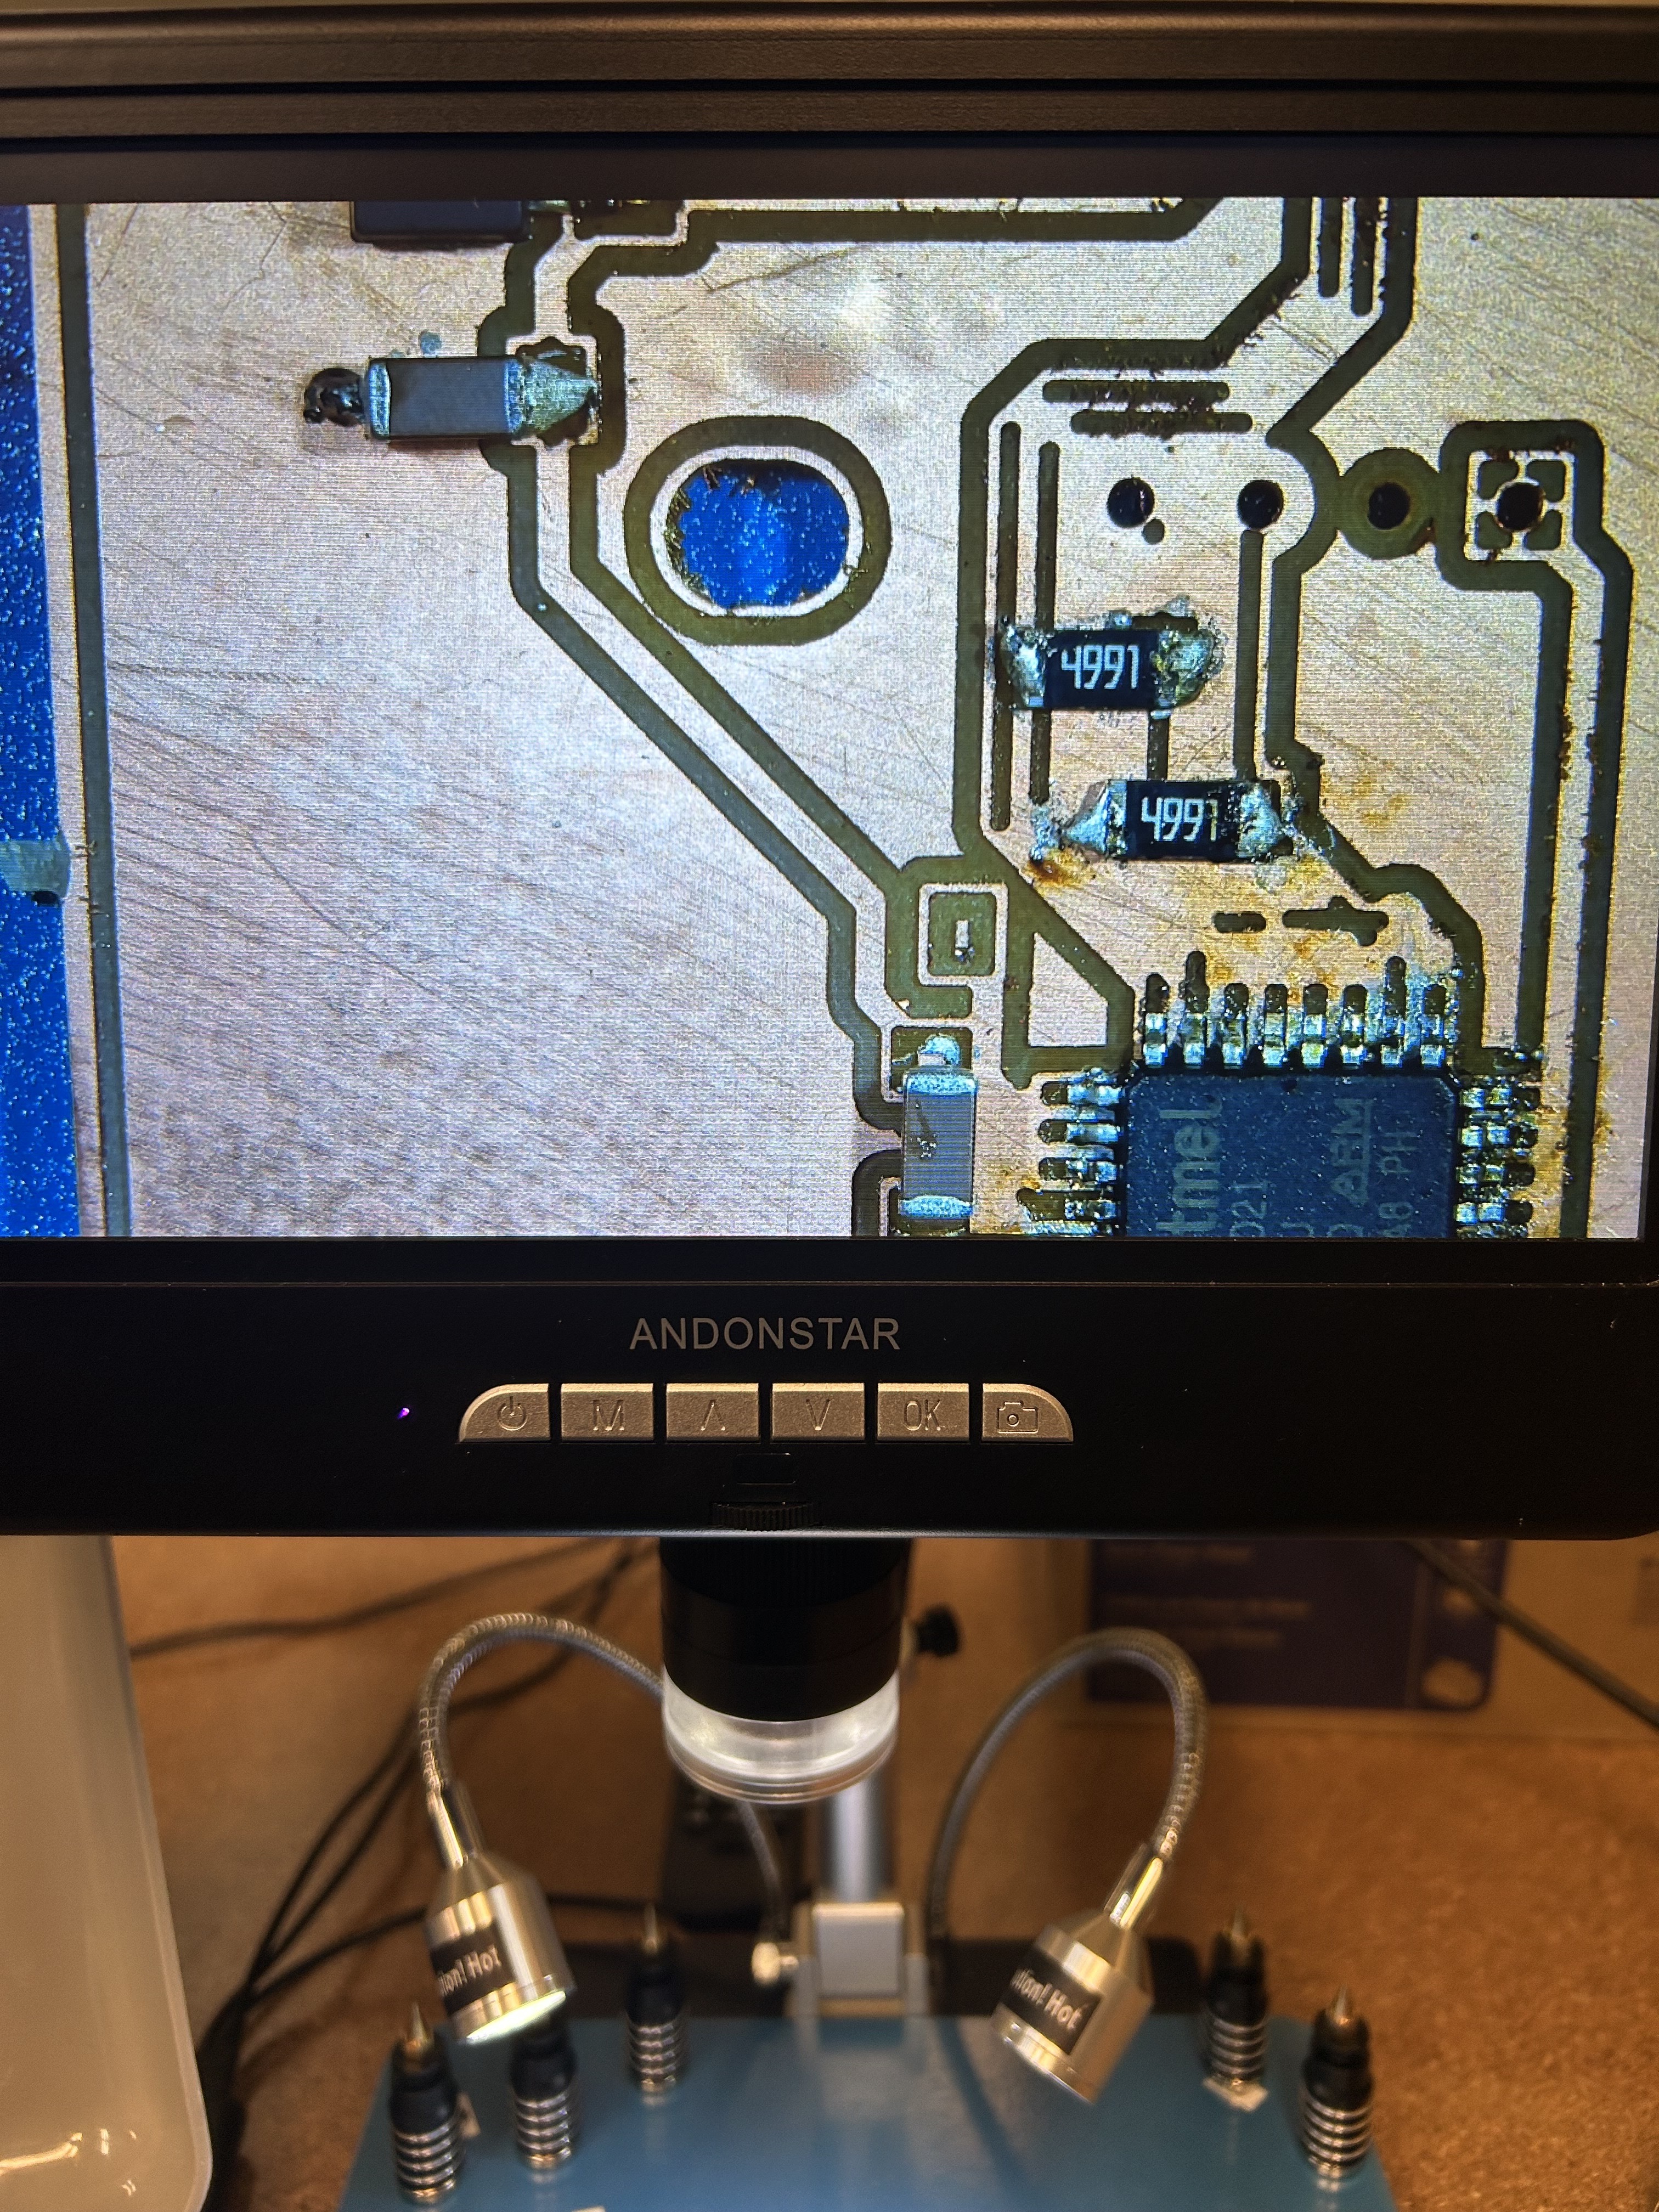
Final soldering result after multiple attempts, showing the completed PCB with all components properly placed and soldered
Reflection
This week focused on working with output devices, specifically creating a display screen for my digital nose project. The assignment demonstrated how output devices can be integrated into custom PCBs and how their visual signals can be controlled by microcontrollers to display information.
Working with output devices introduced me to the challenges of PCB fabrication and soldering, particularly with paste application. Even though I followed Quentin's tutorial steps carefully and edited my PCB design directly from it, I still faced difficulties during the soldering process. Multiple attempts taught me that precision and patience are essential when working with surface mount components and solder paste.
The most significant learning was understanding how output devices complete the feedback loop in interactive systems. The display screen transforms the abstract sensor data from the LIG array into visible information that users can understand and interact with. This transforms the digital nose from a sensing system into a complete interactive device.
Following Quentin's tutorial provided a solid foundation for understanding PCB design workflows, but the hands-on experience of fabrication and soldering revealed the practical challenges that can arise even when following instructions carefully. Each attempt at soldering improved my technique, though paste application remains an area for further practice.
The integration of the display output device with the LIG sensor input array creates a complete input-output system for the digital nose project. The display can show scent detection results in real-time, making the system interactive and informative. The Genji-ko pattern visualization connects the output device with the cultural design theme, bridging traditional Japanese aesthetics with modern digital output technology.
This week's work emphasized the importance of output devices in creating interactive systems. Without the display, the sensor data would remain invisible and inaccessible. The output device makes the digital nose functional as an interactive tool that users can see and understand, completing the bridge between traditional incense rituals and modern sensing technology.
Note: This assignment documentation website was created with assistance from Cursor AI.
Note: This assignment documentation website was created with assistance from Cursor AI.
Attachments
Links