Week 12: Networking
Part I: Designing an air quality monitoring device
I wanted to device to measure the air quality (gas, CO2, temperature, humidity, VOC) in my apartment. I did some research and found several sensors that would be a good fit: ENS160+AHT21 air sensor, MLX90614 IR temperature sensor, and MQ-2 gas sensor. Both the ENS160 and MLX90614 can use SPI for communication while the MQ series are analog sensors. Drawing inspiration from projects like this, I wanted the readings to be served on a web browser through WiFi. Since the ESP32S3 comes with built-in WiFi capabilities, this should be straightforward. The MIT network is WPA2-Enterprise requiring indidivual authentication. A cursory search seemed like this would be complicated to configure on ESP32 than WPA2-PSK. Fortunately, MIT provides a way to provision temporary pre-shared key accounts through this MIT WiFi portal. After that is setup, then the generated username and password can be connected to the WiFI network "MIT".
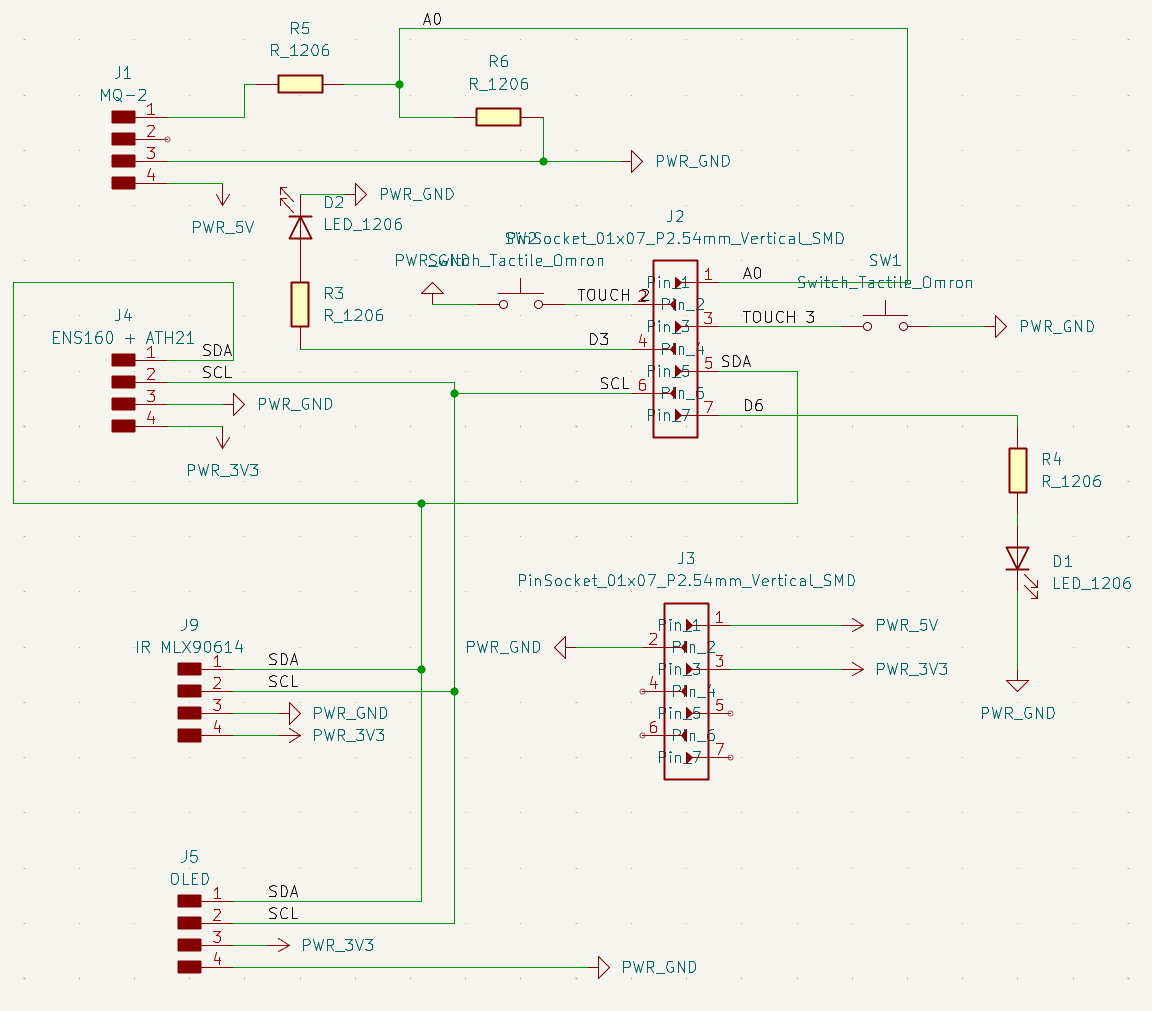
The PCB design was straightforward, the only complication was that the MQ-2 requires 5V but the XIAO ESP32S3 analog input pins only accept 3.3V, so a voltage divider with 5K and 10K resistors is needed to step down the voltage. Other than that, I also decided to try touch capacitance for left/right buttons to change between screen states. For V2 of the board, I increased 5v power rail width from 0.6mm to 0.8mm and increased width near pin headers to provide more protection from the traces ripping out. I also slightly decreased the board size. In the first iteration of the PCB, I had some issues with the touch sensors so I decided to switch back to tactile switch buttons. Here are the final KiCAD files.
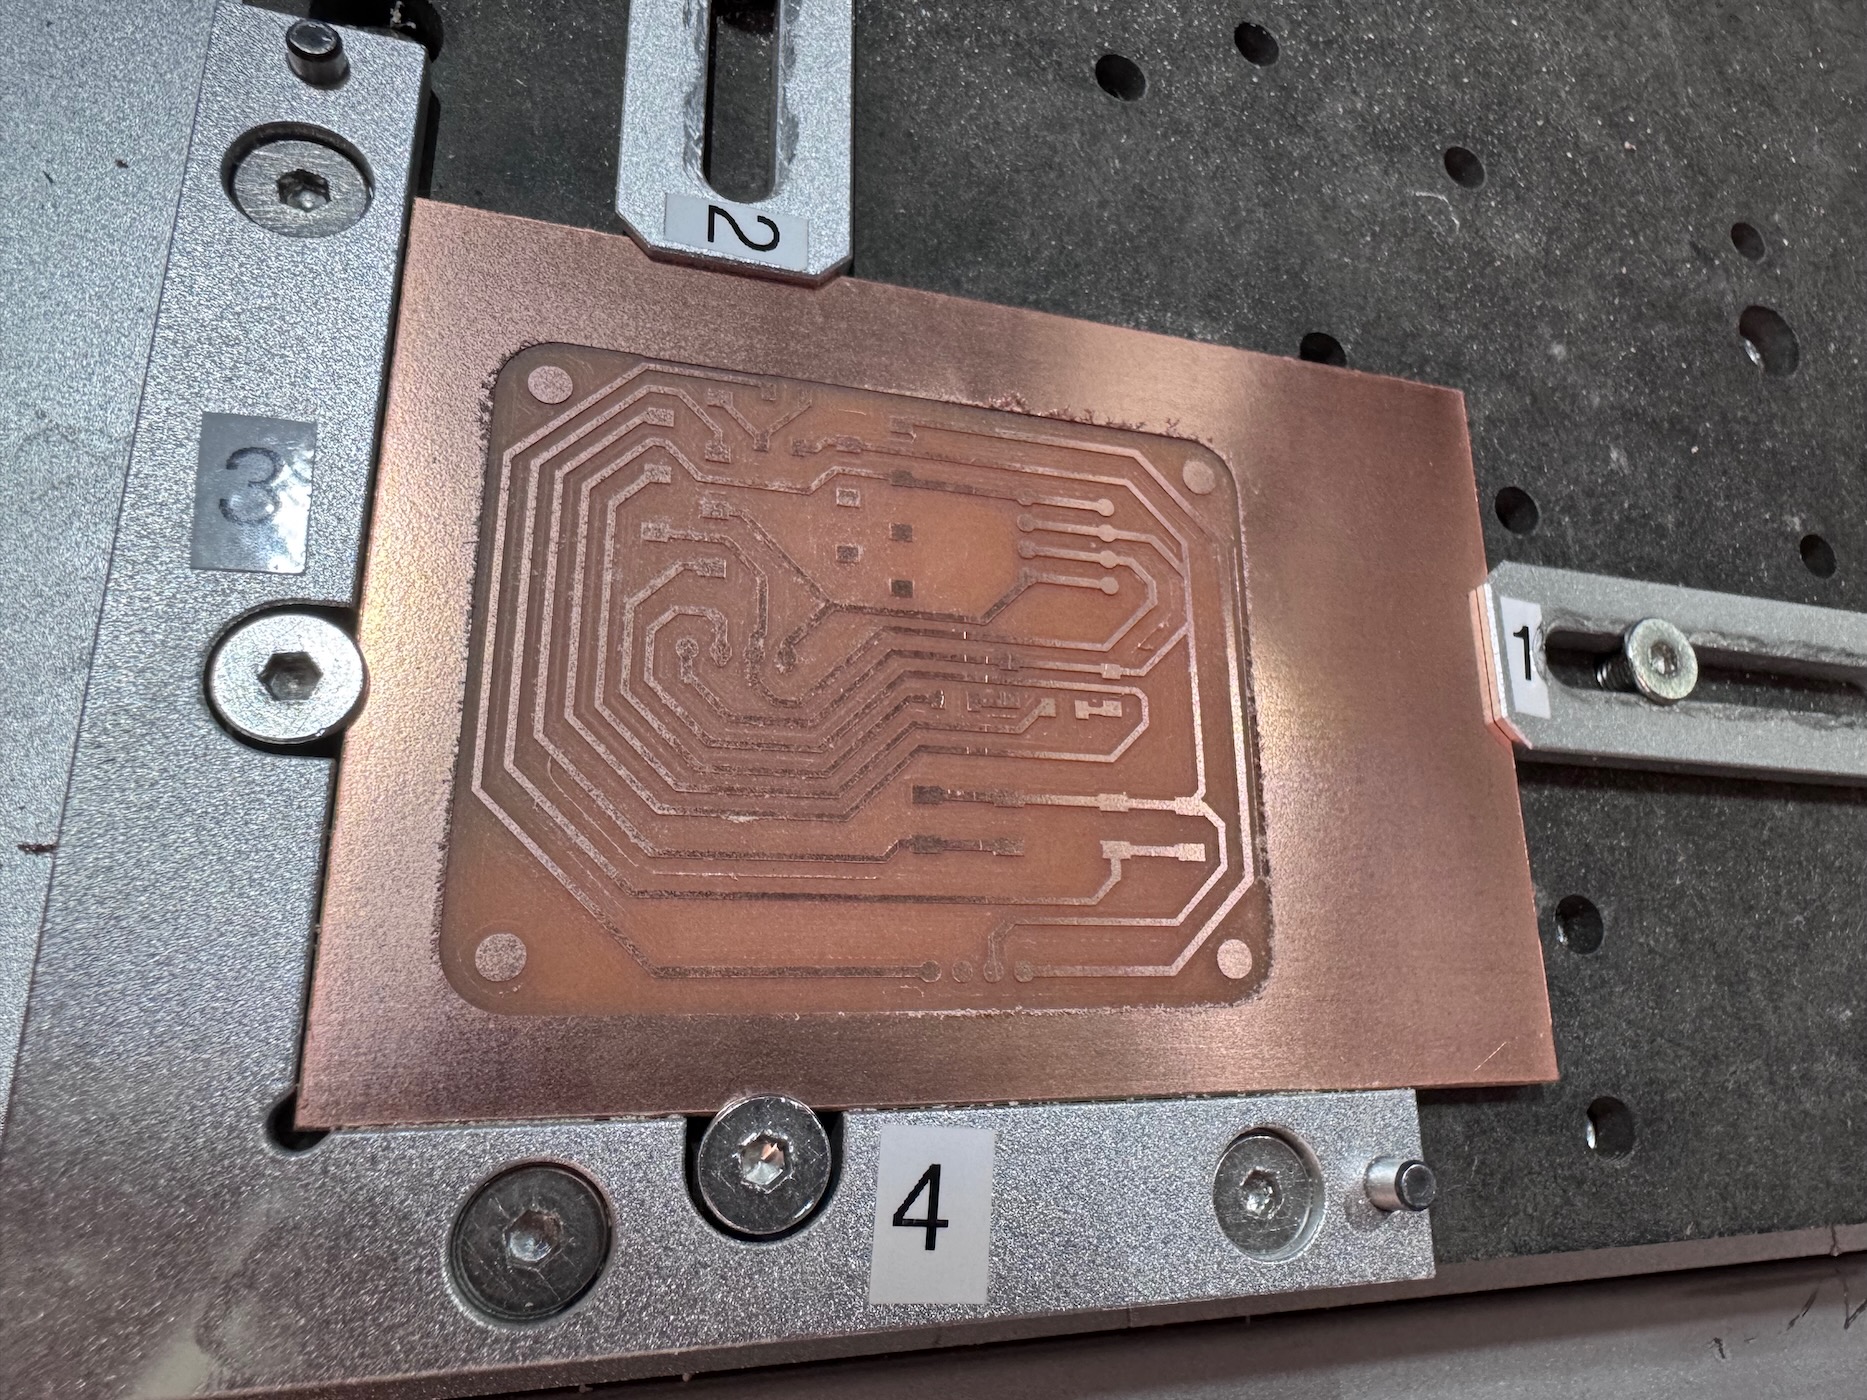
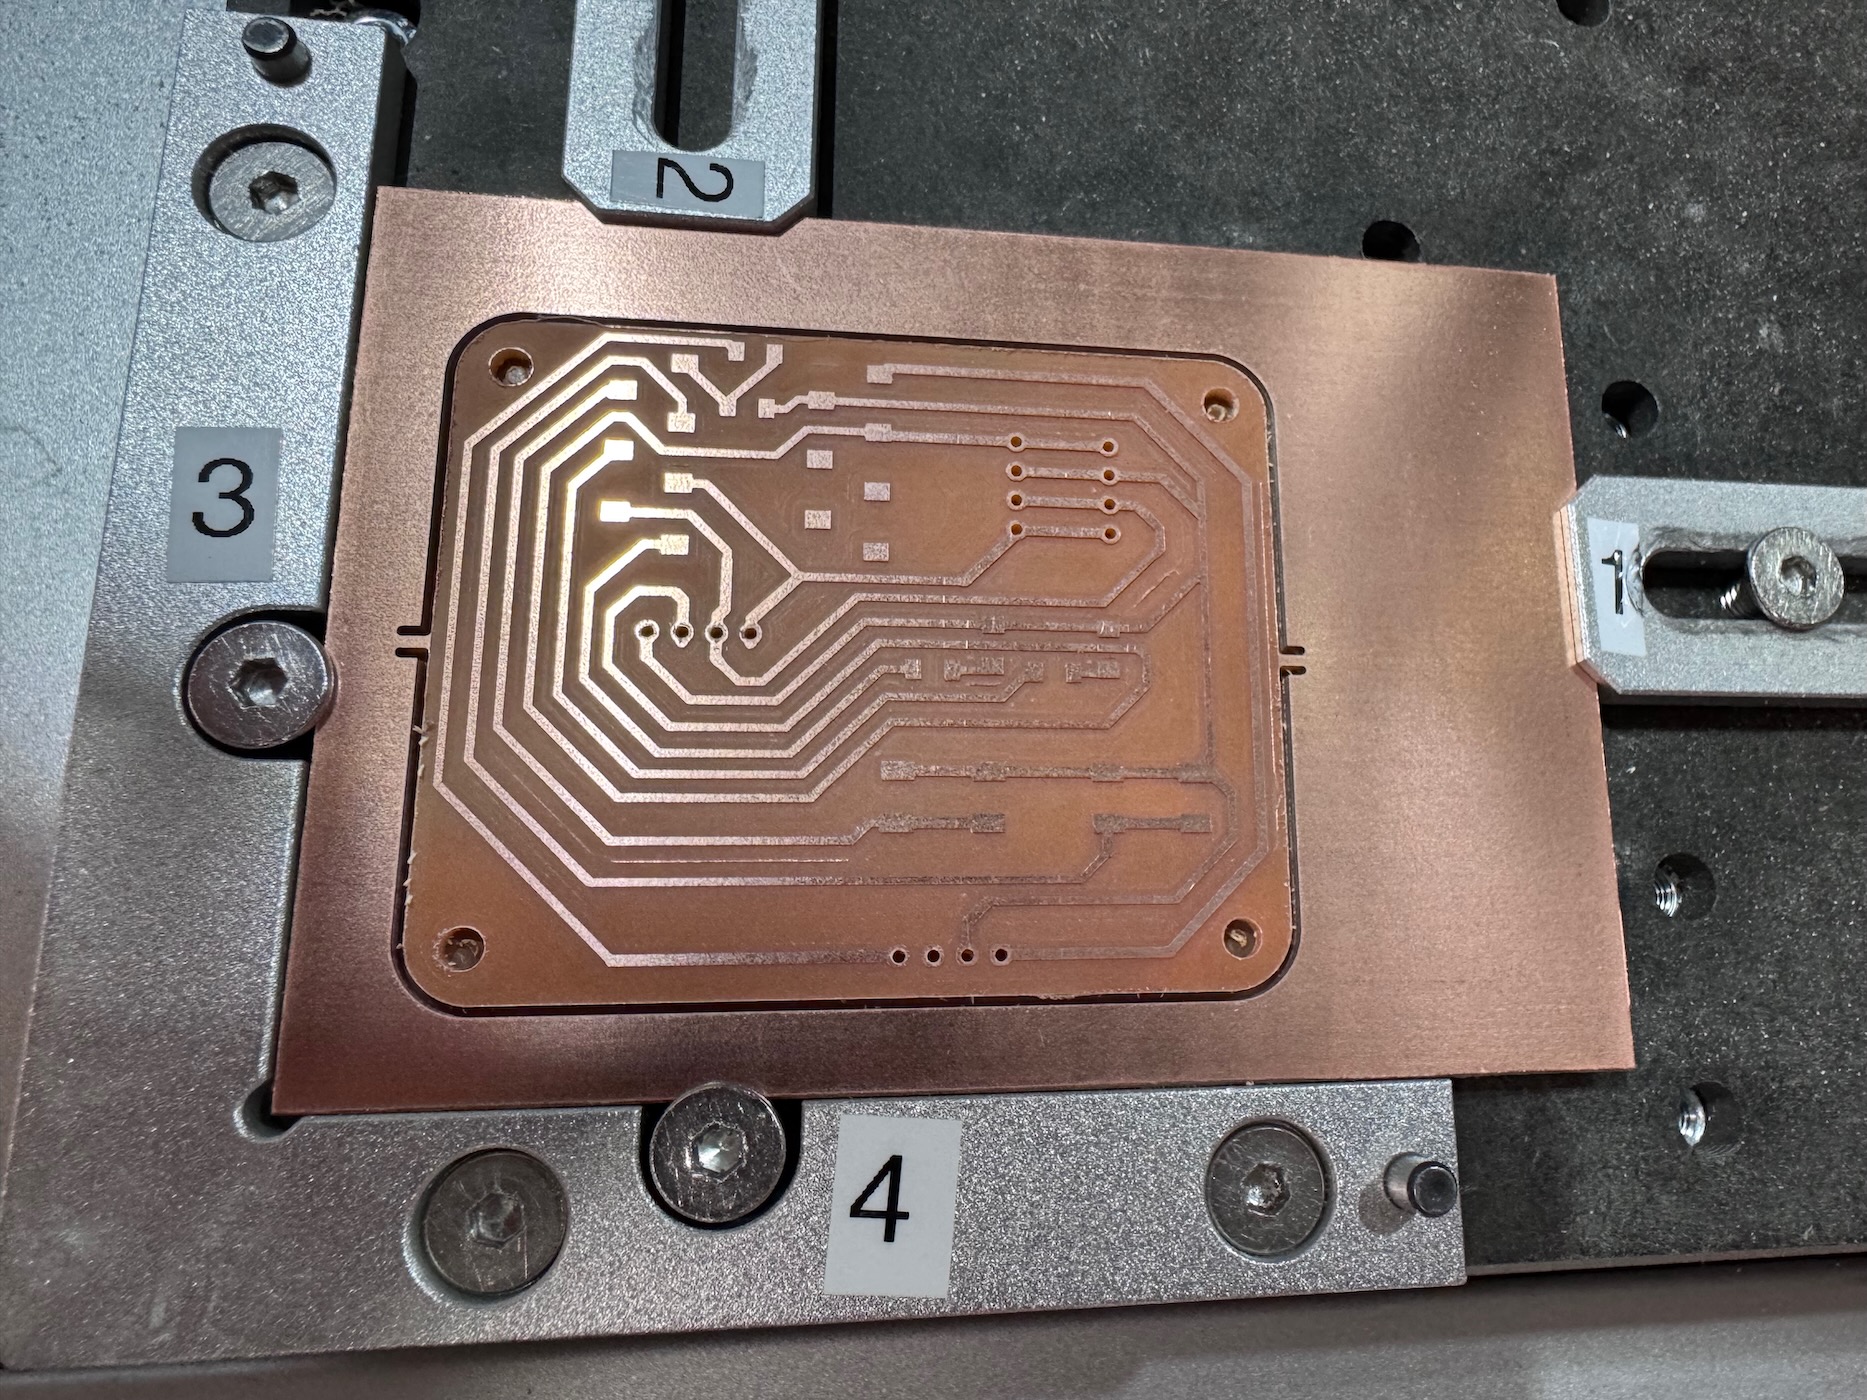
I used Mods CE, Gerber2img, and the Carvera milling machine to manufacture the PCB. On the second iteration of the board, I had an issue with not making the edge cuts or vias. This was strange since the first iteration milled correctly and I only made minor changes to the KiCAD design (changing trace width and board size). I couldn't find an issue in Mods CE. I tried producing the NC file on another computer, which seemed to work. I edited the G-code to skip milling the traces and skip directly to the edge cuts by searching for the tool change command "T3 M06" and only keeping the last tool path which contained depth cuts of Z-1.75.
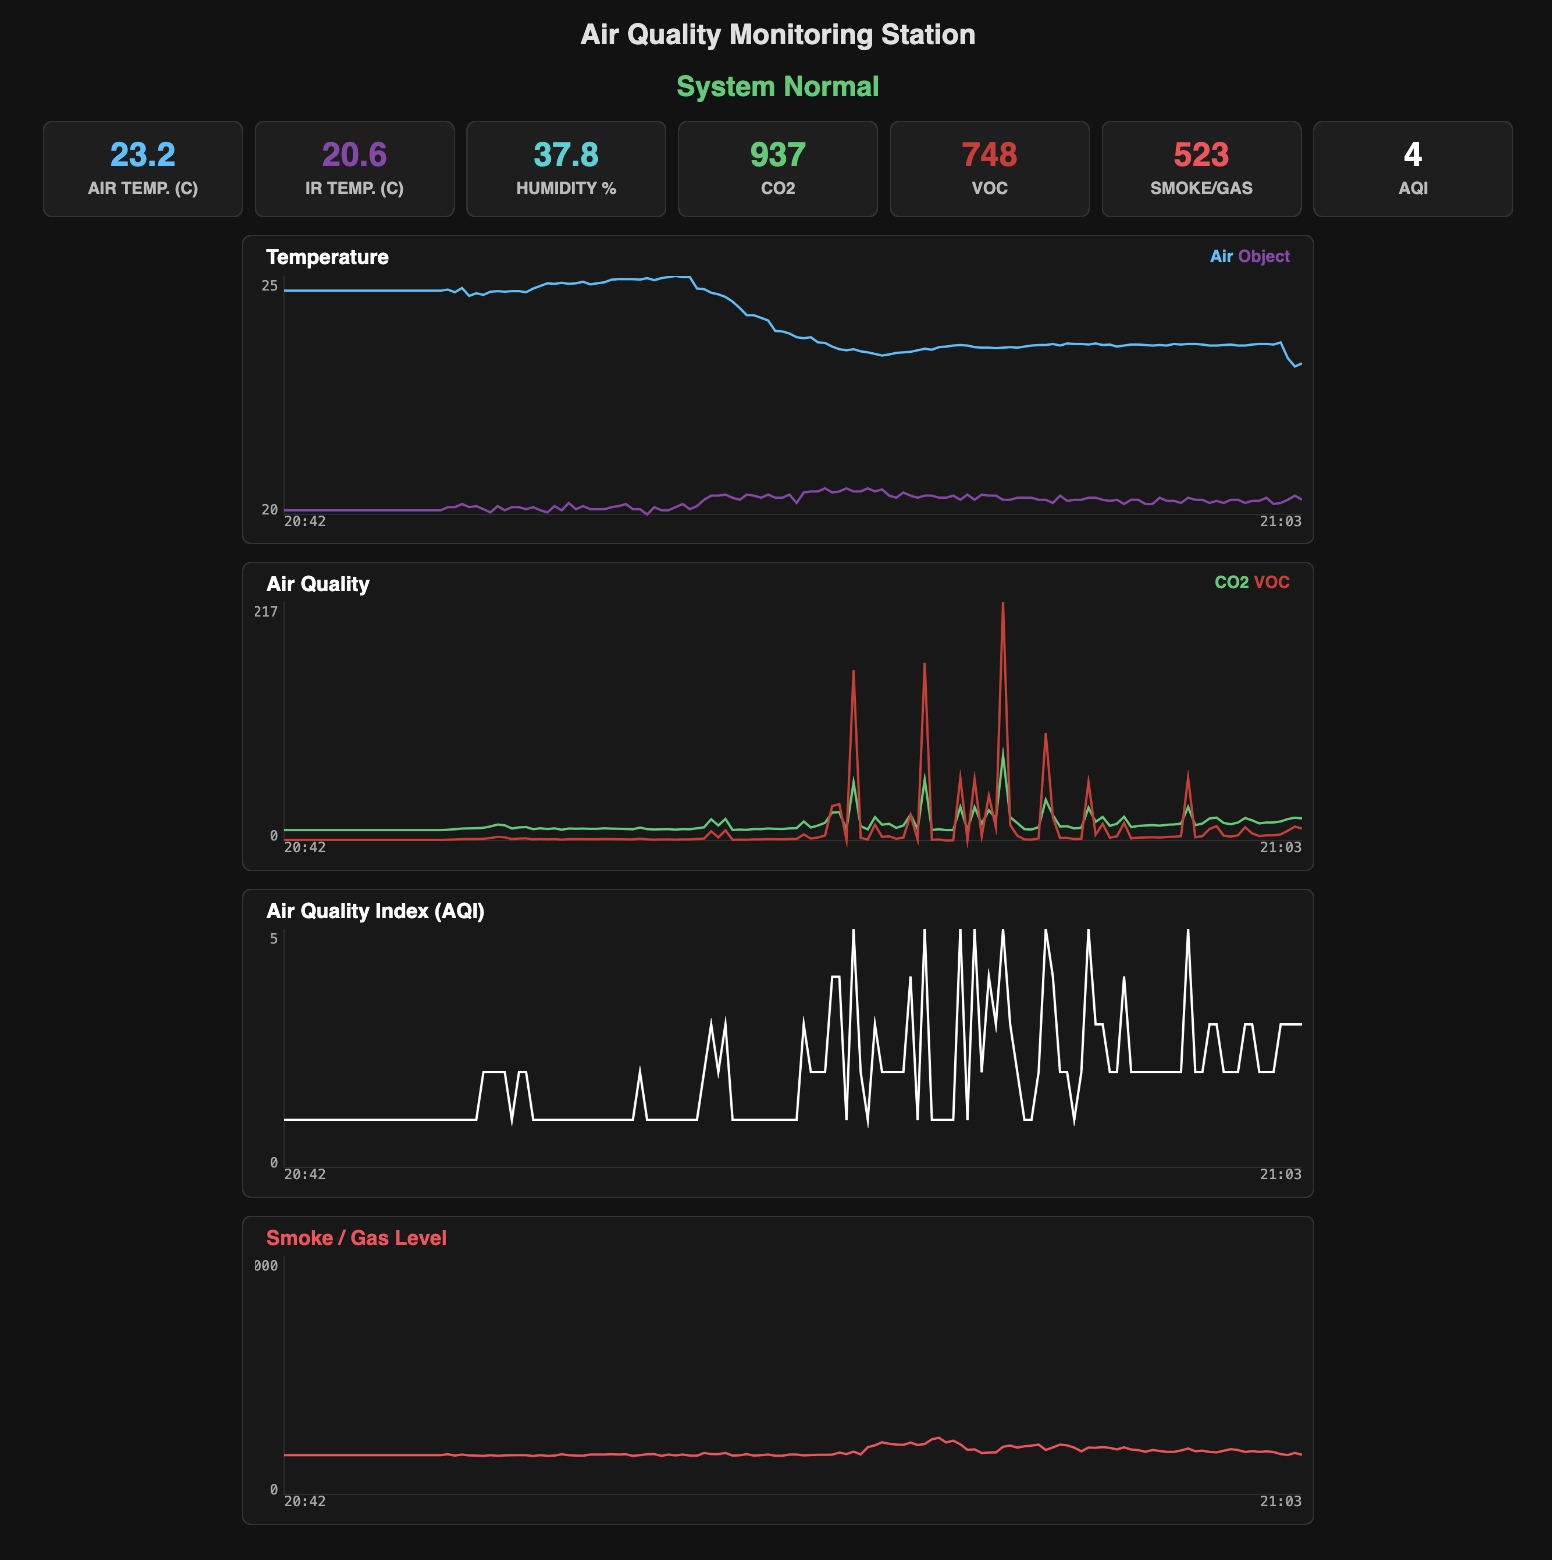
I used Gemini to help program the web UI interface of the web server and debug embedded programming. At first, I tried using ChartJS but kept getting syntax errors so switched to plain Javascript to draw the charts in the browser. Instead, it uses HTML canvas tags to draw the graphics. The ESP32 sends the sensor data as JSON array to the browser and uses javascript to normalize and draw the lines for each point on the canvas. The chart and sensor readings updates every 10 minutes and keeps track of the last 24 hours.
On the OLED display, there are three screens, which can be switched by the left/right buttons. A systems screen showing local time, local IP address, and current air quality status. On the second screen is readings from the ENS160 and AHT21 sensor. The third screen has readings from the IR and MQ-2 sensors. I keep the green LED on for normal air quality and flash the red LED when any of the air quality readings exceed a specified threshold.
code
#include <WiFi.h>
#include <WebServer.h>
#include <Wire.h>
#include <Adafruit_GFX.h>
#include <Adafruit_SSD1306.h>
#include <Adafruit_MLX90614.h>
#include <ScioSense_ENS160.h>
#include <Adafruit_AHTX0.h>
#include <time.h>

// --- CONFIGURATION ---
const char* ssid     = "MIT";
const char* pass     = "PASSWORD";

#define TIME_OFFSET  -18000
#define DST_OFFSET   3600

// --- PINOUT ---
#define MQ2_PIN       A0
#define BTN_LEFT      D1
#define BTN_RIGHT     D2
#define GREEN_LED     D3
#define RED_LED       D6

// THRESHOLDS
const int CO2_LIMIT = 1000;
const int MQ2_LIMIT = 2200;

WebServer server(80);
Adafruit_SSD1306 display(128, 64, &Wire, -1);

// SENSORS
Adafruit_MLX90614 mlx = Adafruit_MLX90614();
Adafruit_AHTX0 aht;
ScioSense_ENS160 ens160(ENS160_I2CADDR_1);

// GLOBAL DATA
float cur_temp = 0;
float cur_humid = 0;
float cur_obj_temp = 0;
int   cur_co2 = 0;
int   cur_aqi = 0;
int   cur_tvoc = 0;
int   cur_mq2 = 0;

// HISTORY
const int HIST_LEN = 180;
const unsigned long HISTORY_INTERVAL = 60000; // 1 Minute

float h_TEMP[HIST_LEN];
float h_OBJ[HIST_LEN];
float h_HUM[HIST_LEN];
int16_t h_CO2[HIST_LEN];
int16_t h_VOC[HIST_LEN];
int16_t h_AQI[HIST_LEN];
int16_t h_MQ2[HIST_LEN];
String h_TIME[HIST_LEN];

int current_screen = 0;
bool alarm_active = false;

// Timers
unsigned long now_ms = 0;
unsigned long t_sample = 0;
unsigned long t_history = 0;
unsigned long t_btn = 0;

// --- OLED SCROLLING HELPER (FIXED) ---
void drawScrollingText(String text, int y, int size) {
  display.setTextSize(size);

  // FIX: Disable text wrap so long lines don't drop down
  display.setTextWrap(false);

  int charWidth = 6 * size;
  int textPixelWidth = text.length() * charWidth;
  int screenWidth = 128;

  if (textPixelWidth <= screenWidth) {
    // Center it if it fits
    display.setCursor((screenWidth - textPixelWidth) / 2, y);
    display.print(text);
  } else {
    // Scroll it (Ticker Tape style)
    // Speed: 1 pixel every 30ms
    int scrollPos = (millis() / 30) % (textPixelWidth + 60);
    int x = screenWidth - scrollPos;
    display.setCursor(x, y);
    display.print(text);
  }

  // Re-enable wrap for other functions
  display.setTextWrap(true);
}

// --- TIME HELPER ---
String getLocalTimeStr(bool showSeconds) {
  struct tm timeinfo;
  if(!getLocalTime(&timeinfo)) return showSeconds ? "--:--:--" : "--:--";
  char buff[20];
  if (showSeconds) strftime(buff, sizeof(buff), "%H:%M:%S", &timeinfo);
  else strftime(buff, sizeof(buff), "%H:%M", &timeinfo);
  return String(buff);
}

// --- WEB PAGE ---
const char index_html[] PROGMEM = R"rawliteral(
<!DOCTYPE HTML>
<html>
<head>
  <meta name="viewport" content="width=device-width, initial-scale=1, maximum-scale=1, user-scalable=0">
  <title>Air Monitor</title>
  <style>
    body { font-family: -apple-system, sans-serif; background: #121212; color: #eee; text-align: center; margin: 0; padding: 10px; padding-bottom: 60px; }
    .dashboard { display: flex; flex-wrap: wrap; justify-content: center; gap: 8px; margin-bottom: 20px; }
    .card { background: #1e1e1e; padding: 15px; border-radius: 12px; border: 1px solid #333; flex: 1 1 140px; max-width: 48%; }
    .val { font-size: 2rem; font-weight: 800; color: #fff; line-height: 1; }
    .lbl { font-size: 0.8rem; color: #aaa; margin-top: 5px; font-weight: 600; text-transform: uppercase; }
    #status { font-size: 1.2rem; margin-bottom: 15px; font-weight: bold; padding: 10px; border-radius: 8px; }
    .status-ok { background: rgba(46, 204, 113, 0.2); color: #2ecc71; border: 1px solid #2ecc71; }
    .status-alert { background: rgba(255, 68, 68, 0.2); color: #ff4444; border: 1px solid #ff4444; animation: blink 1s infinite; }
    @keyframes blink { 50% { opacity: 0.5; } }
    .graph-wrapper { background: #181818; margin: 15px auto; width: 100%; max-width: 800px; border: 1px solid #333; border-radius: 12px; padding: 10px; box-sizing: border-box; }
    canvas { width: 100%; height: 250px; display: block; }
    .g-header { display: flex; justify-content: space-between; padding: 0 5px; margin-bottom: 5px; }
    .g-title { font-weight: bold; font-size: 1rem; color: #eee; }
    .legend { font-size: 0.8rem; font-weight: bold; }
    @media (max-width: 600px) { .card { flex: 1 1 100%; max-width: 100%; } .val { font-size: 2.5rem; } canvas { height: 200px; } }
  </style>
</head>
<body>
  <h2>Air Monitor (3H)</h2>
  <div id="status" class="status-ok">System Normal</div>

  <div class="dashboard">
    <div class="card"><div class="val" id="t" style="color:#33c1ff">--</div><div class="lbl">Air Temp</div></div>
    <div class="card"><div class="val" id="mt" style="color:#8e44ad">--</div><div class="lbl">Obj Temp</div></div>
    <div class="card"><div class="val" id="h" style="color:#00d2d3">--</div><div class="lbl">Humidity</div></div>
    <div class="card"><div class="val" id="c" style="color:#2ecc71">--</div><div class="lbl">CO2</div></div>
    <div class="card"><div class="val" id="v" style="color:#d63031">--</div><div class="lbl">VOC</div></div>
    <div class="card"><div class="val" id="m" style="color:#ff4757">--</div><div class="lbl">Smoke</div></div>
    <div class="card"><div class="val" id="a" style="color:#ffffff">--</div><div class="lbl">AQI</div></div>
  </div>

  <div class="graph-wrapper">
    <div class="g-header"><div class="g-title">Temperature</div><div class="legend"><span style="color:#33c1ff">Air</span> <span style="color:#8e44ad">Obj</span></div></div>
    <canvas id="cvs_temp"></canvas>
  </div>
  <div class="graph-wrapper">
    <div class="g-header"><div class="g-title">Air Quality</div><div class="legend"><span style="color:#2ecc71">CO2</span> <span style="color:#d63031">VOC</span></div></div>
    <canvas id="cvs_air"></canvas>
  </div>
  <div class="graph-wrapper">
    <div class="g-header"><div class="g-title" style="color:#fff">AQI (1-5)</div></div>
    <canvas id="cvs_aqi"></canvas>
  </div>
  <div class="graph-wrapper">
    <div class="g-header"><div class="g-title" style="color:#ff4757">Smoke Level</div></div>
    <canvas id="cvs_mq2"></canvas>
  </div>

<script>
  function setupCanvas(id) {
    const cvs = document.getElementById(id);
    const ctx = cvs.getContext('2d');
    const rect = cvs.getBoundingClientRect();
    cvs.width = rect.width * 2; cvs.height = rect.height * 2;
    return { cvs, ctx };
  }
  window.addEventListener('resize', () => window.location.reload());

  const g_temp = setupCanvas('cvs_temp');
  const g_air = setupCanvas('cvs_air');
  const g_aqi = setupCanvas('cvs_aqi');
  const g_mq2 = setupCanvas('cvs_mq2');

  function drawMultiGraph(obj, dataSets, timeArr, fixedMin=null, fixedMax=null) {
    const ctx = obj.ctx; const w = obj.cvs.width; const h = obj.cvs.height;
    const padL = 60; const padB = 40;

    ctx.clearRect(0, 0, w, h);

    let min = Infinity, max = -Infinity;
    if (fixedMin !== null) { min = fixedMin; max = fixedMax; }
    else {
      dataSets.forEach(ds => { ds.data.forEach(v => { if (v < min) min = v; if (v > max) max = v; }); });
      if (max <= min) { max = min + 5; min = min - 5; }
    }

    const range = max - min; const graphW = w - padL; const graphH = h - padB;

    ctx.strokeStyle = '#333'; ctx.lineWidth = 2;
    ctx.beginPath(); ctx.moveTo(padL, 0); ctx.lineTo(padL, graphH); ctx.stroke();
    ctx.beginPath(); ctx.moveTo(padL, graphH); ctx.lineTo(w, graphH); ctx.stroke();

    ctx.fillStyle = '#aaa'; ctx.font = 'bold 28px sans-serif'; ctx.textAlign = "right";
    ctx.fillText(max.toFixed(0), padL - 10, 30);
    ctx.fillText(min.toFixed(0), padL - 10, graphH);

    ctx.textAlign = "left"; if(timeArr.length > 0) ctx.fillText(timeArr[0], padL, h-10);
    ctx.textAlign = "right"; if(timeArr.length > 0) ctx.fillText(timeArr[timeArr.length-1], w, h-10);

    const stepX = graphW / (dataSets[0].data.length - 1 || 1);
    dataSets.forEach(ds => {
      ctx.beginPath(); ctx.strokeStyle = ds.color; ctx.lineWidth = 6;
      ds.data.forEach((val, i) => {
        let norm = (val - min) / range;
        let x = padL + (i * stepX);
        let y = graphH - (norm * graphH);
        if (i === 0) ctx.moveTo(x, y); else ctx.lineTo(x, y);
      });
      ctx.stroke();
    });
  }

  function fetchHistory() {
    let nocache = "&t=" + Date.now();
    fetch('/history?'+nocache).then(r => r.json()).then(d => {
      drawMultiGraph(g_temp, [{ data: d.h_temp, color: '#33c1ff' }, { data: d.h_obj, color: '#8e44ad' }], d.h_time);
      drawMultiGraph(g_air, [{ data: d.h_co2, color: '#2ecc71' }, { data: d.h_voc, color: '#d63031' }], d.h_time);
      drawMultiGraph(g_aqi, [{ data: d.h_aqi, color: '#fff' }], d.h_time, 0, 5);
      drawMultiGraph(g_mq2, [{ data: d.h_mq2, color: '#ff4757' }], d.h_time, 0, 3000);
    });
  }

  function fetchLive() {
    fetch('/live').then(r => r.json()).then(d => {
      document.getElementById('t').innerText = d.t.toFixed(1);
      document.getElementById('mt').innerText = d.mt.toFixed(1);
      document.getElementById('h').innerText = d.h.toFixed(1);
      document.getElementById('c').innerText = d.c;
      document.getElementById('v').innerText = d.v;
      document.getElementById('m').innerText = d.m;
      document.getElementById('a').innerText = d.a;
      let st = document.getElementById('status');
      if(d.al) { st.innerText = "!! ALARM !!"; st.className = "status-alert"; }
      else { st.innerText = "System Normal"; st.className = "status-ok"; }
    });
  }

  setInterval(fetchLive, 2000);
  fetchHistory();
  setInterval(fetchHistory, 30000); // Update graph every 30s
</script>
</body></html>
)rawliteral";

// --- HANDLERS ---
void handleRoot() { server.send(200, "text/html", index_html); }

void handleLive() {
  String json = "{";
  json += "\"t\":" + String(cur_temp) + ",";
  json += "\"mt\":" + String(cur_obj_temp) + ",";
  json += "\"h\":" + String(cur_humid) + ",";
  json += "\"c\":" + String(cur_co2) + ",";
  json += "\"v\":" + String(cur_tvoc) + ",";
  json += "\"m\":" + String(cur_mq2) + ",";
  json += "\"a\":" + String(cur_aqi) + ",";
  json += "\"al\":" + String(alarm_active);
  json += "}";
  server.send(200, "application/json", json);
}

void handleHistory() {
  String json;
  json.reserve(20000);
  json = "{";
  auto addArr = [&](String name, auto* arr, bool isFloat) {
      json += "\"" + name + "\":[";
      for(int i=0; i<HIST_LEN; i++) {
         if(isFloat) json += String(arr[i]);
         else json += String((int)arr[i]);
         if(i<HIST_LEN-1) json += ",";
      }
      json += "],";
  };

  addArr("h_temp", h_TEMP, true);
  addArr("h_obj", h_OBJ, true);
  addArr("h_co2", h_CO2, false);
  addArr("h_voc", h_VOC, false);
  addArr("h_aqi", h_AQI, false);
  addArr("h_mq2", h_MQ2, false);

  json += "\"h_time\":[";
  for(int i=0; i<HIST_LEN; i++) {
      json += "\"" + h_TIME[i] + "\"";
      if(i<HIST_LEN-1) json += ",";
  }
  json += "]";
  json += "}";
  server.send(200, "application/json", json);
}

void setup() {
  Serial.begin(115200);
  WiFi.setSleep(false);

  pinMode(MQ2_PIN, INPUT);
  pinMode(BTN_LEFT, INPUT_PULLUP);
  pinMode(BTN_RIGHT, INPUT_PULLUP);

  pinMode(RED_LED, OUTPUT);
  pinMode(GREEN_LED, OUTPUT);
  digitalWrite(RED_LED, HIGH);
  digitalWrite(GREEN_LED, HIGH);

  Wire.begin(D4, D5);
  Wire.setClock(100000);
  display.begin(SSD1306_SWITCHCAPVCC, 0x3C);
  display.setTextColor(SSD1306_WHITE);

  display.clearDisplay();
  display.setCursor(0,0); display.println("Connecting..."); display.display();
  WiFi.begin(ssid, pass);
  while (WiFi.status() != WL_CONNECTED) { delay(500); }

  configTime(TIME_OFFSET, DST_OFFSET, "pool.ntp.org");

  if (!ens160.begin()) { Serial.println("ENS Fail"); }
  ens160.setMode(ENS160_OPMODE_STD);
  aht.begin();
  mlx.begin();

  delay(1000);
  sensors_event_t h, t; aht.getEvent(&h, &t);
  ens160.set_envdata(t.temperature, h.relative_humidity);
  ens160.measure(true); ens160.measureRaw(true);

  float t_init = t.temperature;
  float h_init = h.relative_humidity;
  float obj_init = mlx.readObjectTempC();
  int c_init = ens160.geteCO2();
  int v_init = ens160.getTVOC();
  int m_init = analogRead(MQ2_PIN);
  String time_init = getLocalTimeStr(false);

  for(int i=0; i<HIST_LEN; i++) {
    h_TEMP[i] = t_init; h_OBJ[i] = obj_init; h_HUM[i] = h_init;
    h_CO2[i] = c_init; h_VOC[i] = v_init; h_MQ2[i] = m_init; h_AQI[i] = 1;
    h_TIME[i] = time_init;
  }

  server.on("/", handleRoot);
  server.on("/live", handleLive);
  server.on("/history", handleHistory);
  server.begin();

  display.clearDisplay();
  display.setCursor(0,0); display.println("System Ready"); display.display();
}

void loop() {
  server.handleClient();
  now_ms = millis();

  // 1. SENSOR READ
  if (now_ms - t_sample > 2000) {
    t_sample = now_ms;

    sensors_event_t h, t;
    aht.getEvent(&h, &t);
    cur_temp = t.temperature;
    cur_humid = h.relative_humidity;

    ens160.set_envdata(cur_temp, cur_humid);
    ens160.measure(true);
    ens160.measureRaw(true);

    cur_co2 = ens160.geteCO2();
    cur_aqi = ens160.getAQI();
    cur_tvoc = ens160.getTVOC();

    cur_obj_temp = mlx.readObjectTempC();
    cur_mq2 = analogRead(MQ2_PIN);

    if(cur_co2 == 0 && cur_tvoc == 0) ens160.setMode(ENS160_OPMODE_STD);

    if(cur_co2 > CO2_LIMIT || cur_mq2 > MQ2_LIMIT) alarm_active = true;
    else alarm_active = false;
  }

  // 2. HISTORY UPDATE
  if (now_ms - t_history > HISTORY_INTERVAL) {
    t_history = now_ms;
    for(int i=0; i<HIST_LEN-1; i++) {
       h_CO2[i] = h_CO2[i+1]; h_MQ2[i] = h_MQ2[i+1]; h_TEMP[i] = h_TEMP[i+1];
       h_OBJ[i] = h_OBJ[i+1]; h_HUM[i] = h_HUM[i+1]; h_VOC[i] = h_VOC[i+1];
       h_AQI[i] = h_AQI[i+1]; h_TIME[i] = h_TIME[i+1];
    }
    h_CO2[HIST_LEN-1] = cur_co2;
    h_VOC[HIST_LEN-1] = cur_tvoc;
    h_AQI[HIST_LEN-1] = cur_aqi;
    h_MQ2[HIST_LEN-1] = cur_mq2;
    h_TEMP[HIST_LEN-1] = cur_temp;
    h_OBJ[HIST_LEN-1]  = cur_obj_temp;
    h_HUM[HIST_LEN-1]  = cur_humid;
    h_TIME[HIST_LEN-1] = getLocalTimeStr(false);
  }

  // 3. BUTTONS
  if (now_ms - t_btn > 250) {
    if (digitalRead(BTN_LEFT) == LOW) {
      current_screen--; if (current_screen < 0) current_screen = 3; t_btn = now_ms;
    }
    if (digitalRead(BTN_RIGHT) == LOW) {
      current_screen++; if (current_screen > 3) current_screen = 0; t_btn = now_ms;
    }
  }

  // 4. OLED DISPLAY LOGIC (SCROLLING + LARGE TEXT)
  display.clearDisplay();

  if (current_screen == 0) { // INFO
    display.setTextSize(2);
    display.setCursor(0, 0); display.println("SYS INFO");
    display.setTextSize(1);
    display.setCursor(0, 25); display.print("IP: ");
    drawScrollingText(WiFi.localIP().toString(), 25, 2); // Big Scroll IP

    display.setCursor(0, 50);
    if(alarm_active) {
       drawScrollingText("!! ALARM ACTIVE !!", 50, 2);
    } else {
       drawScrollingText("System Normal :)", 50, 1);
    }
  }
  else if (current_screen == 1) { // TEMP
    display.setTextSize(1); display.setCursor(0,0); display.print("TEMPERATURE (C)");
    display.setTextSize(3);
    display.setCursor(0, 20); display.print(cur_temp, 1);
    display.setTextSize(1); display.print(" Air");
    display.setCursor(0, 50); display.print("Obj: "); display.print(cur_obj_temp, 1);
  }
  else if (current_screen == 2) { // AIR QUAL
    display.setTextSize(1); display.setCursor(0,0); display.print("AIR QUALITY");
    display.setTextSize(2);
    display.setCursor(0, 15); display.printf("CO2: %d", cur_co2);
    display.setCursor(0, 35); display.printf("VOC: %d", cur_tvoc);
    display.setCursor(0, 55); display.printf("AQI: %d", cur_aqi);
  }
  else if (current_screen == 3) { // SAFETY
    display.setTextSize(1); display.setCursor(0,0); display.print("SMOKE LEVEL");
    display.setTextSize(3);
    display.setCursor(20, 25); display.print(cur_mq2);

    // Bar at bottom
    int bar = map(cur_mq2, 0, 4095, 0, 128);
    display.fillRect(0, 55, bar, 8, SSD1306_WHITE);
  }

  display.display();

  // 5. LED LOGIC
  if(alarm_active) {
    digitalWrite(GREEN_LED, LOW); // OFF
    if((now_ms / 250) % 2 == 0) digitalWrite(RED_LED, LOW); else digitalWrite(RED_LED, HIGH);
  } else {
    digitalWrite(RED_LED, LOW); // OFF
    digitalWrite(GREEN_LED, HIGH); // ON (Normal)
  }
}
Below is a video of the device detecting the alchohol in a sanitizing wipe, triggering an alarm state. Other examples of volatile organic compounds (VOC) include acetone, acetic acid (vinegars), ethanol, and formaldehyde. A "high level" of VOC is considered to be around 2000 parts per billion (ppb) and a safe level is below 400 ppb. Short-term health effects of VOC can include irritation and nausea while long term exposure can lead to increased cancer risks.
In a later iteration of this air quality measuring station, I wanted to send automatic emails or SMS when gas is detected or IR (pointed at oven) detects high temperatures. A camera and microphone could also be added to capture video and sound triggered by air quality events.
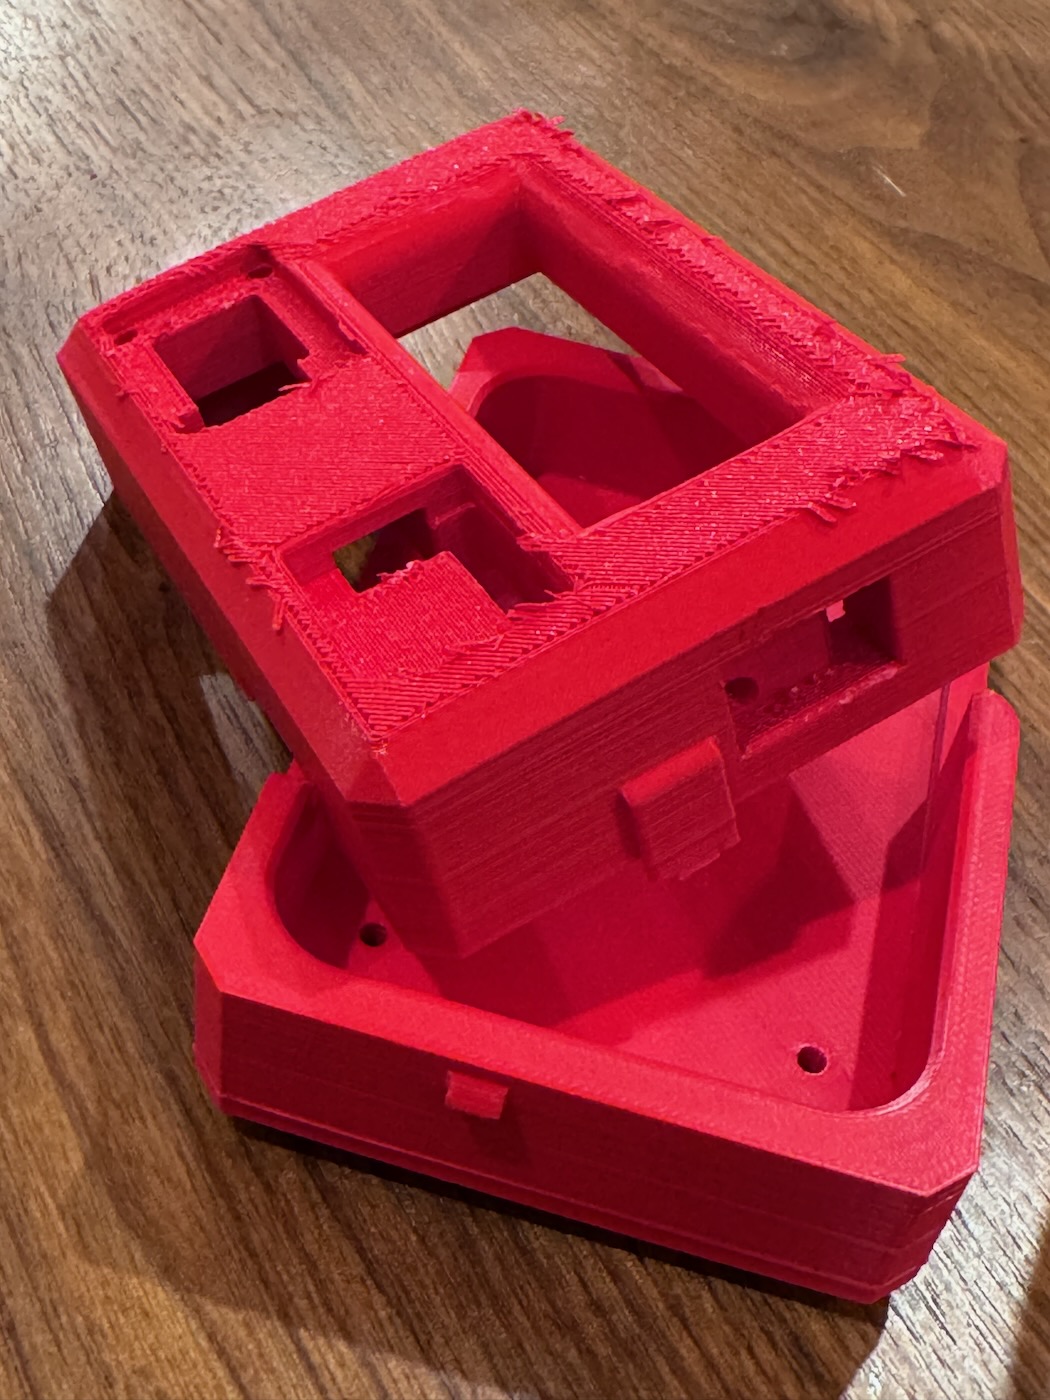
Part II: Making a 3D printed case
I also tried making a case to house the PCB and sensors using the Prusa MKS4 with PLA filament with 15% infill. The first iteration fit okay but I needed to slightly modify the sensor cutouts for the wires. The snap tabs were also too thin and broke off easily. For version 2, I made the tabs thicker and added alignment cutouts so the case would be registered even if the cutouts broke. I also sunk the PCB since I couldn't find any short M3 screws in the shop. The second print failed due to the nozzle becoming clogged and melting all the PLA onto the printer head. Here is the STEP file for the case.