Week 12
Networking week! In this week and next week (interface week) I will describe a project I worked on where I actually did both networking and interface design simultaneously. I built a physical device which uses two draw-wire encoders with both ends attached to encode each point of a line as the intersection of two circles with varying radii. I pipe sensor readings from Serial port to Python RPC to Websocket and finally to a static web UI which reinterprets this data back into the Cartesian plane, as a p5.js sketch. My interface allows one to (1) record and playback decoded gestures made from the physical instrument (2) interpolate between two gestures using the intersection-of-two-circles model.
A PORTAL, part 1
For my Drawing++ final project, I wanted to make use of my shiny new How To Make skills to create a kind of cyborg pantograph. This project is called Arbitrary PantOgRaph of Time And Light: A PORTAL for short.
For this week in particular, I will describe how I turned the readings from two draw wire encoders into (x, y) values which I was able to feed into a p5.js sketch on a static website via Serial -> Python RPC -> Websocket -> JS scripts.
Basically, how I made this (minus the interface, which I’ll discuss in my docs for next week):
Note that while I am describing the Networking here and Interface in the next week’s documentation, I actually worked on both of them in parallel in the name of spiral design. I’ll try to convey the interleaving of those timelines where it is relevant.
Visions of a brave new pantograph
A regular pantograph, dear reader, is a mechanical device which takes a physical gesture as input and outputs that same gesture, at a different scale.
In this week and the next I will build the first half of my vision for a cyborg pantograph – a device which encodes physical gesture into a digital representation (by reducing the information substantially), then decodes that digital representation back into the physical world, as a (scaled, distorted) version of the original gesture.
Conceptually, I am interested in how the symbolic / digital / unreal metabolizes and regurgitates (receives and influences) the real. Every day, countless times, I enter the metaverse and emerge again, changed. My body makes a mark in mathematical space and the mathematical space marks me back. I am interested in glitches and artifacts – the sum of all the tiny invisible hard boundaries inherent in the world of pixels and floating point precision. Too often, we forget about rasterization, and we believe in the illusion that the digital world is the same as the physical one. They are distinct. For one, I am not 4 inches tall. I am not speaking; you are staring at lights and hallucinating in your own voice. But I digress. As a cyborg myself, I am interested in making a pantograph with all the affordances us cyborgs have come to expect: data in a compressed format, programmability, infinite zoom. (I have completed my best attempt at this task in this project, across the Networking and Interface weeks.) As a cyborg myself, I want to subsequently bring these affordances back into the pesky, infinite-dimensional Real World where I can touch them again. (I will do this part next semester, stay tuned).
Hardware
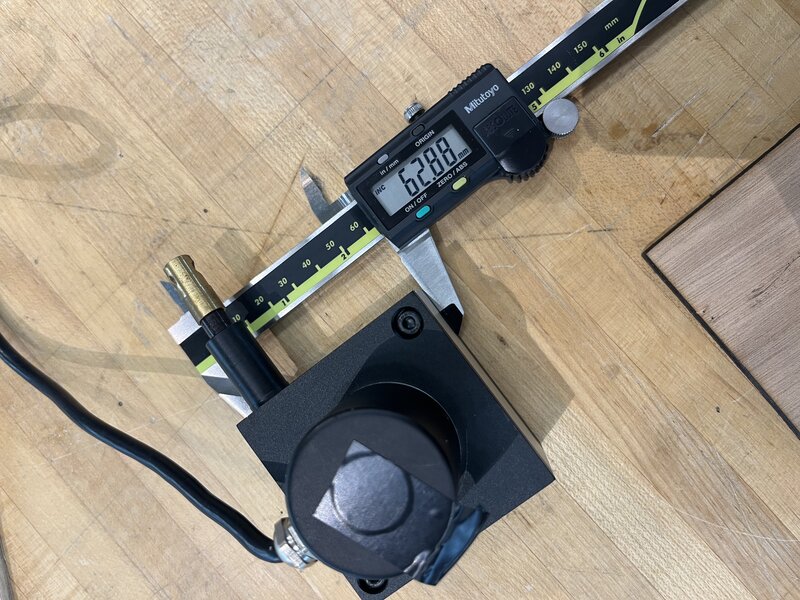
First, Ilan very kindly lent me a StepDance board and two draw-wire encoders (displacement sensors – basically, a rotary encoder sitting on top of a spool of fishing line). Since StepDance is not yet public, I will refrain from sharing too many details about it for now, but I used the StepDance breakout board to receive two sources of input on a Teensy. I am incredibly grateful to Ilan Moyer, Jennifer Jacobs, Emilie Yu, Devon Frost for allowing me to test out StepDance, which saved me a whole lot of hardware headaches this week!
I laser cut a frame for my draw wire encoders from some scrap wood I found in the shop.
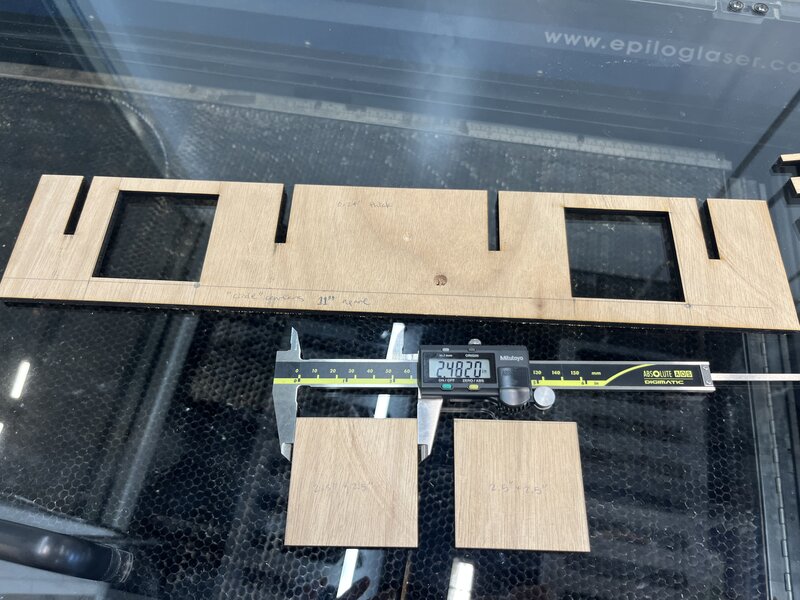
I tried to space them a fixed real-world distance apart - 11” - but would later come to realize that this is not super relevant as the draw-wire encoder does not seem to operate in inches nor mm but rather its own, mysterious units. Mostly, I didn’t want them to slide around as I pulled the wires.
In my final rig below, I clamped this board to the edge of a table to firmly lock the draw-wire encoders in place. Of course, they can still be easily removed from the frame.
Initial spiral
I started by modifying Ilan’s Remote Procedure Call script to read the encoder values and write them to a file alongside the timestamp.
Remote Procedure Call allows me to call, for example,
encoder_1.read() on the Teensy as if it were on my local
machine. All I had to do was make sure the port was correct, as in
myrpc = rpc("/dev/tty.usbmodem178477201"), and make sure my
Serial Monitor was not open in the Arduino IDE.
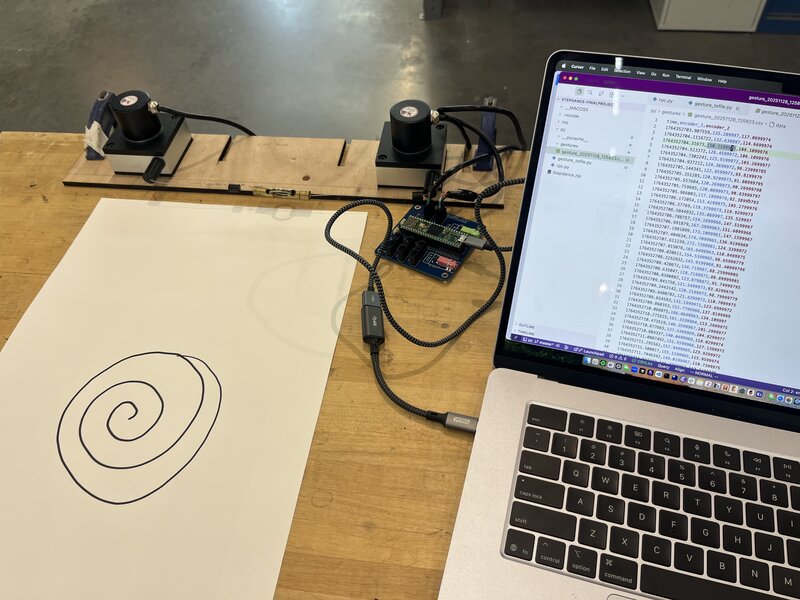
Here is my draw wire encoder rig, and a spiral I drew while running my data collection script. Spiral design, quite literally…
Making sure the math is mathing
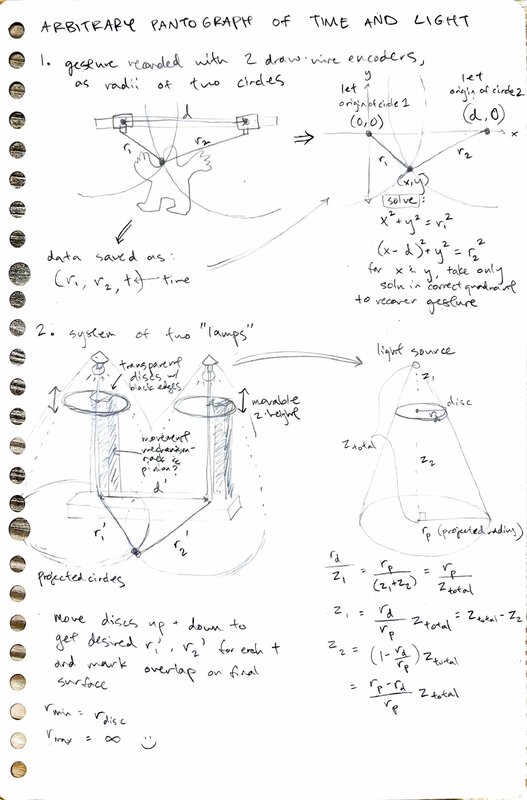
First, I wanted to test that I could correctly implement the underlying math for my pantograph. The math is this: each draw wire encoder can be thought of as the center of a circle. The circles (encoders) are a fixed distance apart (as set by the frame I just made), and as the pen (which is attached to the ends of both draw wire encoders) moves, the radii of the two circles change. We can think of the pen’s position as the point where the two circles intersect. Of course, two circles with different centers can overlap at two different points, but only one of them will be in the quadrants that we care about, since we are only displacing the draw wire encoders in one direction (covering 180 degrees of rotation maximum).
Here’s a slide that explains that again, more visually:
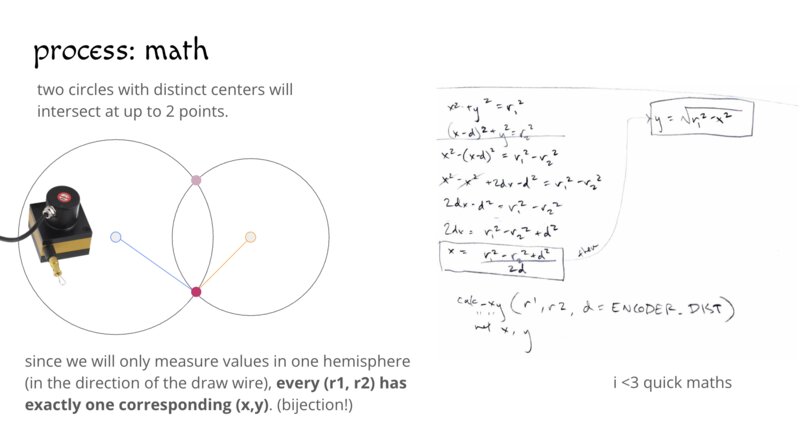
I did a quick derivation of the expressions for x and y:
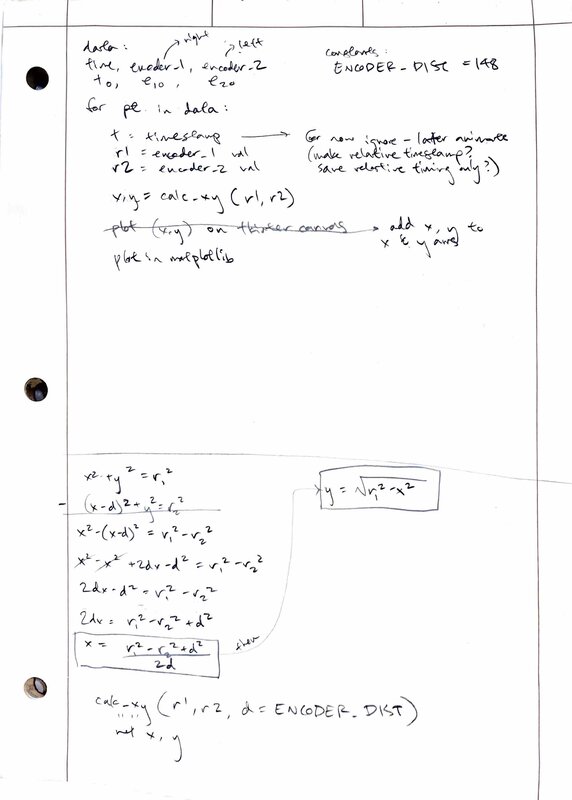
Then, I wrote that up as a Python function using NumPy and tested it by plotting the computed (x,y) points using matplotlib:
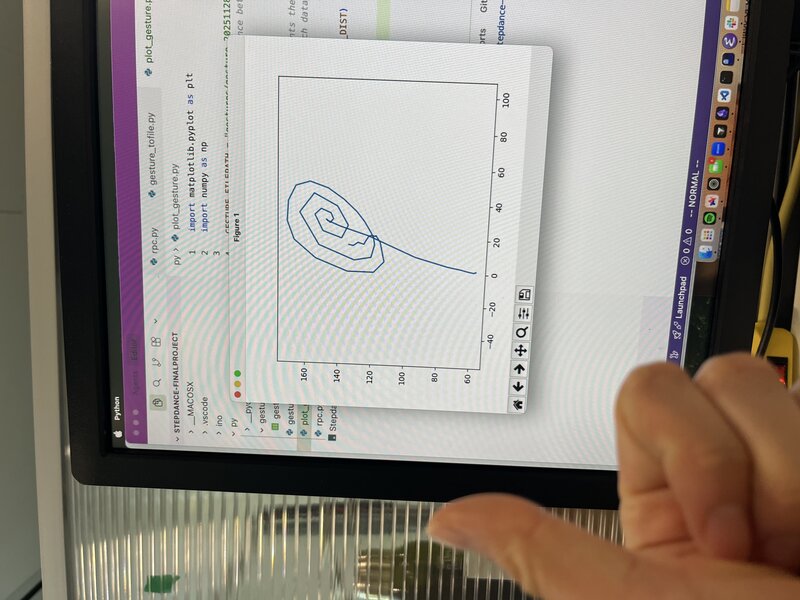
It works! The extra line (turning the spiral into a lollipop) is because I let go of the encoders before stopping the recording, so I accidentally recorded the retraction of the encoder wires as well. There is a slight skew to the final image which I decided to keep for artistic reasons – the machine exerting its agency over the artwork, and so on – but suspect is due to the linear encoders not operating at quite the same scale.
Here’s the code for this part.
Networking!
Now that I had Python RPC working, and confirmation that my math was sound, I was ready to start piping my data into my web controller!
At this point I had already spun up a quick static website for my controller. I used ChatGPT to generate a quick WebSocket test script to open a WebSocket connection and send a counter across, as well as a test HTML page. Here is my chat history. I was able to get the counter working, and moved on to using the same pattern to getting my real encoder data into my webpage.
On the Python side, I wrote this little
Websocket server to stream the encoder data as a JSON file into the
Websocket connection. Then on the website side I wrote a JS script for
simple
portal logic, where I set the WebSocket event handler
ws.onmessage to parse the received encoder data and compute
the (x,y) position from it (I translated my previous Python helper
function into JS). I verified that this worked by first just printing
the encoder values directly onto the webpage.
Then, I created a global window variable
window.portalPosition = { x: 0, y: 0 }; which I
continuously update with the new computed (x,y) from the sensor
readings, and wrote a p5.js
sketch which uses that (x,y) to move a yellow rectangle around the
canvas accordingly.
Et voila!
Group assignment
I did this week’s group assignment with Ben. We connected our projects with UART.