Week 13
Interfaces :^) This week I continued the project I began last week. I built a nice web UI to build a sort of spiritual world for the PORTAL, and to allow users to record and playback gestures made with the device. I also made an interface that allows users to interpolate between two recorded gestures or one live and one recorded gesture made with the device.
Here’s the simple PORTAL:
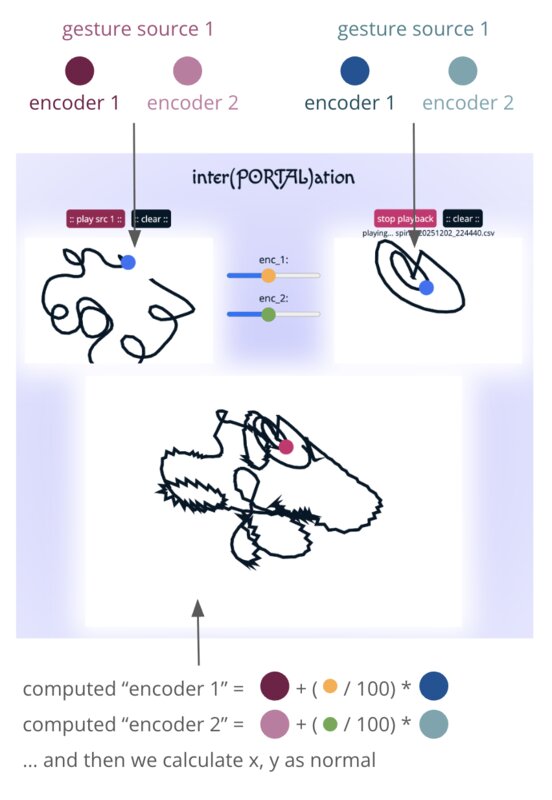
Here is inter(PORTAL)ation:
A PORTAL, part 2
It may seem frivolous / like bad spiral design, but I started by deciding on fonts and colors for the (very simple) splash page of my controller. I like to start from a relatively polished splash page to simultaneously wireframe the pages I need to build and to set the scene aesthetically. When I see the webpage I want to be transported into the artistic universe of the PORTAL, so that even as I build the webpage I have the flavor of the final world I am building in mind.
After a whole lot of fussing, here was my splash page:
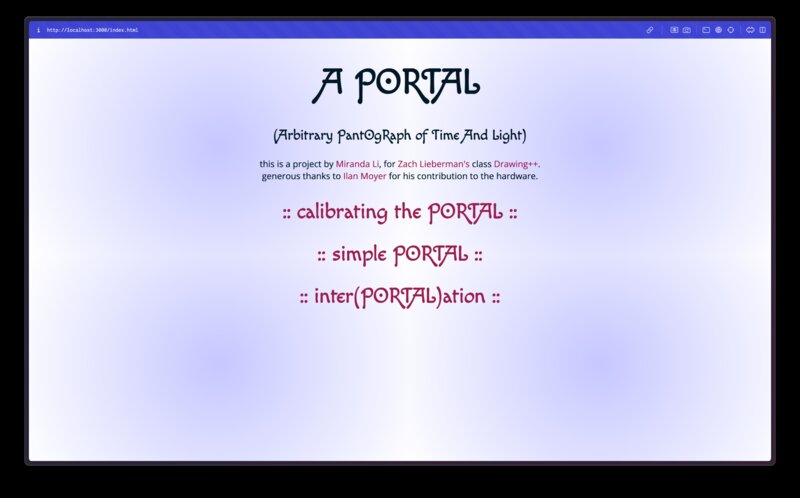
I’m using Macondo Swash Caps for the title font and Open Sans for body text. The source code for this page is here.
Simple PORTAL
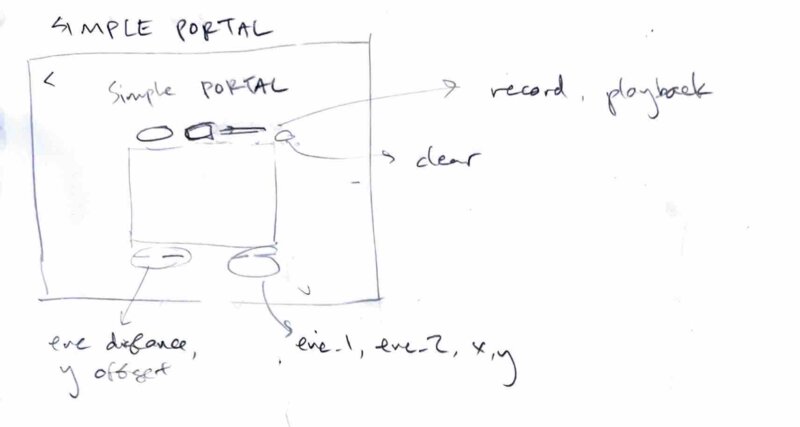
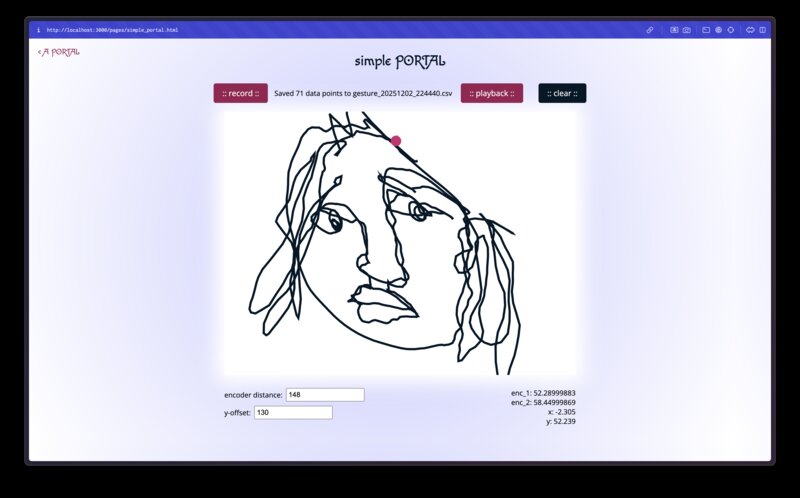
The Simple PORTAL interface aims to let users draw on a p5.js canvas using the two draw wire encoders. Users can then record their gestures to .csv file, and playback a .csv file which will infinite loop that gesture.
Here is my initial sketch for the UI:
After I had gotten the networking working, I was able to use live data from the sensors to manipulate a yellow square on the p5 sketch.
To implement the recording feature, I added a button which toggles a
boolean “recording” state. When the “recording” state is active, all the
sensor readings are stored in an array called recordedData.
When the “recording” state is toggled off, all of those readings are
written to file.
To implement the playback feature, I added button to open a file picker which opens .csv files and expects the following headings: x, y, encoder_1, and encoder_2. Each row is one sensor reading (and its computed x, y coordinate). In playback loop, if we are in playback mode, I manually set the global portal position variable to the next reading in the gesture file instead of taking input from the sensor. This way the sketch doesn’t need to know anything about where the data is coming from; it just faithfully renders what it needs to at the provided (x,y).
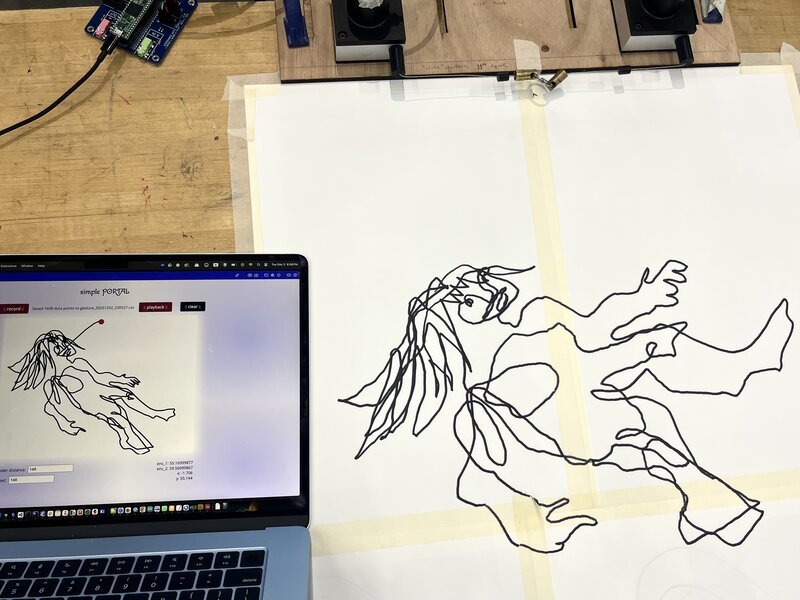
Here’s my simple portal interface, with a self portrait I drew:
Here’s the recording and playback features in action:

Here is a 3x speed timelapse of me using my tool to draw a figure while Neil gives a tour of the shop in the background.
Here’s the drawing I made on the paper juxtaposed with the version which was rendered on my web controller. As I was drawing I was looking at the web controller, not the paper – it’s interesting to me how I was able to capture the inverse skew of the sensor readings on paper, without looking!
Inter(PORTAL)ation
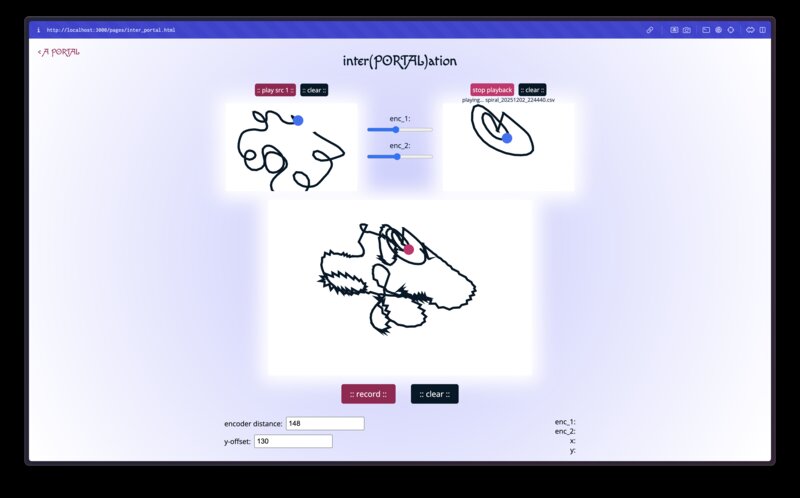
The next thing I wanted to do was to be able to mix the encoder values from two different gestures to get an interpolated drawing. I envisioned it in my head at first as a sort of node-based interface, but decided to lay it out a bit differently to maximize the size of the canvases.
Here were my sketches:
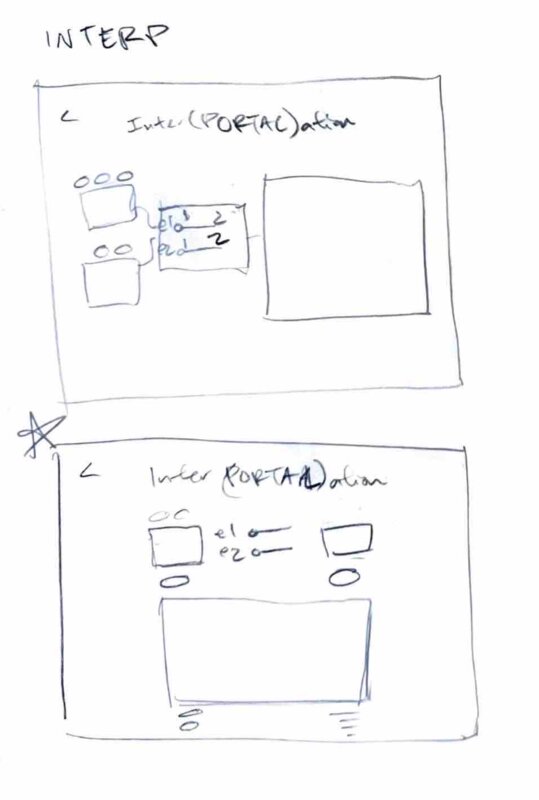
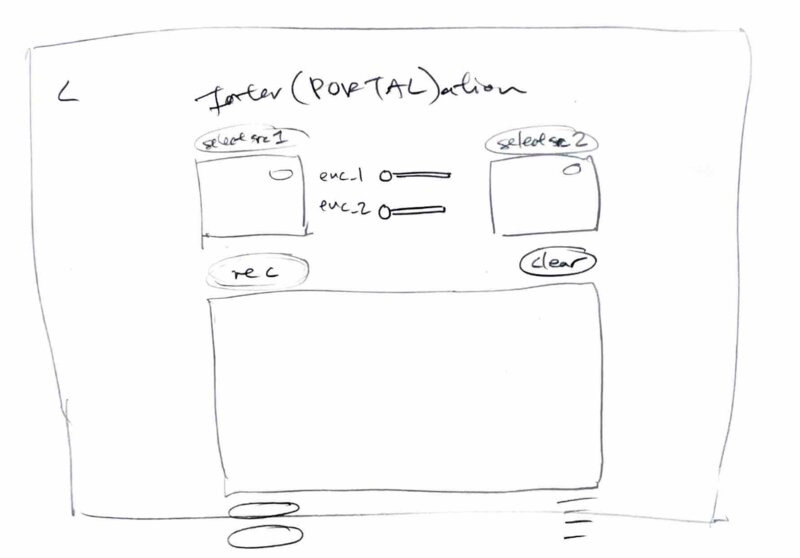
I was able to reuse the components I had made for the playback button and clear button, and a lot of the code patterns from the simple portal to implement the canvases and buttons for the source and resulting canvas. The sliders were not too hard to add, and all I had to write beyond that was the logic to: 1. Only play src1’s input if there is no specified src2. If no gesture is uploaded we use the live sensor data by default. 2. If src2 exists, synthesize “encoder values” which interpolate src1 and src2, weighted by the slider. When the slider is set to 0, src1 signal is replicated entirely and src2 is ignored, and vice versa.
Below is my attempt at a visual explanation of the math for this part:
Here is my final interface! In this video I demo first having the sliders set all the way to 0 (only src1 gesture plays), then moving them all the way to the right (only src2 gesture plays), and finally drawing while setting them to about the halfway point (weird, jittery artifacts!).
Group assignment
I contributed the following to our group website:
I used Python Remote Procedure Call to read Serial input into a Python script, Websocket to stream that to my static website, and Javascript to pass the data into a p5.js sketch. I made my UI in HTML and CSS, just as god intended. The pipeline was fairly straightforward to set up and I had no issues with latency. As for the interface, I’ve used other frameworks before, but for small one-off projects I prefer to keep it simple – I made a bit of use of Shoelace for some components, but that was about it.