The Problem
parsing .svg
Here is an svg description of a 1" by 1" square. square.svg | <?xml version="1.0" encoding="UTF-8"?> <!DOCTYPE svg PUBLIC "-//W3C//DTD SVG 1.0//EN" "http://www.w3.org/TR/2001/REC-SVG-20010904/DTD/svg10.dtd"> <svg width="26mm" height="26mm" viewBox="0 0 2600 2600"> <g style="stroke:rgb(0,0,0);fill:none"> <polyline points="1270,2540 0,2540 0,0 2540,0 2540,2540 1270,2540" style="fill:none"/> </g> </svg> |
Right off the bat, I notice a few things in the polyline string. First, it's in centimeters. Second, and more importantly, there are 6 points defined instead of 5 as I expect. (I expect 5 because there are 4 vertices but the starting and ending point need to be specified explicitly to close the shape.)
I used Open Office Draw to make the square, using the square primative. I want to start simpler, so I use the polygon tool to specify 4 vertices to make a 1" square:
 poly-square.svg | <?xml version="1.0" encoding="UTF-8"?> <!DOCTYPE svg PUBLIC "-//W3C//DTD SVG 1.0//EN" "http://www.w3.org/TR/2001/REC-SVG-20010904/DTD/svg10.dtd"> <svg width="26mm" height="26mm" viewBox="0 0 2600 2600"> <g style="stroke:rgb(0,0,0);fill:none"> <polyline points="0,2540 0,0 2540,0 2540,2540 0,2540" style="fill:none"/> </g> </svg> |
Yeay! I started my drawing in the lower left hand corner and if I consider (0,0) as the upper right hand corner, the points are consistent with the order I drew them in which was clockwise from the lower left. The problem with this is that it doesn't conveniently drop into the usual coordinate system where numbers get bigger up and to the right.
Since it's entirely up to me, I'll chose to transform the points to fit the more usual coordinate system. "viewBox" conveniently tells me the min and max values for x and y so I can use this to offset the y.
Ok, so I need to write some code that
2) picks out the polyline points
3) offsets the y coords of the polyline points so that (0,0) is in the lower left; without flipping the shape
line segments
Expressing the points as line segments is simply finding the line defined by two points, (x1, y1) and (x2, y2).-
y = m × x + b such that x1 ≤ x ≤ x2, y1 ≤ y ≤ y2
m = slope = (y2 - y1) / (x2 - x1)
b = offset = y1 - m × x1 (or use x2, y2)
So the code also needs to:
inequalities
I also need the code to
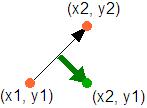
Graphics convention is that the vector normal points to the interior of the object. Given two points (x1, y1) and (x2, y2) in that order,
-
if the slope is increasing (positive), the normal vector on the "right" side is (x2, y1)
if the slope is decreasing (negative), the normal vector on the "right" side is (x1, y2)
I assume that the points are given in the appropriate order. However, the polyline points are recorded in the order that I drew them in. Look:
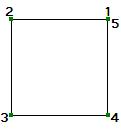 counterclock.svg | <?xml version="1.0" encoding="UTF-8"?> <!DOCTYPE svg PUBLIC "-//W3C//DTD SVG 1.0//EN" "http://www.w3.org/TR/2001/REC-SVG-20010904/DTD/svg10.dtd"> <svg width="26mm" height="26mm" viewBox="0 0 2600 2600"> <g style="stroke:rgb(0,0,0);fill:none"> <polyline points="2540,0 0,0 0,2540 2540,2540 2540,0" style="fill:none"/> </g> </svg> |
So in order to figure out which side is "in", I'll also need to make sure I am travelling the vertices in the clockwise direction.
Finally, the code should output the inequalities as a list. Later, the inequalities are strung together into clauses. The union of all these segments is a big mess while the intersection isn't right either - consider the case of this shape where the intersection of the lines results in the very small shape just under the green and yellow lines.
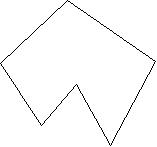
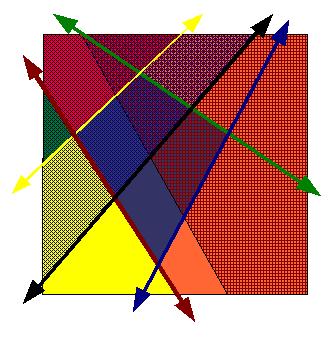


Well, that's interesting. For the moment, though, I'll punt on what to do with all the inequalities and focus on generating the list of inequalities.
Move on to code requirements.