Search
|
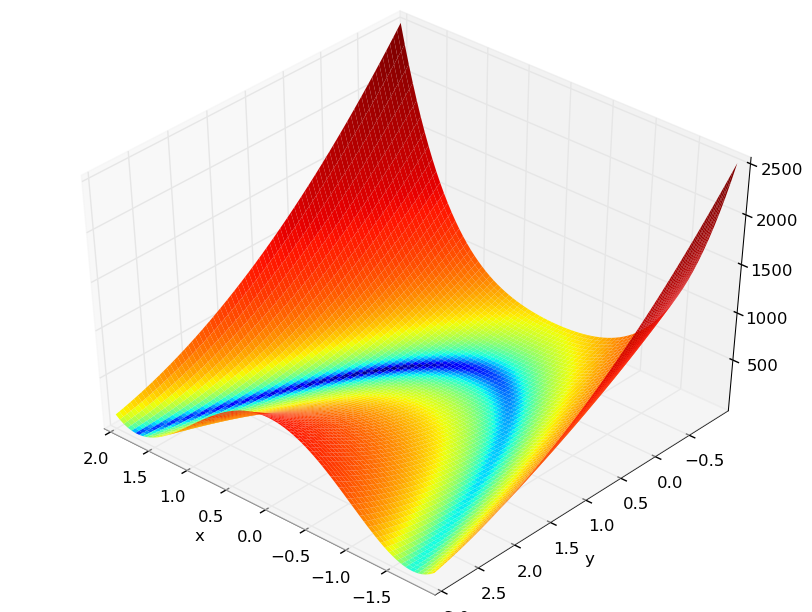
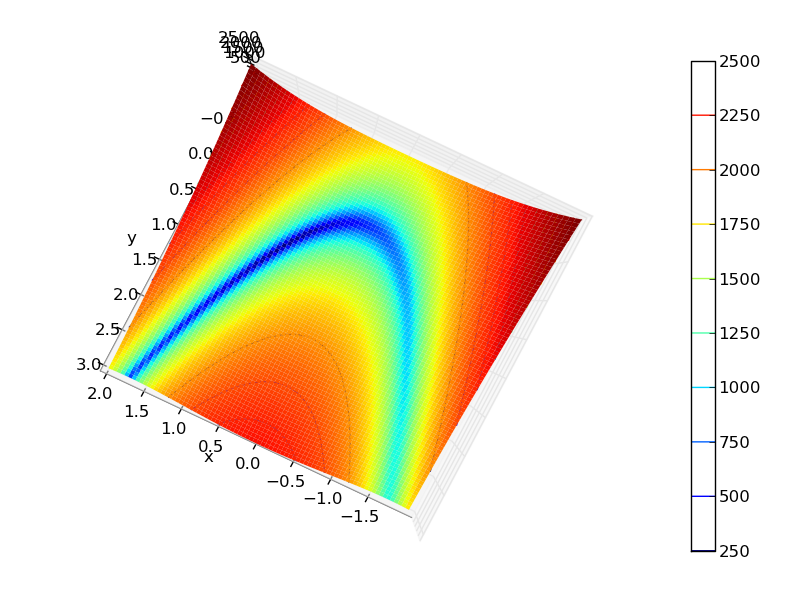
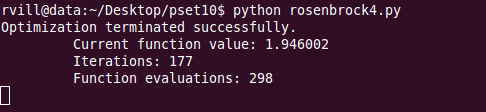
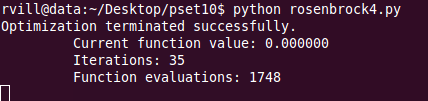
Plot the Rosenbrock function: < Although Mathematica can plot the rosenbrock function with just one line of code, using Matplotlib in Python appears to offer more graphical output options if you're patient enough to write a few extra lines of code. Here it is in Mathematica: rosenbrock.nb. Working this problem in python, the results from evaluating the function using the downhill simplex method can be seen in the screenshot below: Similarly, after evaluating the function using the direction set method I obtain the following results: My implementation of the results above: rosenbrock4.py. This week has been a balancing act between diving into my final project (the first part of the agenda: understanding Navier-Stokes equations and basic fluid dynamics algorithms) and studying this week's topic.
The following implementation is a work in progress - I'll need to fix some issues that I've come across when computing the conjugate gradient and Levenberg-Marquardt method.
|