Project 8: Fitting Functions
Fitting functions to data such that a model exists that can be used in place of the data itself. For instance, once a model is determined interesting means of prediction may be implemented.
The most effective method of fitting data to a linear model is the make use of the Singular Value Decomposition (SVD). This is of course one of these things where there is lots of information about the proof and why it is so amazing, but it seems rather difficult to find any information that explains how to implement the the function.
I went to the library and picked up the "Numerical Recipes" book that was referenced by this chapter and several of the previous chapters. Wow, it is super informative. I had previously briefly looked into the online version of the book and thought it was all just a pile of code. As it turns out there are actually very descripted explanations of each of the "recipes" such as what is SVD along with the code that has been implements. Luckily, these recipes have been around for quite some time and is readily accessible in libraries for most programming languages...such as Python.
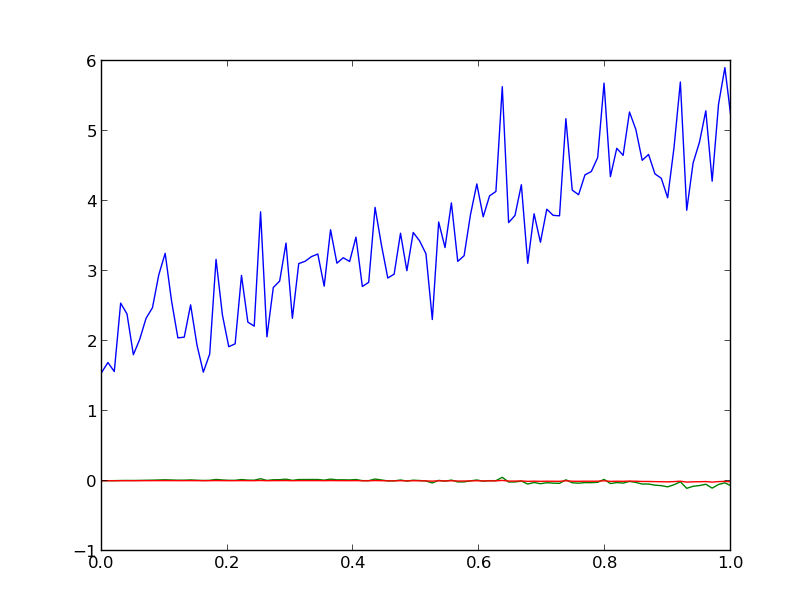
I've been trying to get the line to fit back onto the data and I get a line, but it's not of correct slope, and by that i mean it is totally flat. i'm not entirely sure what is wrong. It seems like I need to accumalate values for the A term perhaps.
code
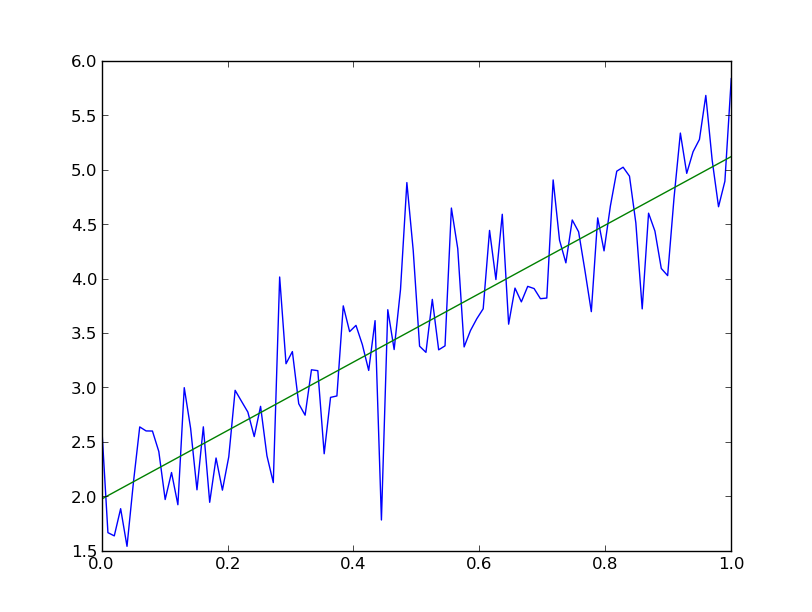
Finally got the fit working!! thanks to Sam's code. Sam knows how to code, i don't, so I've been sneaking into his code to learn his tricks.
There were two fundamental issues I was having, and a third note is made below just because it's important.
- I was thinking the SVD wanted all of the data going into it so I was sending it 2 dimensional array testdata that was composed of my x and my y data. This made sense to me because it was taking all of the information I have and dumping it into the SVD to solve the set of simultaneous equations.
#this line doesn't workHowever, I found that Sam was building the required 2dim array by stacking ones with his x data.
#testdata = np.transpose(np.array([x_data,y_data]))
testdata = np.dstack((x_data,np.ones_like(x_data)))[0]This 2dim array of testdata is then dropped into the SVD. I will say, I'm still a bit confused by this. why am I inserting my x-data into the SVD, does that not carry minimal information about my distribution of data? Nonetheless, dropping the array of stacked x-data into the SVD function is what finally made my linear fit line-up across the data. I guess what I am thinking is that we are inserting into the SVD a 2d array that defines the arrangement of data we will be looking for, that is a single order polynomial.
U, s, V = np.linalg.svd(testdata, full_matrices=False, compute_uv=True)
- Now to get the set of coefficients we dot product the V, inverted S (or W), U functions along with the collected data, y_data. I had this previously and I spent WAY too many hours trying to figure out what was wrong, but this did make sense to me. But i'm including this for explanation.
func = np.dot(np.dot(V.T, np.diag(1/s)), np.dot(U.T, y_data)) - Finally, this plus item 1 were the real kickers. Now we take our coefficients and combine them with our x-data. I kept getting a flat line and I knew there was some sort of offset or accumulation i was missing, but this just wasn't catching for me. Seein this implementation from Sam's code helped it all come to gether. The funny thing is all of this information is actually in the text book, it's just that I don't understand what I'm reading until i go over it about two dozen times and sometimes i still need to see how others are doing it. sheesh! i better get making some robots soon so I can do something i'm actually good at!
newVal = x_data*func[0] + func[1]