final project
an exploration of pulse oximetry
Pulse Oximetry is a noninvasive optical technique for monitoring blood oxygen content. In use, an electronic instrument shines alternating wavelengths of light through a subject's skin and uses the resulting absorbance data to calculate percent oxygen saturation. By ignoring absorption data that does not change at a typical pulse rate (0.5 - 3 Hz), the system accounts for errors from skin variation, ambient light, and capillary/venous blood (which is naturally lower in oxygen than capillary blood).
In light of the current covid-19 pandemic, expanding access to blood oxygenation instruments is a worthwhile goal since blood oxygen saturation (SpO
2) is a leading indicator of respiratory distress. This project examines the feasibility of constructing a pulse oximeter using generic components (LEDs, photodiodes, etc) rather than purpose-built proprietary sensors. First, raw sensor data and computed SpO
2 data are gathered from a commercial finger clip pulse oximeter; next, algorithms are written and applied to compute SpO2 values from the raw data, which are then compared to the oximeter's computed values; next, the same algorithms are applied to data obtained from a sensor constructed from generic components; and finally, the resulting computed SpO
2 values are compared to the commercial instrument.
files
background
This section was originally written in support of a broader public health instrumentation survey, available here.
Pulse oximetry is based on the Beer-Lambert law, a principle that relates the concentration of a species to the attenuation of light through a sample:
...
where
I is the intensity of light transmitted through the sample;
Iin is the intensity of the light prior to absorption by the sample;
D is the optical path length;
C is the solute concentration; and
ϵ is the extinction coefficient, the sample's absorption at a given wavelength of light. For a multi-species compound, the three terms
D,
C, and
ϵ for each individual species are combined:
...
Typical commercial pulse oximeters use a red LED (660 nm) and an IR LED (940 nm) to quantify the relative concentration of reduced and oxygen-rich hemoglobin in a person's bloodstream based on the following absorbance curves:
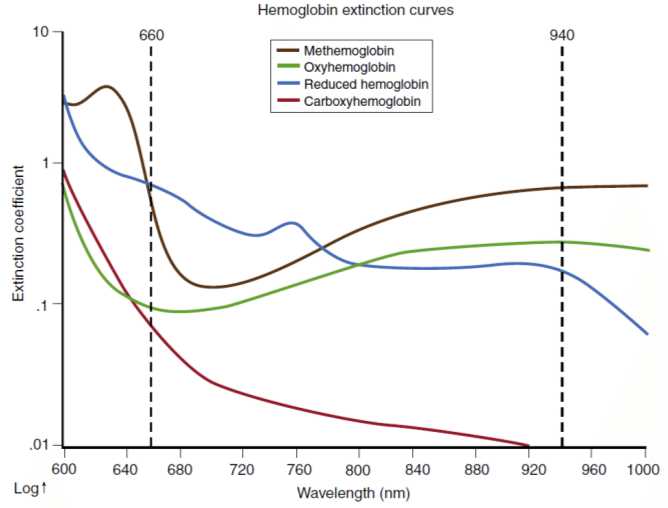 Figure source: Bülbül, Ali & Küçük, Serdar. (2016). Pulse Oximeter Manufacturing & Wireless Telemetry for Ventilation Oxygen Support. International Journal of Applied Mathematics, Electronics and Computers. 211-211. 10.18100/ijamec.270309.
In order to differentiate the slight intensity change caused by varying blood oxygen concentration from errors related to skin absorbance and venous blood (whose oxygen has already been taken up by cells), the signal processing algorithm isolates the AC portion of the signal, since within a reasonable range (~0.5 - 3 Hz) this corresponds to blood rushing through arteries with each heartbeat. This
pulsatile arterial blood increases the optical path length of the measurement as blood pressure swells the arteries, producing periodic oscillations in the absorption signal. The other contributors to absorption, such as tissue and venous/capillary blood, are effectively constant in this frequency regime. By calculating the ratio of the AC and DC signals at each wavelength, then taking the ratio of these two absorption ratios, a value
R can be determined which is only related to the relative concentration of oxyhemoglobin (O
2Hb) and reduced hemoglobin (Hb):
...
As the photodiode sensor does not differentiate by wavelength, the device rapidly cycles between red, IR, and no LED, allowing the system to compensate for ambient light variation as well. The cycling speed must be substantially faster than the heart rate, since the ratio
R assumes absorption at all wavelengths is carried out simultaneously in order to cancel out path length.
R is then related to SpO
2 using an empirically determined curve:
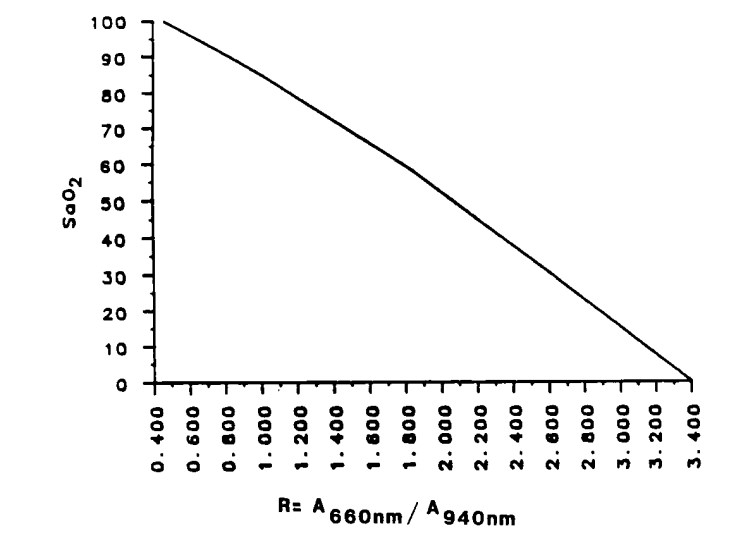 Figure source, via Ohmeda Corp: Pologe, Jonas A. "Pulse oximetry: technical aspects of machine design." International anesthesiology clinics 25.3 (1987): 137-153.
Note that methemoglobin (MetHb) and carboxyhemoglobin (COHb) are not factored in with this method and will thus cause systematic errors; the above calculation assumes these two compounds are minimally present. Additional wavelengths are needed to quantify all four hemoglobin species.
methods
An apparatus was constructed to simultaneously record raw sensor values and computed SpO
2 from a
Zacurate Model 500 BL pulse oximeter, along with raw sensor values from a simple self-built sensor. In use, the apparatus was somewhat clunky but usable for brief periods of time:
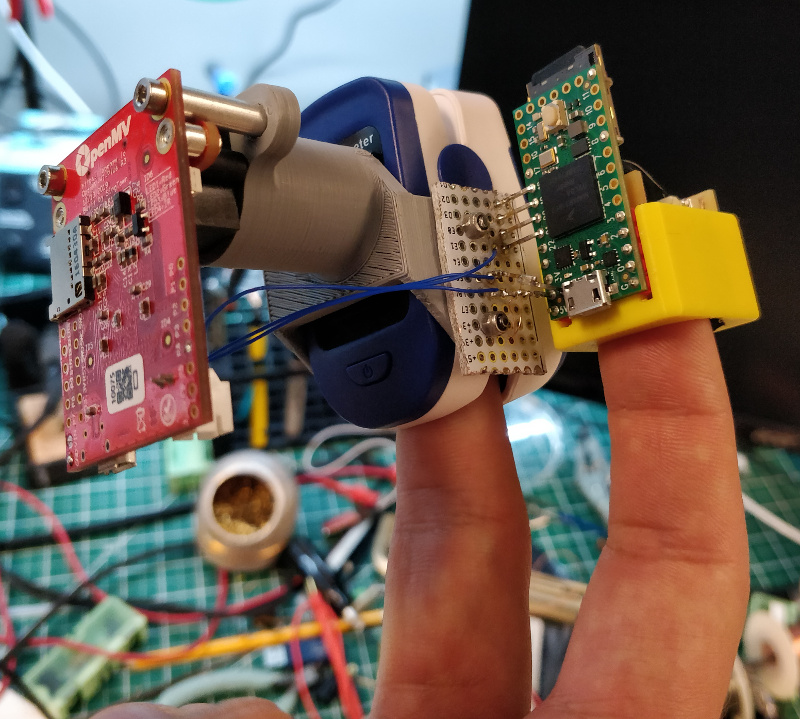
Detailed information about the apparatus, including firmware and CAD files, can be found
here.
Several data sets were logged, including during a walk home from lab and a strenuous hike up 30 flights of stairs. In both cases, despite the use of a tight-fitting mask, the calculated SpO
2 from the commercial pulse oximeter did not vary by more than a percentage point, providing minimal insight into the device's algorithm. For the
final dataset, I simply held my breath as long as I could, managing to reduce the measurement to a low-but-still-not-dangerous 91%. Note my pulse rate was still elevated, as this test occured soon after climbing Eastgate and the pandemic hasn't been great for my cardiovascular health. Here is a plot of the Zacurate sensor readings over ~a minute:
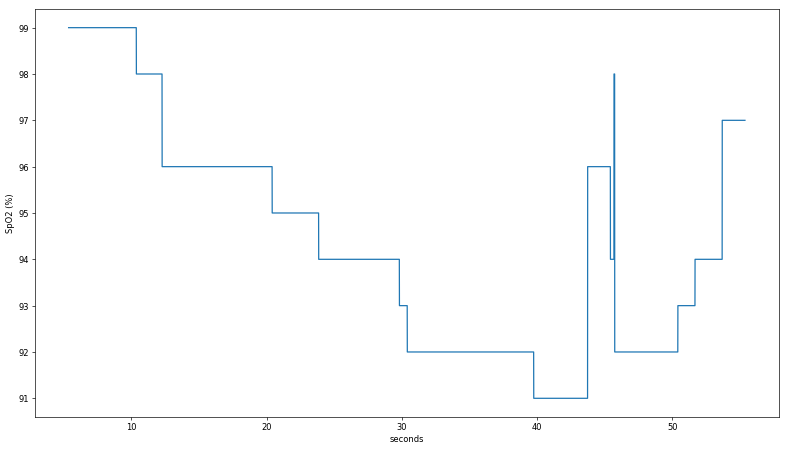
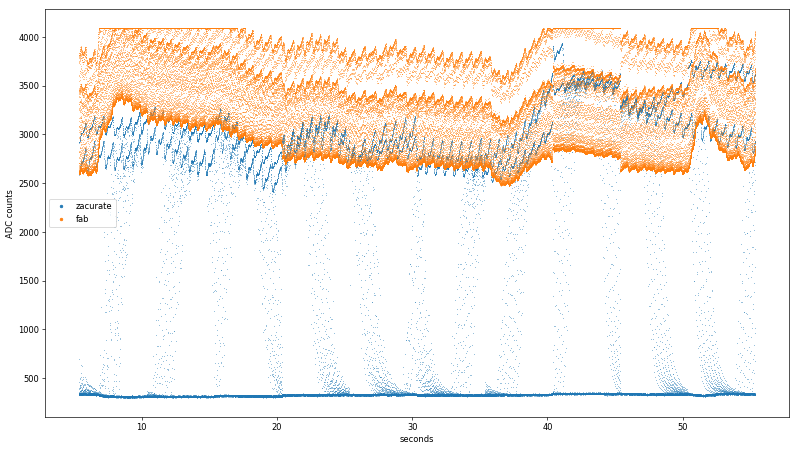
The two raw sensor readings were sampled at 5 kHz, so the oscillations are hard to make out over the whole log despite using tiny markers in matplotlib:
Zooming in on the time axis and adding lines, one can make out the two alternating pulses from each sensor:
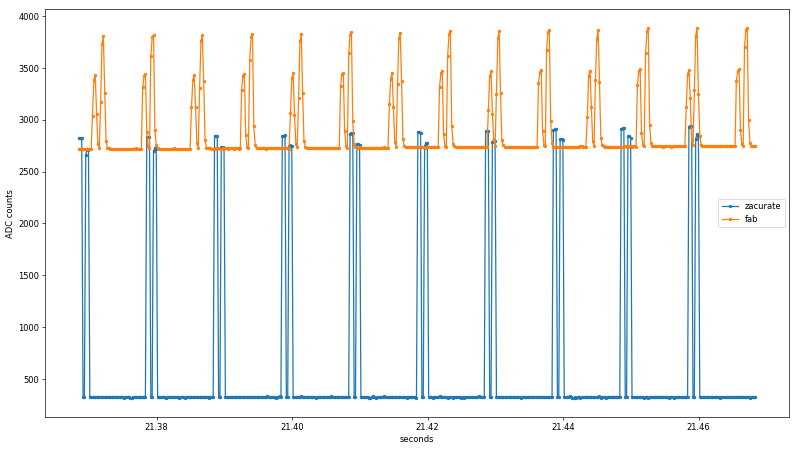
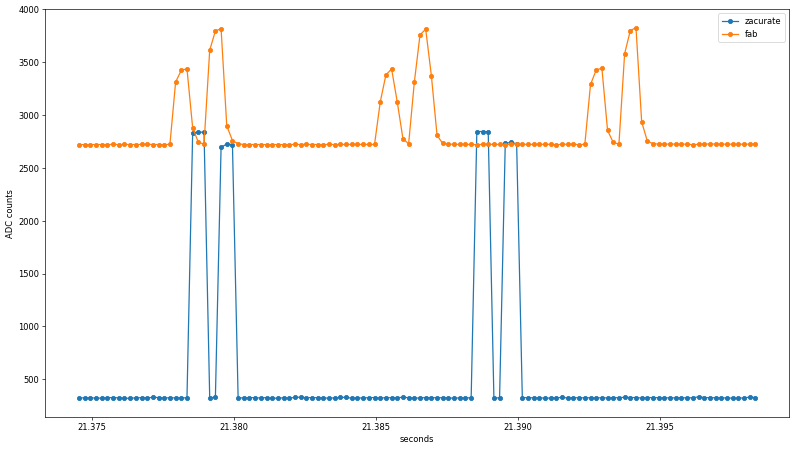
Already, a few interesting findings emerge from the untouched data. First, the rise/fall time of the Zacurate raw sensor data is faster than the ADC sample rate, while the fab sensor shows clear midpoints before reaching its maximum values. Since the same ADC peripheral is used in both cases, this suggests the preamplifier or photodiode slew rate may be to blame. I used an
Advanced Photonix PDB-C154SM photodiode with a 10-90% response time at 660 nm and 10 VDC bias of 10 ns, and an
Analog Devices AD8605 op-amp with a slew rate of 5 V/us; both specifications are well beyond the 200 us sample rate so the source of the slope needs more investigation.
Another noteworthy observation is that the Zacurate sensor uses much more of the 0-3.3 VDC range of the Teensy's 12-bit ADC. This may be due to the slight translucence of the 3D printed finger sleeve letting in ambient light, or the LEDs being driven to higher light output values than is optimal for a fingertip sensor. Both conditions likely exist; the former is demonstrated by the unstable baseline reading from the fab sensor when the LEDs are off, while the latter is clearly shown when the fab sensor saturates from ~7-17 seconds and again around 40 seconds. Regardless of cause, the Zacurate front-end yields an additional bit or two of data resolution.
analysis
The objective of this data analysis is to perform the calculations in real-time on a continuous data stream, rather than offline on a bulk data set. Without real-time (or close to real-time) analysis, the pulse oximeter is useless as an early warning device. As such, while the full ~1 minute data set will be used for development, the intention is to iterate through the data and produce a continuous output.
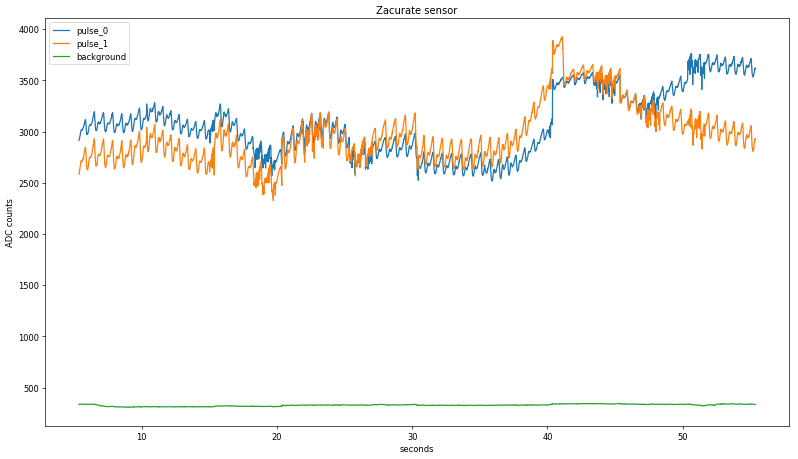
First, the raw discontinuous absorption data is split into its three parts: the background signal, where the LEDs are both off; the red absorption signal; and the infrared absorption signal. Since the order of the red and infrared pulses are unknown (assuming later calculations are performed correctly, this will be determined), they will be tracked as
pulse_0 and
pulse_1. Each resulting subset is compressed to a single point per transition with an accompanying timestamp. To do this, the rate of change from one point to the next as a percentage of the total ADC range (4095 counts) is quantified and compared to an empirically determined threshold. Continuous stretches where the calculated value is below the threshold are averaged and stored in three rotating subsets representing the three LED states; the background state is determined with another threshold since it is much longer than the others:
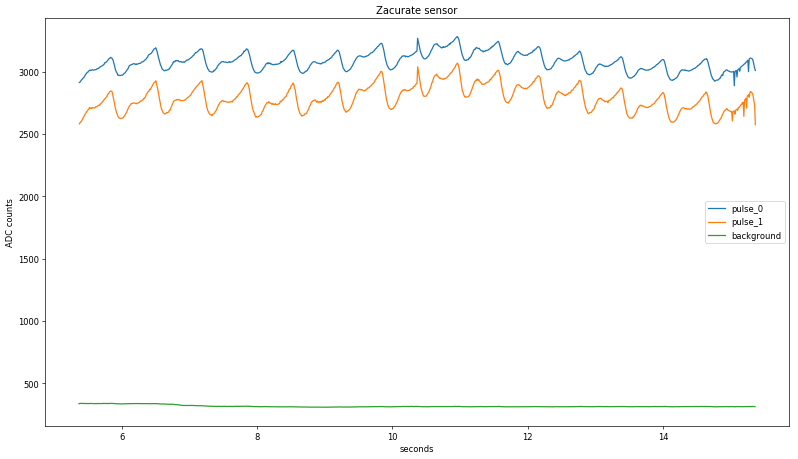
Zooming in again, the two raw values are starting to look a lot like a pulse, at least in terms of period:
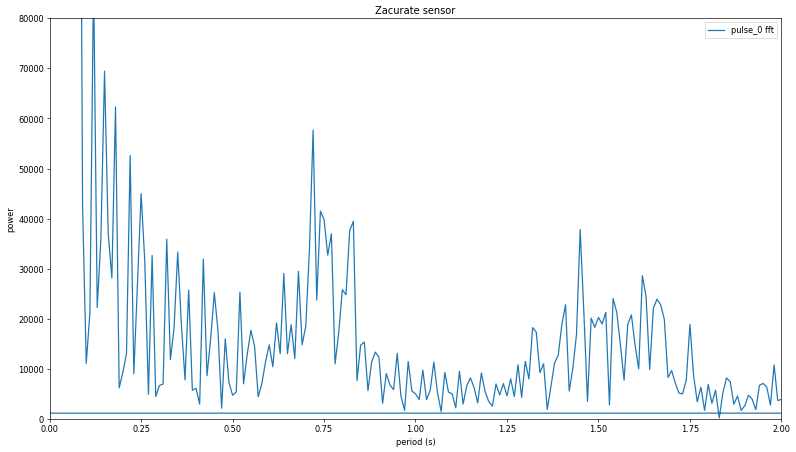
Taking the Fourier transform of pulse_0 shows a peak around 0.7 seconds (1.42 Hz), corresponding to a pulse rate of 85 BPM, which sounds about right given my recent stair-climbing exercise:
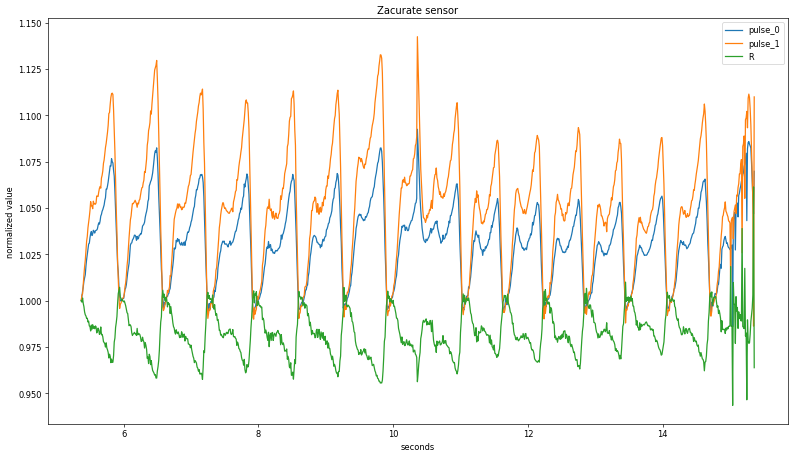
Next, each pulse needs to be isolated from both the background light level and from non-pulsatile blood. The former is accomplished by subtracting the previously isolated background signal, while the latter is removed by dividing the minimum value from the pulse train. The two datapoints, pulse_0 and pulse_1, are combined into a single np.array with a common time axis (introducing a slight error, as discussed earlier) and the matching background signal is subtracted from each. Then, the pulses are normalized on a rolling basis by dividing by the minimum value from an empirically chosen sampling period (in this case, ~1.5 Hz). After dividing pulse_0 from pulse_1 the result still shows a good deal of noise from the original waveform, as shown here in a zoomed in section:
Dividing the two signals at a rolling maximum value for each beat shows less noise but still no clear correlation with the recorded SpO
2 values:
A more sophisticated approach centers the averaging window on the current value; plotting these rolling values with the background-subtracted pulse signal shows good agreement with an averaging period of +/- 50 data points:
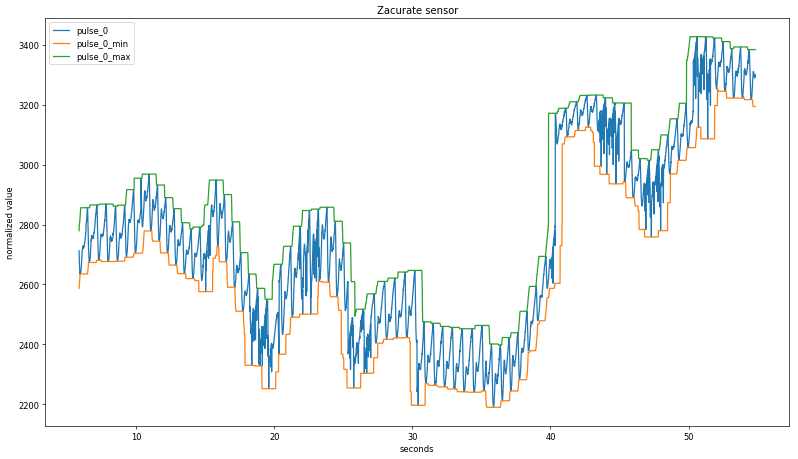
Discrete points for each heartbeat signal are then identified by capturing data slices when the current values are equal to the maximum; this is done for both the pulse_0 and the pulse_1 signals. Finally, maximums are divided by minimums, and then pulse_0 is divided by pulse_1 and the resulting curve plotted alongside the displayed SpO
2 value:
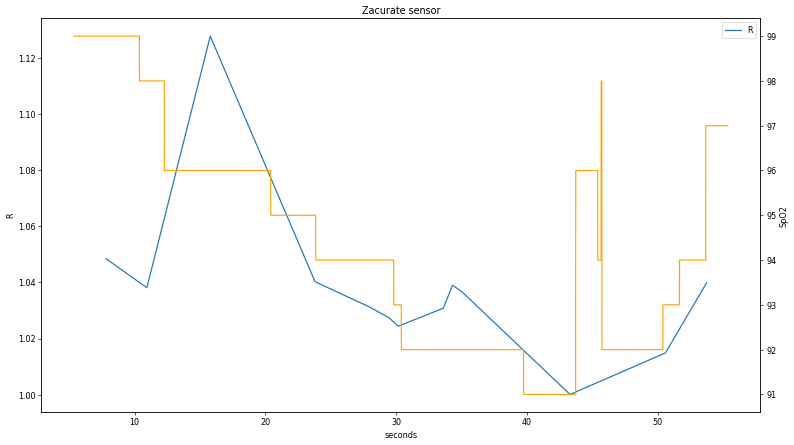
The correlation is clear but some distinct discrepancies appear, particularly in the first part of the data. A worthwhile future exercise would be to collect additional data plots during fluctuating SpO
2 states to perform a more extensive comparison to determine if the discrepancy around t < 15 s is real. Having said that, the relationship between the two values is clear enough to confirm the LED pulse order; since R is inversely proportional to the ratio of red and IR absorption and the calculated curve is pulse_1 / pulse_0, the first signal (pulse_0) is IR.
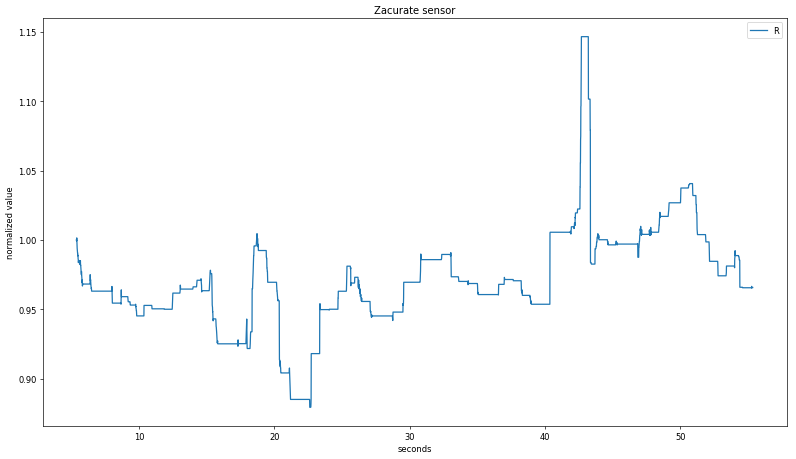
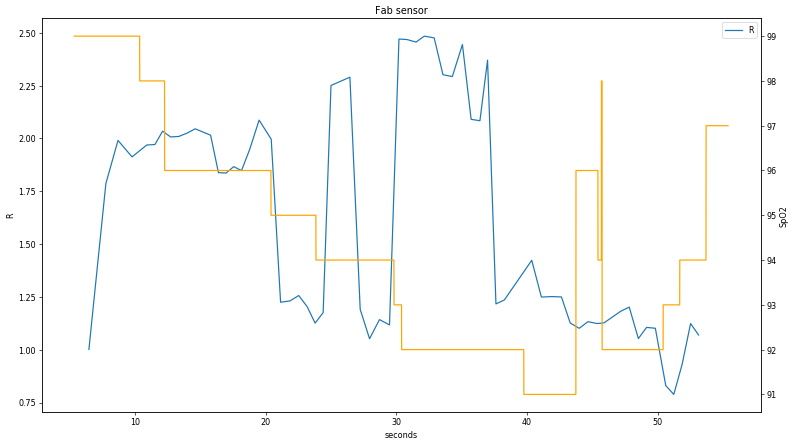
Applying the same algorithm to the fab sensor data is somewhat fraught, since a visual examination of the raw plot shows clear signal clipping at t < 20 s and t > 40 s. As expected, the data is does not show a strong relationship between recorded SpO
2 and calculated R:
next steps
One hope in this exploration was to show a clear enough correlation between the instrument readout and calculated SpO
2 values that one could apply search or curve fitting techniques to "discover" the R::SpO
2 calibration curve. Unfortunately this was not explored due to time constraints.
A more ambitious goal is to demonstrate agreement between the commercial and the homebuilt sensor, despite the latter's lack of high-accuracy LEDs. Before this is possible, the apparatus will need to be refined to (a) reduce the background signal, (b) reduce variation between pulses (possibly caused by physical movement or shifting ambient lights), and (c) improve the portability and ergonomics of the instrument.
I learned a great deal from this project. Some highlights:
- I got better with Numpy and matplotlib. This was the first time I used these tools to examine a large (to me) dataset with 250k points.
- I was reminded that I need to check my instinct to make everything a hardware prototyping project first. While getting real data was valuable, I should have simulated a noisy R curve and the calculated SpO2 value so I could focus on the math.
- Data fidelity is important. The analog/physical front-end for the fab sensor needed another iteration to reduce background noise and avoid clipping the ADC.
 Figure source: Bülbül, Ali & Küçük, Serdar. (2016). Pulse Oximeter Manufacturing & Wireless Telemetry for Ventilation Oxygen Support. International Journal of Applied Mathematics, Electronics and Computers. 211-211. 10.18100/ijamec.270309.
In order to differentiate the slight intensity change caused by varying blood oxygen concentration from errors related to skin absorbance and venous blood (whose oxygen has already been taken up by cells), the signal processing algorithm isolates the AC portion of the signal, since within a reasonable range (~0.5 - 3 Hz) this corresponds to blood rushing through arteries with each heartbeat. This pulsatile arterial blood increases the optical path length of the measurement as blood pressure swells the arteries, producing periodic oscillations in the absorption signal. The other contributors to absorption, such as tissue and venous/capillary blood, are effectively constant in this frequency regime. By calculating the ratio of the AC and DC signals at each wavelength, then taking the ratio of these two absorption ratios, a value R can be determined which is only related to the relative concentration of oxyhemoglobin (O2Hb) and reduced hemoglobin (Hb):
...
As the photodiode sensor does not differentiate by wavelength, the device rapidly cycles between red, IR, and no LED, allowing the system to compensate for ambient light variation as well. The cycling speed must be substantially faster than the heart rate, since the ratio R assumes absorption at all wavelengths is carried out simultaneously in order to cancel out path length. R is then related to SpO2 using an empirically determined curve:
 Figure source, via Ohmeda Corp: Pologe, Jonas A. "Pulse oximetry: technical aspects of machine design." International anesthesiology clinics 25.3 (1987): 137-153.
Note that methemoglobin (MetHb) and carboxyhemoglobin (COHb) are not factored in with this method and will thus cause systematic errors; the above calculation assumes these two compounds are minimally present. Additional wavelengths are needed to quantify all four hemoglobin species.
 Detailed information about the apparatus, including firmware and CAD files, can be found here.
Several data sets were logged, including during a walk home from lab and a strenuous hike up 30 flights of stairs. In both cases, despite the use of a tight-fitting mask, the calculated SpO2 from the commercial pulse oximeter did not vary by more than a percentage point, providing minimal insight into the device's algorithm. For the final dataset, I simply held my breath as long as I could, managing to reduce the measurement to a low-but-still-not-dangerous 91%. Note my pulse rate was still elevated, as this test occured soon after climbing Eastgate and the pandemic hasn't been great for my cardiovascular health. Here is a plot of the Zacurate sensor readings over ~a minute:
 The two raw sensor readings were sampled at 5 kHz, so the oscillations are hard to make out over the whole log despite using tiny markers in matplotlib:
 Zooming in on the time axis and adding lines, one can make out the two alternating pulses from each sensor:

 Already, a few interesting findings emerge from the untouched data. First, the rise/fall time of the Zacurate raw sensor data is faster than the ADC sample rate, while the fab sensor shows clear midpoints before reaching its maximum values. Since the same ADC peripheral is used in both cases, this suggests the preamplifier or photodiode slew rate may be to blame. I used an Advanced Photonix PDB-C154SM photodiode with a 10-90% response time at 660 nm and 10 VDC bias of 10 ns, and an Analog Devices AD8605 op-amp with a slew rate of 5 V/us; both specifications are well beyond the 200 us sample rate so the source of the slope needs more investigation.
Another noteworthy observation is that the Zacurate sensor uses much more of the 0-3.3 VDC range of the Teensy's 12-bit ADC. This may be due to the slight translucence of the 3D printed finger sleeve letting in ambient light, or the LEDs being driven to higher light output values than is optimal for a fingertip sensor. Both conditions likely exist; the former is demonstrated by the unstable baseline reading from the fab sensor when the LEDs are off, while the latter is clearly shown when the fab sensor saturates from ~7-17 seconds and again around 40 seconds. Regardless of cause, the Zacurate front-end yields an additional bit or two of data resolution.
 Zooming in again, the two raw values are starting to look a lot like a pulse, at least in terms of period:
 Taking the Fourier transform of pulse_0 shows a peak around 0.7 seconds (1.42 Hz), corresponding to a pulse rate of 85 BPM, which sounds about right given my recent stair-climbing exercise:
 Next, each pulse needs to be isolated from both the background light level and from non-pulsatile blood. The former is accomplished by subtracting the previously isolated background signal, while the latter is removed by dividing the minimum value from the pulse train. The two datapoints, pulse_0 and pulse_1, are combined into a single np.array with a common time axis (introducing a slight error, as discussed earlier) and the matching background signal is subtracted from each. Then, the pulses are normalized on a rolling basis by dividing by the minimum value from an empirically chosen sampling period (in this case, ~1.5 Hz). After dividing pulse_0 from pulse_1 the result still shows a good deal of noise from the original waveform, as shown here in a zoomed in section:
 Dividing the two signals at a rolling maximum value for each beat shows less noise but still no clear correlation with the recorded SpO2 values:
 A more sophisticated approach centers the averaging window on the current value; plotting these rolling values with the background-subtracted pulse signal shows good agreement with an averaging period of +/- 50 data points:
 Discrete points for each heartbeat signal are then identified by capturing data slices when the current values are equal to the maximum; this is done for both the pulse_0 and the pulse_1 signals. Finally, maximums are divided by minimums, and then pulse_0 is divided by pulse_1 and the resulting curve plotted alongside the displayed SpO2 value:
 The correlation is clear but some distinct discrepancies appear, particularly in the first part of the data. A worthwhile future exercise would be to collect additional data plots during fluctuating SpO2 states to perform a more extensive comparison to determine if the discrepancy around t < 15 s is real. Having said that, the relationship between the two values is clear enough to confirm the LED pulse order; since R is inversely proportional to the ratio of red and IR absorption and the calculated curve is pulse_1 / pulse_0, the first signal (pulse_0) is IR.
Applying the same algorithm to the fab sensor data is somewhat fraught, since a visual examination of the raw plot shows clear signal clipping at t < 20 s and t > 40 s. As expected, the data is does not show a strong relationship between recorded SpO2 and calculated R:
