The function is not described in the text, here is a wiki definition:
The global minimum is inside a long, narrow, parabolic shaped flat valley. To find the valley is trivial. To converge to the global minimum, however, is difficult. The function is defined by:
$$f=(1-x)^2 + 100(y-x^2)^2$$It has a global minimum at $(x,y) = (a,a^2)$, where $f(x,y)=0$. Usually, these parameters are set such that $a=1$ and $b=100$. Only in the trivial case where $a=0$ the function is symmetric and the minimum is at the origin.
We're going to plot 2D data on a 3D plot. Matplotlib provides an example here. Another example shows how to plot the surface of the map, in particular cmap
can be used to change colors. Further reading: a complete reference guide on colormaps in matplotlib. And this is documentation for np.linspace.
import numpy as np
import matplotlib.pyplot as plt
ax = plt.figure().add_subplot(projection='3d')
def rosenbrock(x, y):
return (1-x)**2 + 100*(y-x**2)**2
x = np.linspace(-2, 2, 100)
y = np.linspace(-1, 3, 100)
X, Y = np.meshgrid(x, y)
Z = rosenbrock(X, Y)
# Plotting
surf = ax.plot_surface(X, Y, Z, cmap='twilight')
ax.set_xlabel('x')
ax.set_ylabel('y')
ax.set_zlabel('z')
ax.set_title('Rosenbrock Function')
plt.show()
For drawing the contour, np.logspace is used. This returns numbers spaced evenly on a log scale.
numpy.logspace(start, stop, num=50, endpoint=True, base=10.0, dtype=None, axis=0)
Where num
is the number of samples to generate.
import numpy as np
import matplotlib.pyplot as plt
fig, ax
def rosenbrock(x, y):
return (1-x)**2 + 100*(y-x**2)**2
x = np.linspace(-2, 2, 100)
y = np.linspace(-1, 3, 100)
X, Y = np.meshgrid(x, y)
Z = rosenbrock(X, Y)
levels = [1e-2, 1e-1, 1e0, 1e1, 1e2, 1e3, 1e4, 1e5]
plt.contour(X, Y, Z, levels=np.logspace(-1, 3, 20), cmap='cool')
plt.xlabel('x')
plt.ylabel('y')
plt.title('Rosenbrock Function')
plt.show()
import numpy as np
import matplotlib.pyplot as plt
fig, ax = plt.subplots(1,1)
def rosenbrock(x, y):
return (1-x)**2 + 100*(y-x**2)**2
x = np.linspace(-2, 2, 100)
y = np.linspace(-1, 3, 100)
X, Y = np.meshgrid(x, y)
Z = rosenbrock(X, Y)
plt.contourf(X, Y, Z, levels=np.logspace(-1, 3, 20), cmap='cool')
plt.xlabel('x')
plt.ylabel('y')
plt.title('Rosenbrock Function')
plt.show()
Next step: learning how to add a colorbar, because it is always good practice to explicitly clarify units and values.
import numpy as np
import matplotlib.pyplot as plt
import matplotlib as mpl
fig, ax = plt.subplots(1,1)
def rosenbrock(x, y):
return (1-x)**2 + 100*(y-x**2)**2
x = np.linspace(-2, 2, 100)
y = np.linspace(-1, 3, 100)
X, Y = np.meshgrid(x, y)
Z = rosenbrock(X, Y)
# Define the colormap with cmap and norm
cmap = mpl.cm.cool # Setting the color
norm = mpl.colors.Normalize(vmin=None, vmax=None) # Setting to none, to map the values.
# Plot contour with colormap
contour = ax.contourf(X, Y, Z, levels=np.logspace(-1, 3, 20), cmap=cmap, norm=norm)
# Add colorbar
cbar = plt.colorbar(contour)
plt.xlabel('x')
plt.ylabel('y')
plt.title('Rosenbrock Function')
plt.show()
Let's break this question down by interpreting its definitions. The Downhill Symplex method is also called the Nelder-Mead method. According to the textbook "Of all algorithms it arguably provides the most functionality for the least amount of code, along with the most entertainment." This sounds fantastic.
Next up, "A simplex is a geometrical figure that has one more vertex than dimension: a triangle in 2D, a tetrahedtron in 3D, and so forth."
Then for a stopping criterion, let's see what ChatGPT has to say:
A stopping criterion is a condition that determines when the algorithm should terminate and return the current best estimate of the minimum. In a downhill simplex algorithm, there are several stopping criteria that can be used. Here are some common ones:
1. Maximum number of iterations: The algorithm terminates after a specified number of iterations, even if the convergence criteria have not been met.
2. Function value tolerance: The algorithm terminates when the change in the function value between iterations falls below a specified threshold.
3. Parameter tolerance: The algorithm terminates when the change in the parameters between iterations falls below a specified threshold.
4. Gradient tolerance: The algorithm terminates when the norm of the gradient (i.e., the vector of partial derivatives) falls below a specified threshold.
5: Absolute error tolerance: The algorithm terminates when the difference between the current estimate of the minimum and the true minimum falls below a specified threshold.
6: Relative error tolerance: The algorithm terminates when the ratio of the absolute error to the true minimum falls below a specified threshold.
The choice of stopping criterion depends on the problem at hand and the desired level of accuracy. It is common to use a combination of criteria to ensure that the algorithm converges reliably.
Lastly, a hint from Neil: figure 15.1 is key in solving this problem set, then the equations.
First step: calculate the center of the face of the simplex defined by all of the vertices other than the one we're trying to improve:
$$\vec x_{mean} = \frac{1}{D} \sum_{i=2}^{D+1} \vec x_i$$Next step is to reflect the point across the face:
$$\begin{align} \vec x_1 \rightarrow \vec x_1^{new} & = \vec x_{mean} + (\vec x_{mean} - \vec x_i) \\ & = 2\vec x_{mean} \end{align}$$import numpy as np
import matplotlib.pyplot as plt
import matplotlib as mpl
fig, ax = plt.subplots()
def rosenbrock(x, y):
return (1-x)**2 + 100*(y-x**2)**2
plot_x = np.linspace(-2, 1, 100)
plot_y = np.linspace(-2, 3, 100)
X, Y = np.meshgrid(plot_x, plot_y)
Z = rosenbrock(X, Y)
# Create simplex vertices (three points)
# Method 2 - all points in one array. Better on the long run.
simplex_vertices = np.array([
[-1, -1], # First point given by Neil (y = x = -1)
[ 0, -1],
[-1, 0],
], dtype=float)
# Create points
'''
Notes: before colon is row, after colon is column
'''
print(f'Point 1 coordinates:', simplex_vertices[0]) # First point
print(f'Point 2 coordinates:', simplex_vertices[1]) # Second point
print(f'Point 3 coordinates:', simplex_vertices[2]) # Third point
print(simplex_vertices[:,0]) # Gives first column of the matrix
# Nelder-mead step
def nelder_mead_step(simplex_vertices, objective_function):
# Define objective_function
objective_function = np.array([objective_function(x) for x in simplex_vertices])
# return np.mean() for 1/D
print('Mean:', np.mean(y))
print('Standard deviation:', np.std(y))
# Function for reflect
#def simplex_reflect():
# Colormap settings
cmap = mpl.cm.cool # Setting the color
norm = mpl.colors.Normalize(vmin=None, vmax=None) # Setting to none, to map the values.
contour = ax.contourf(X, Y, Z, levels=np.logspace(-1, 3, 20), cmap=cmap, norm=norm) # Log
cbar = plt.colorbar(contour)
# Plotting
plt.scatter(simplex_vertices[:,0], simplex_vertices[:,1], color='blue', marker='x') # Plotting the three points
plt.plot(simplex_vertices[:,0], simplex_vertices[:,1], color='blue') # Drawing a line between points
plt.xlabel('x')
plt.ylabel('y')
plt.title('Rosenbrock Function')
plt.show()
Point 1 coordinates: [-1. -1.] Point 2 coordinates: [ 0. -1.] Point 3 coordinates: [-1. 0.] [-1. 0. -1.] Mean: 1.0 Standard deviation: 1.166305860514025
Changing the colorplot.
import numpy as np
import matplotlib.pyplot as plt
import matplotlib as mpl
fig, ax = plt.subplots()
def rosenbrock(x, y):
return (1-x)**2 + 100*(y-x**2)**2
plot_x = np.linspace(-2, 1, 100)
plot_y = np.linspace(-2, 3, 100)
X, Y = np.meshgrid(plot_x, plot_y)
Z = rosenbrock(X, Y)
# Create simplex vertices (three points)
'''
Method 1 - all points separate. Drawback is that it doesn't scale to more dimensions.
x1 = np.array([-1, -1], dtype=float) # Given by Neil
x2 = np.array([0, -1], dtype=float)
x3 = np.array([-1, 0], dtype=float)
vertex_list = [x1, x2, x3]'''
# Method 2 - all points in one array. Better on the long run.
simplex_vertices = np.array([
[-1, -1], # Starting point given by assignment
[ 0, -1],
[-1, 0],
], dtype=float)
# First point
print(simplex_vertices[0])
# Second point
print(simplex_vertices[1])
# Third point
print(simplex_vertices[2])
# Gives first column of the matrix
print(simplex_vertices[:,0])
'''
Notes:
Before colon is row
After colon is column
'''
# Colormap settings
# levels = [1e-2, 1e-1, 1e0, 1e1, 1e2, 1e3, 1e4, 1e5]
cmap = mpl.cm.cool # Setting the color
norm = mpl.colors.Normalize(vmin=None, vmax=None) # Setting to none, to map the values.
contour = ax.contourf(X, Y, Z, levels=np.logspace(-1, 3, 20), cmap=cmap, norm=norm)
cbar = plt.colorbar(contour, ticks=[1e0, 1e1, 1e2, 1e3])
# Plotting
plt.scatter(simplex_vertices[:,0], simplex_vertices[:,1], color='blue', marker='x')
plt.xlabel('x')
plt.ylabel('y')
plt.title('Rosenbrock Function')
plt.show()
[-1. -1.] [ 0. -1.] [-1. 0.] [-1. 0. -1.]
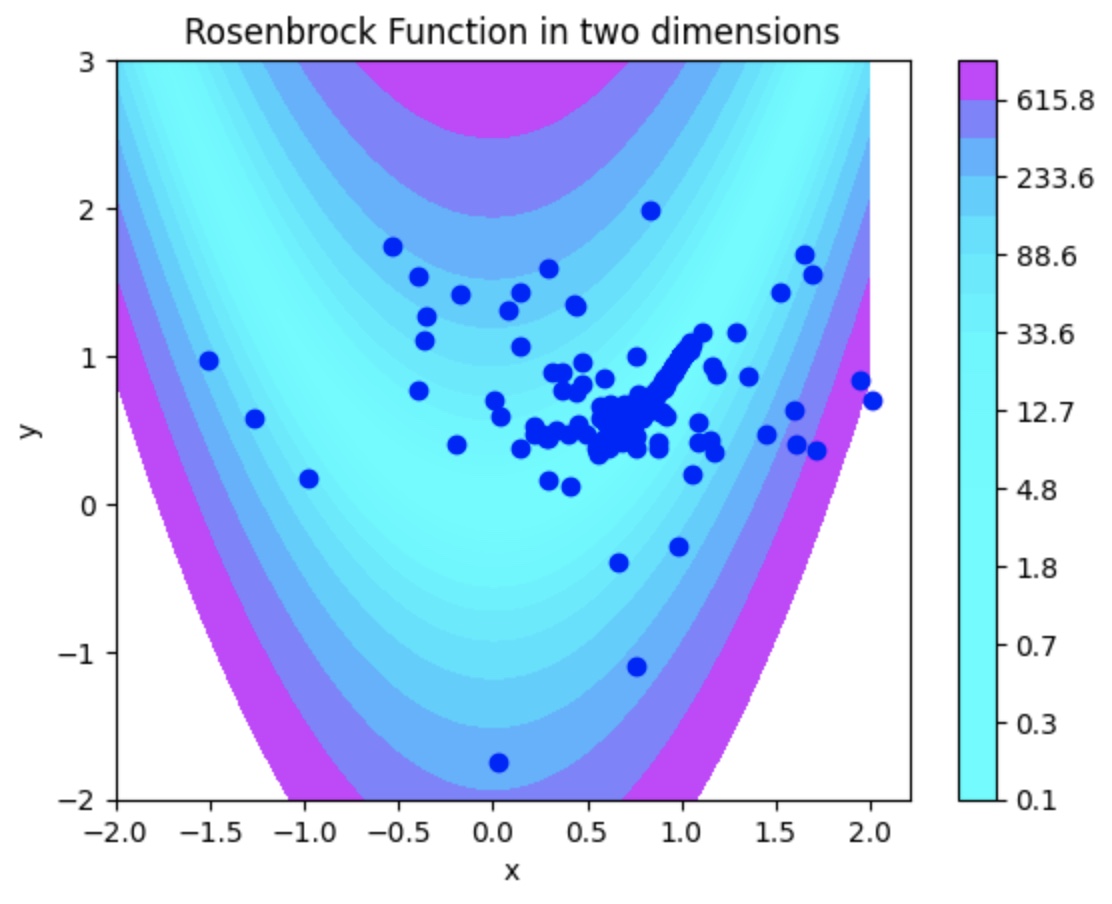
During the final project, I decided to go back to this week and try again. With newly found skills in Google Colab, I was able to import the CMAES library and run the algorithm!
It succeeded! Enter Notebook Here.