How To Make (almost) Anything
Daphne Basangwa
Week 9: Interface and Application Programming
For this week, I worked to create an interface to display the output of my input device graphically.
I used a piezo sensor as input and graphed signals in processing.
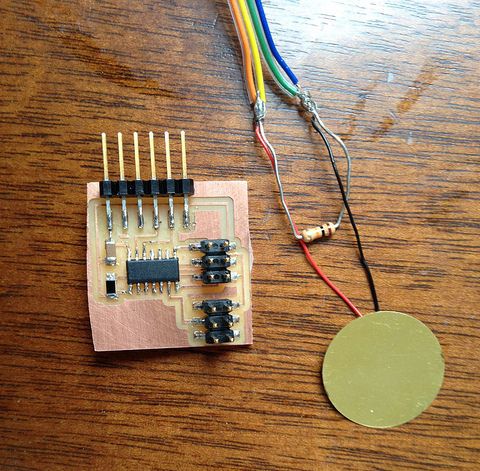
My application is a program that graphically displays knocking signals against a moving frame.
I wrote my program to receive analog output from the piezo sensor in Arduino and print it to one of my serial ports.
I imported the Arduino SoftwareSerial Library to do this.
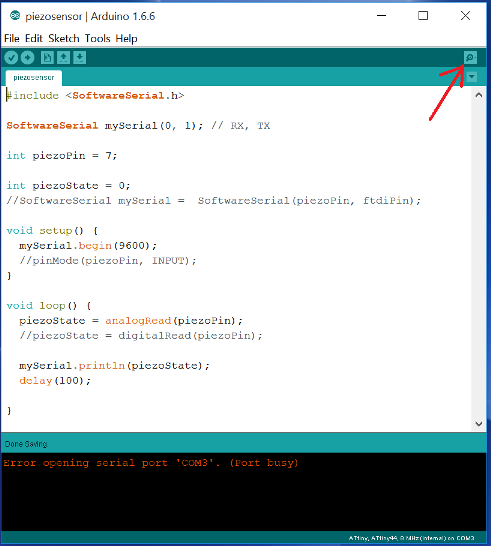
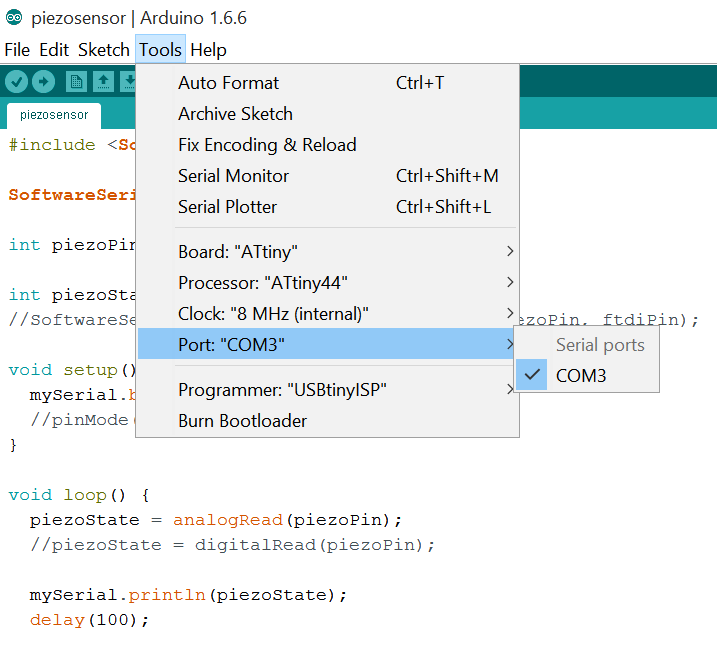
One step that took me a really long time to solve was setting the serial port in Arduino. This is quick and easy.
Once the port and set up and the code uploaded, you can visually monitor the serial monitor by opening the Serial Monitor window in Arduino.
 Here is my Arduino sketch
#include <SoftwareSerial.h>
SoftwareSerial mySerial(0, 1); // RX, TX
int piezoPin = 7;
int piezoState = 0;
void setup() {
mySerial.begin(9600);
}
void loop() {
piezoState = analogRead(piezoPin);
mySerial.println(piezoState);
s
//Do this every one second.
delay(1000);
}
You can see in my sketch that I set the program to receive an imput every 100miliseconds
delay(100);
I set this time from trial and error.
I found that a lower frequency was too high for the program to register any meaningful readings from the piezo.
Any higher was too slow, and often the program would lose good data points.
In Processing, I imported values from this serial port and graphed them on a dynamic display.
import processing.serial.*;
Serial myPort; // The serial port
int xPos = 1; // horizontal position of the graph
float inByte = 0;
void setup () {
// set the window size:
size(400, 300);
// List all the available serial ports
// if using Processing 2.1 or later, use Serial.printArray()
printArray(Serial.list());
myPort = new Serial(this, Serial.list()[0], 9600);
background(255);
}
void draw () {
// draw the line:
stroke(127, 34, 255);
line(xPos, height, xPos, height - inByte);
// at the edge of the screen, go back to the beginning:
if (xPos >= width) {
xPos = 0;
background(255);
} else {
// increment the horizontal position:
xPos++;
}
}
void serialEvent (Serial myPort) {
// get the ASCII string:
String inString = myPort.readStringUntil('\n');
if (inString != null) {
// trim off any whitespace:
inString = trim(inString);
// convert to an int and map to the screen height:
inByte = float(inString);
println(inByte);
inByte = map(inByte, 0, 1023, 0, height);
}
}
Here is an example of one frame of an output graph.
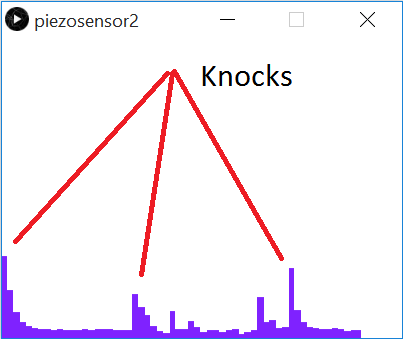
You will notice that I scaled my serial data from a 0 - 1023 range to the range of the height of my window.
This is because the Analog data ranges betwewen 0 and 1025.
I like processing because of how simple it is to plot.