Week 8: Output Devices
From stereo to visuals
Fall 2015
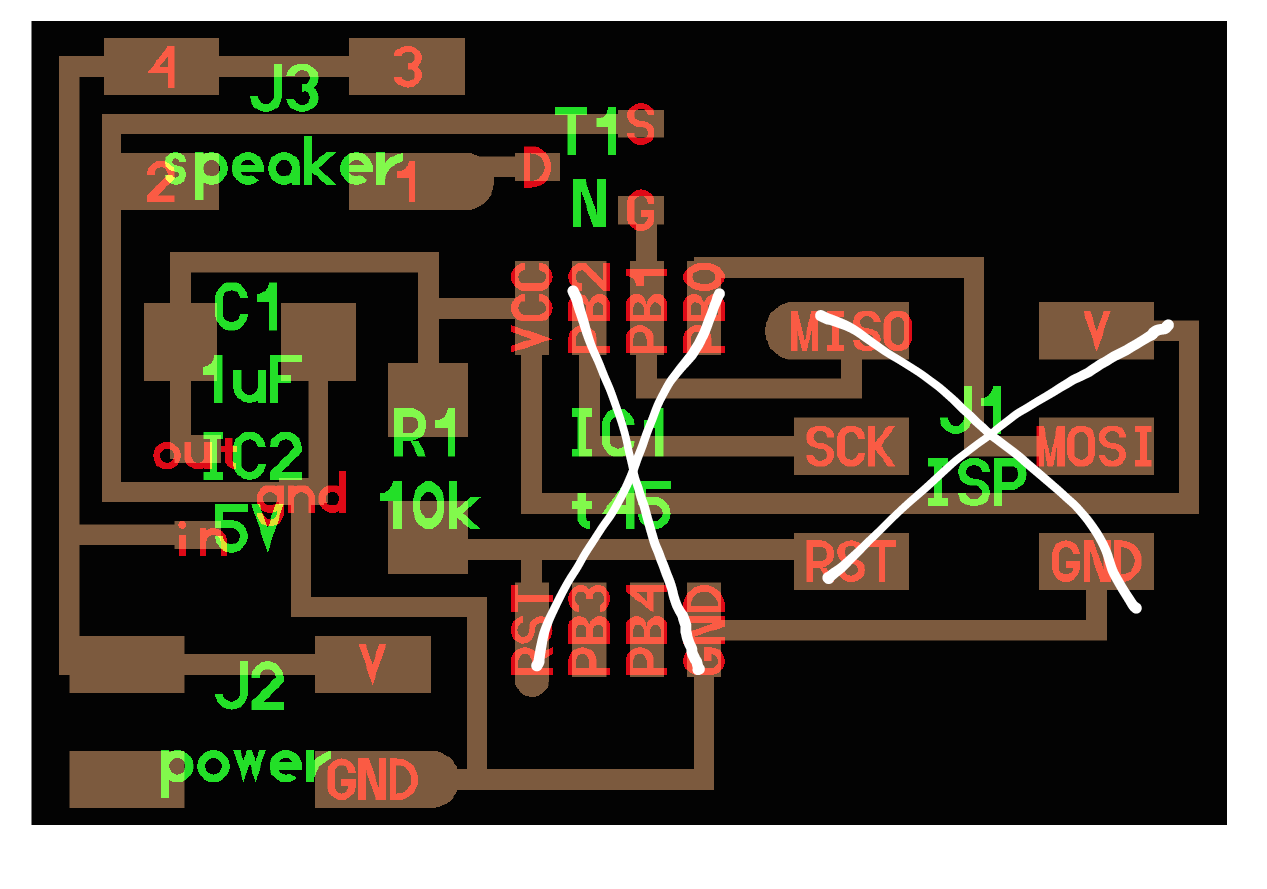
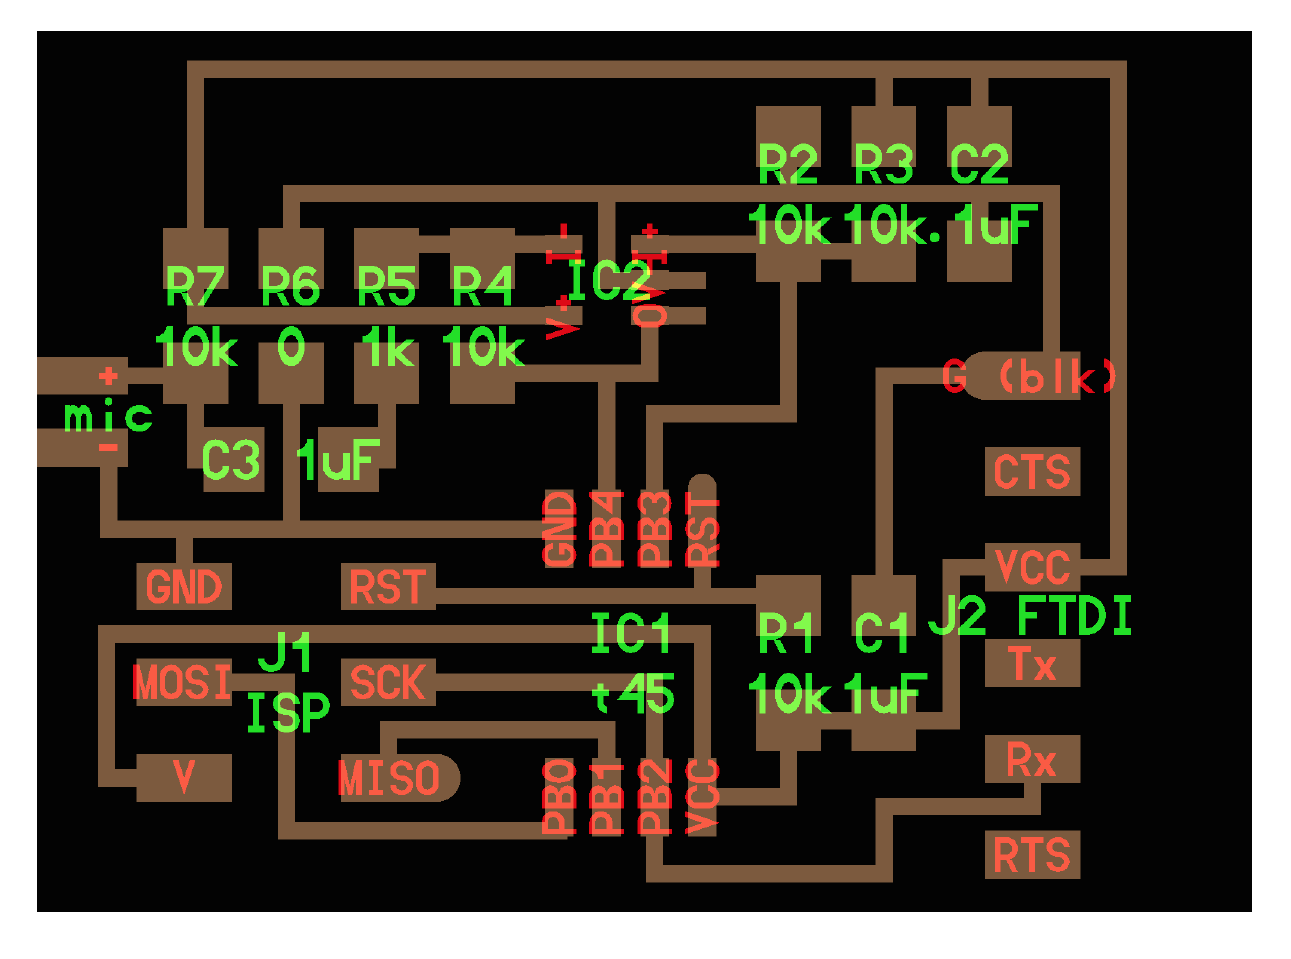
This week, we were set with the task of building an output device; class notes are here. I wanted to start tackling elements of my final project of building an EEG. Since the EEG will involve inputting voltage from the leads coming from a user's head and the output will be sounds or graphs based on the signal, I played with a few designs. One idea was to combine the speaker board from this week and the microphone for next week's input assignment. The other idea was to figure out how I would visualize my signal in my EEG project.
For the first idea - a combined speaker and microphone board - I used the speaker board: http://academy.cba.mit.edu/classes/output_devices/speaker/hello.speaker.45.png and the microphone board: http://academy.cba.mit.edu/classes/input_devices/mic/hello.mic.45.png.
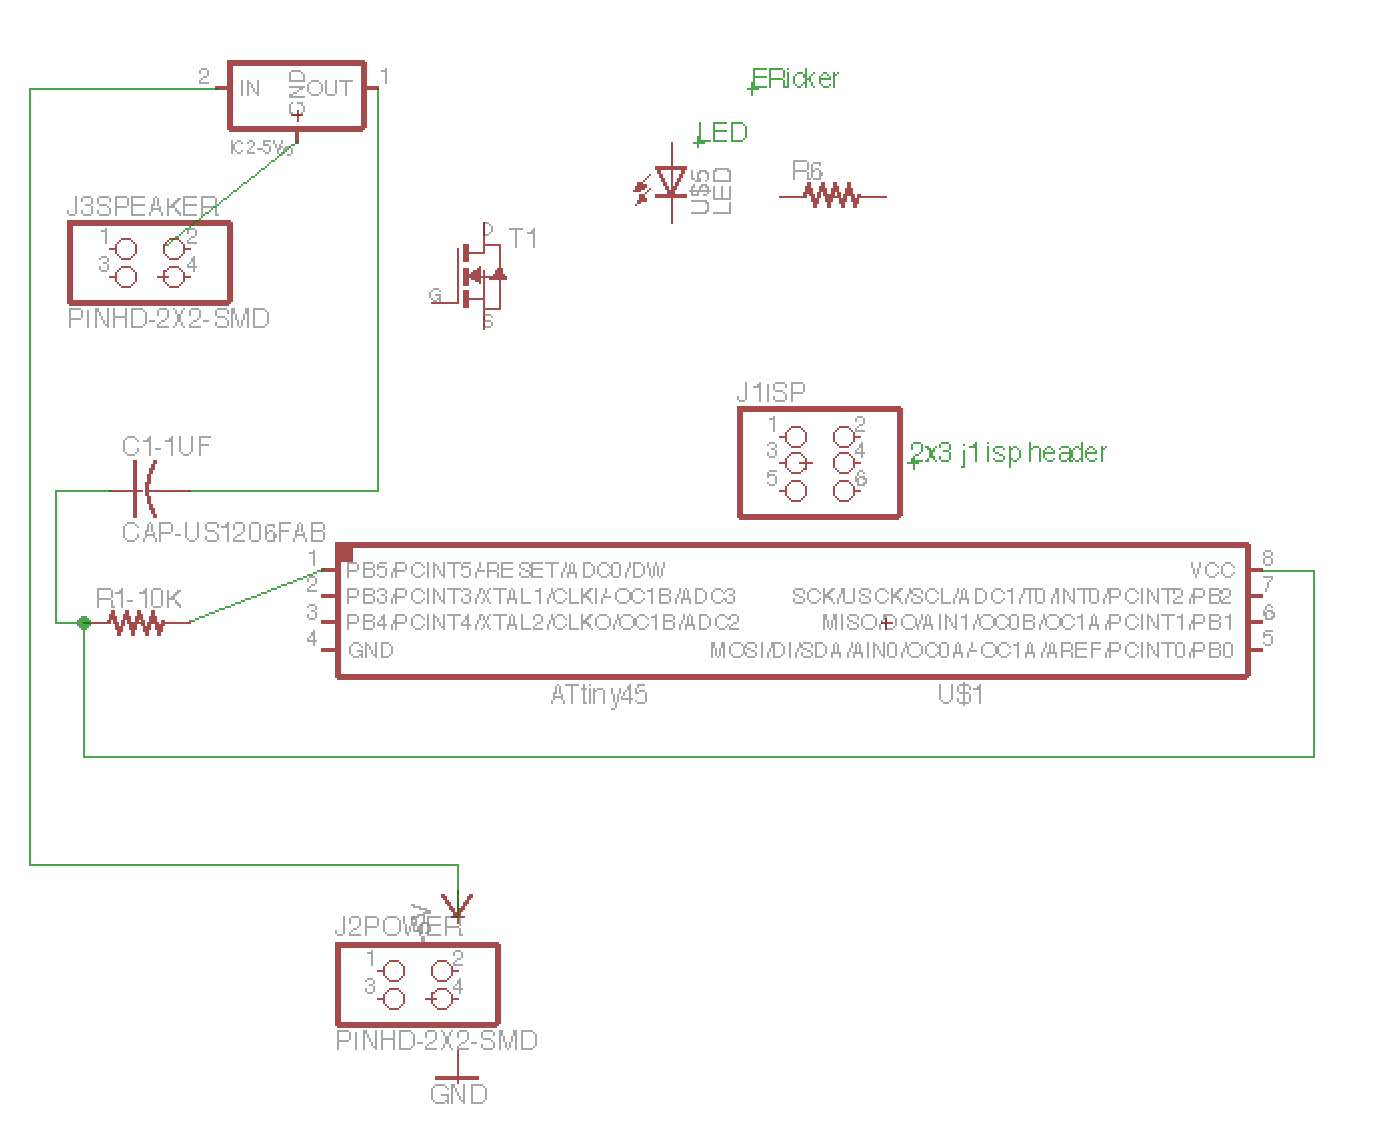
In order to optimally combine the input and output week, I decided to create an optimized board that pulled the relevant prats of the speaker board and the microphone. First, I modified the stereo output design by only including input power and the 5 volt regulator (preventing voltage from going higher than 5v), but deleting the t45 and the isp. I used pb0 or pb1, and I decided to use the hardware to change the pwm frequency.


 Ultimately, though, I decided not to go this route. A few reasons: the number of components involved in this design was higher than I want for my final project (I'm aiming for under 15). So, I decided to start the spiral design cycle for my EEG project. Ultimately, I realized that I wanted to use the simple .
Since I'll use Audacity and Physics Oscilloscope for the first part of my spiral development in the final project, but they obfuscate how they do the visualization, I found a description for how to visualize a signal coming in from Chipstein's site an Arduino based EEG set up and spent a lot of time understanding it.
// SET FOR 5 SECONDS EEG, 180 Hz. A LONGER DISPLAY MAY RUN SLOW,
// DEPENDING ON THE SPEED OF YOUR CPU.
import processing.serial.*;
Serial port; // Create object from Serial class
int val; // Data received from the serial port
int cnt;
int hht;
int wm1;
int[] values;
void setup()
{
size(900, 400); //currently set to 5 sec
// Open the port that the board is connected to and use the same speed (19200 bps)
port = new Serial(this, Serial.list()[0], 19200);
values = new int[width];
hht = 750; // Sets display DC offset; must adjust if gain is changed#
wm1= width-1;
cnt = 1;
frameRate(180); //read/draw 180 samples/sec
for (int s=0;s
Another area for comparison in trying to understand the broader question of oscilloscopes is in Processing. It is at http://accrochages.drone.ws/sites/accrochages.drone.ws/files/Oscilloscope.pde: That code is under a GNU Public License. It expects port 0 to be the origin of the Arduino signal.
import processing.serial.*;
Serial port; // Create object from Serial class
int val; // Data received from the serial port
int[] values;
void setup()
{
size(640, 480);
// Open the port that the board is connected to and use the same speed (9600 bps)
port = new Serial(this, Serial.list()[0], 9600);
values = new int[width];
smooth();
}
int getY(int val) {
return (int)(val / 1023.0f * height) - 1;
}
void draw()
{
while (port.available() >= 3) {
if (port.read() == 0xff) {
val = (port.read() << 8) | (port.read());
}
}
for (int i=0; i