Week 12: Interfaces
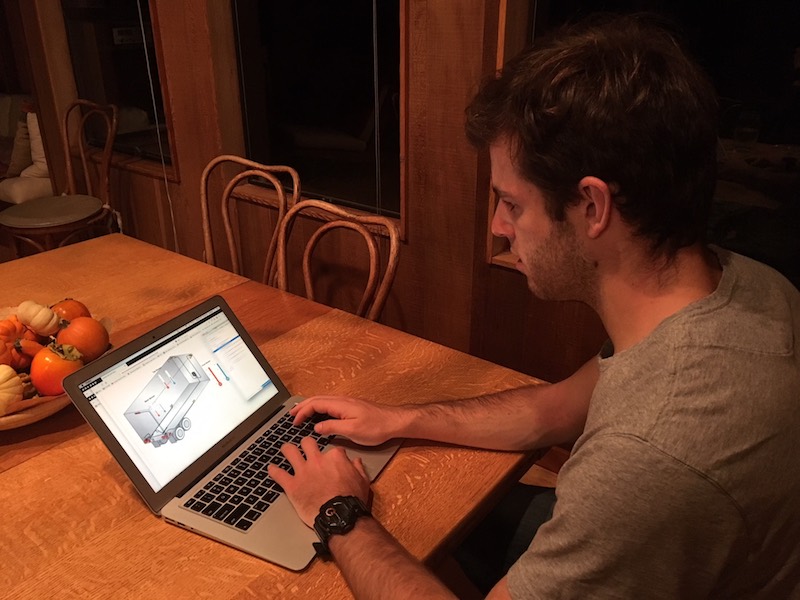
This week I learned an awful lot about programming! I was lucky to be home in California for Thanksgiving, where I could pester my brother about all the things that I don't know how to make instead of my housemates and TAs. So here's my brother Albie, software engineer and founder of the parking app Spotter, helping me build a web app and sensor interface.
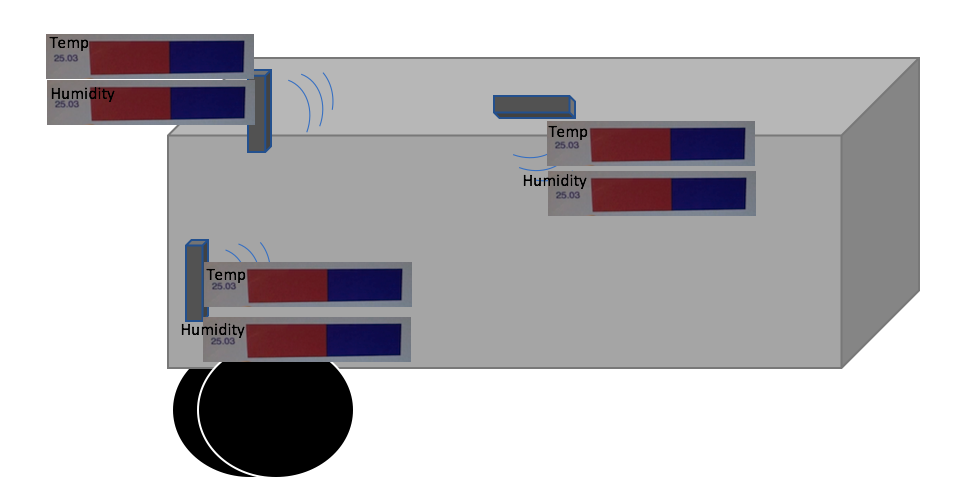
My initial plan was to do something simple and straightforward using just Python with Tkinter, especially since Thras helped me get that all working last week. So I read through Neil's temperature code a few times and came up with a vague plan to position 6 different bars (two bars for each of the three joint temperature/humidity sensors) on a diagram of the trailer in which I'm building an evaporative cooler. It would look something like this.
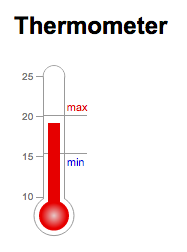
But then I showed this to Albie who, as a professional, insisted that Python interfaces just can't look as stylish as a graphical user interface (GUI) built with Javascript and CSS. I probably couldn't use the trailer image in the background, and besides I wouldn't have hundreds of existing image libraries to choose from. Instead, Albie suggested I find a Javascript image of a thermometer to build upon-- so I picked this one by David Banks, which was built with SVG.
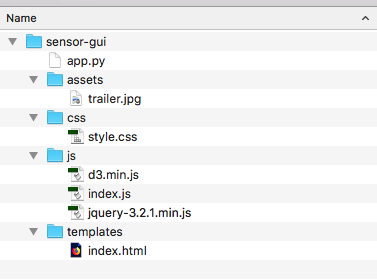
The next step to building a web app was to create a folder with all the necessary documents: a main index in HTML, the CSS stylesheet, and the Javascript code copy-pasted from David's thermometer. I also needed to install the d3 (Data-Driven Documents) package for data visualization, so I could actually use the thermometer with real data. With considerable help from Albie, I made a much prettier version of a web app that can display all six inputs of temperature and humidity data. We first tested the interface with a random number generator within Javascript to ensure that the thermometer and humidity gauges all animated properly, and then we had to figure out how to integrate this functional web app with the actual sensor data.
This part turned out to be nontrivial. Python was the obvious choice for pulling data from the sensors via the serial port, and then we needed to install Flask to create a RESTful application programming interface (API) to send data to the web GUI. We also had to employ Ajax for network requests (GET/PUT) requests on the GUI side. When you run the Python code (via the command line), it sets up a local host on port 5000 to generate random numbers that oscillate around mostly-reasonable temperature and humidity values-- and all those values are then displayed in the GUI via your browser window. The temperature and humidity gauges oscillate and refresh as new numbers come in. The next step will be to debug the data-logging script, which should create a CSV on the desktop (or somewhere local) with all the logged values. Here's the web app in action!
In sum, I used Python with Flask (running on port 5000 on local computer) to create a restful API-- which interfaces with the frontend GUI web GUI that's built with Javascript, HTML, and CSS, with the addition of d3 for data visualization and Ajax for GET/PUT network requests. Within Python, I'll either use serial or the Adafruit_DHT sensor library (if I can figure out why it's not loading) to collect data from my sensors. Note that this is quite a leap in complexity from last week, where I just ran Neil's Python code (using NumPy and Tkinter libraries) and the whole GUI simply loaded in the command line.
Sadly I ran into some trouble actually interfacing my interface with the temperature sensor-- first I couldn't download the Adafruit sensor library (which supposedly contained a script for reading and logging temperature/humidity sensor data), then I couldn't find a functional ISP cable and my thermristor board may have been acting finicky. But the main problem was that I flew back from California with only a couple hours to spare before Wednesday's class, so I'll hopefully get it all sorted this week. Regardless, everything will have to be working in time to measure the temperature and humidity of my final evaporative cooler in a few weeks...
Click here for the current version of my web app (on GitHub)
Still to do for the electronics on my final project:
Update
In hindsight I was totally overambitious. But hey, at least I got the GUI working with my actual sensor data! Check out the details on my final page.