Week 13. Interface and Application Programming
Happy Thanksgiving! Afther last intense week, it was time to interface programming. This week, the assignment was to program any of our input or output devices to interact with our computer or in a app.
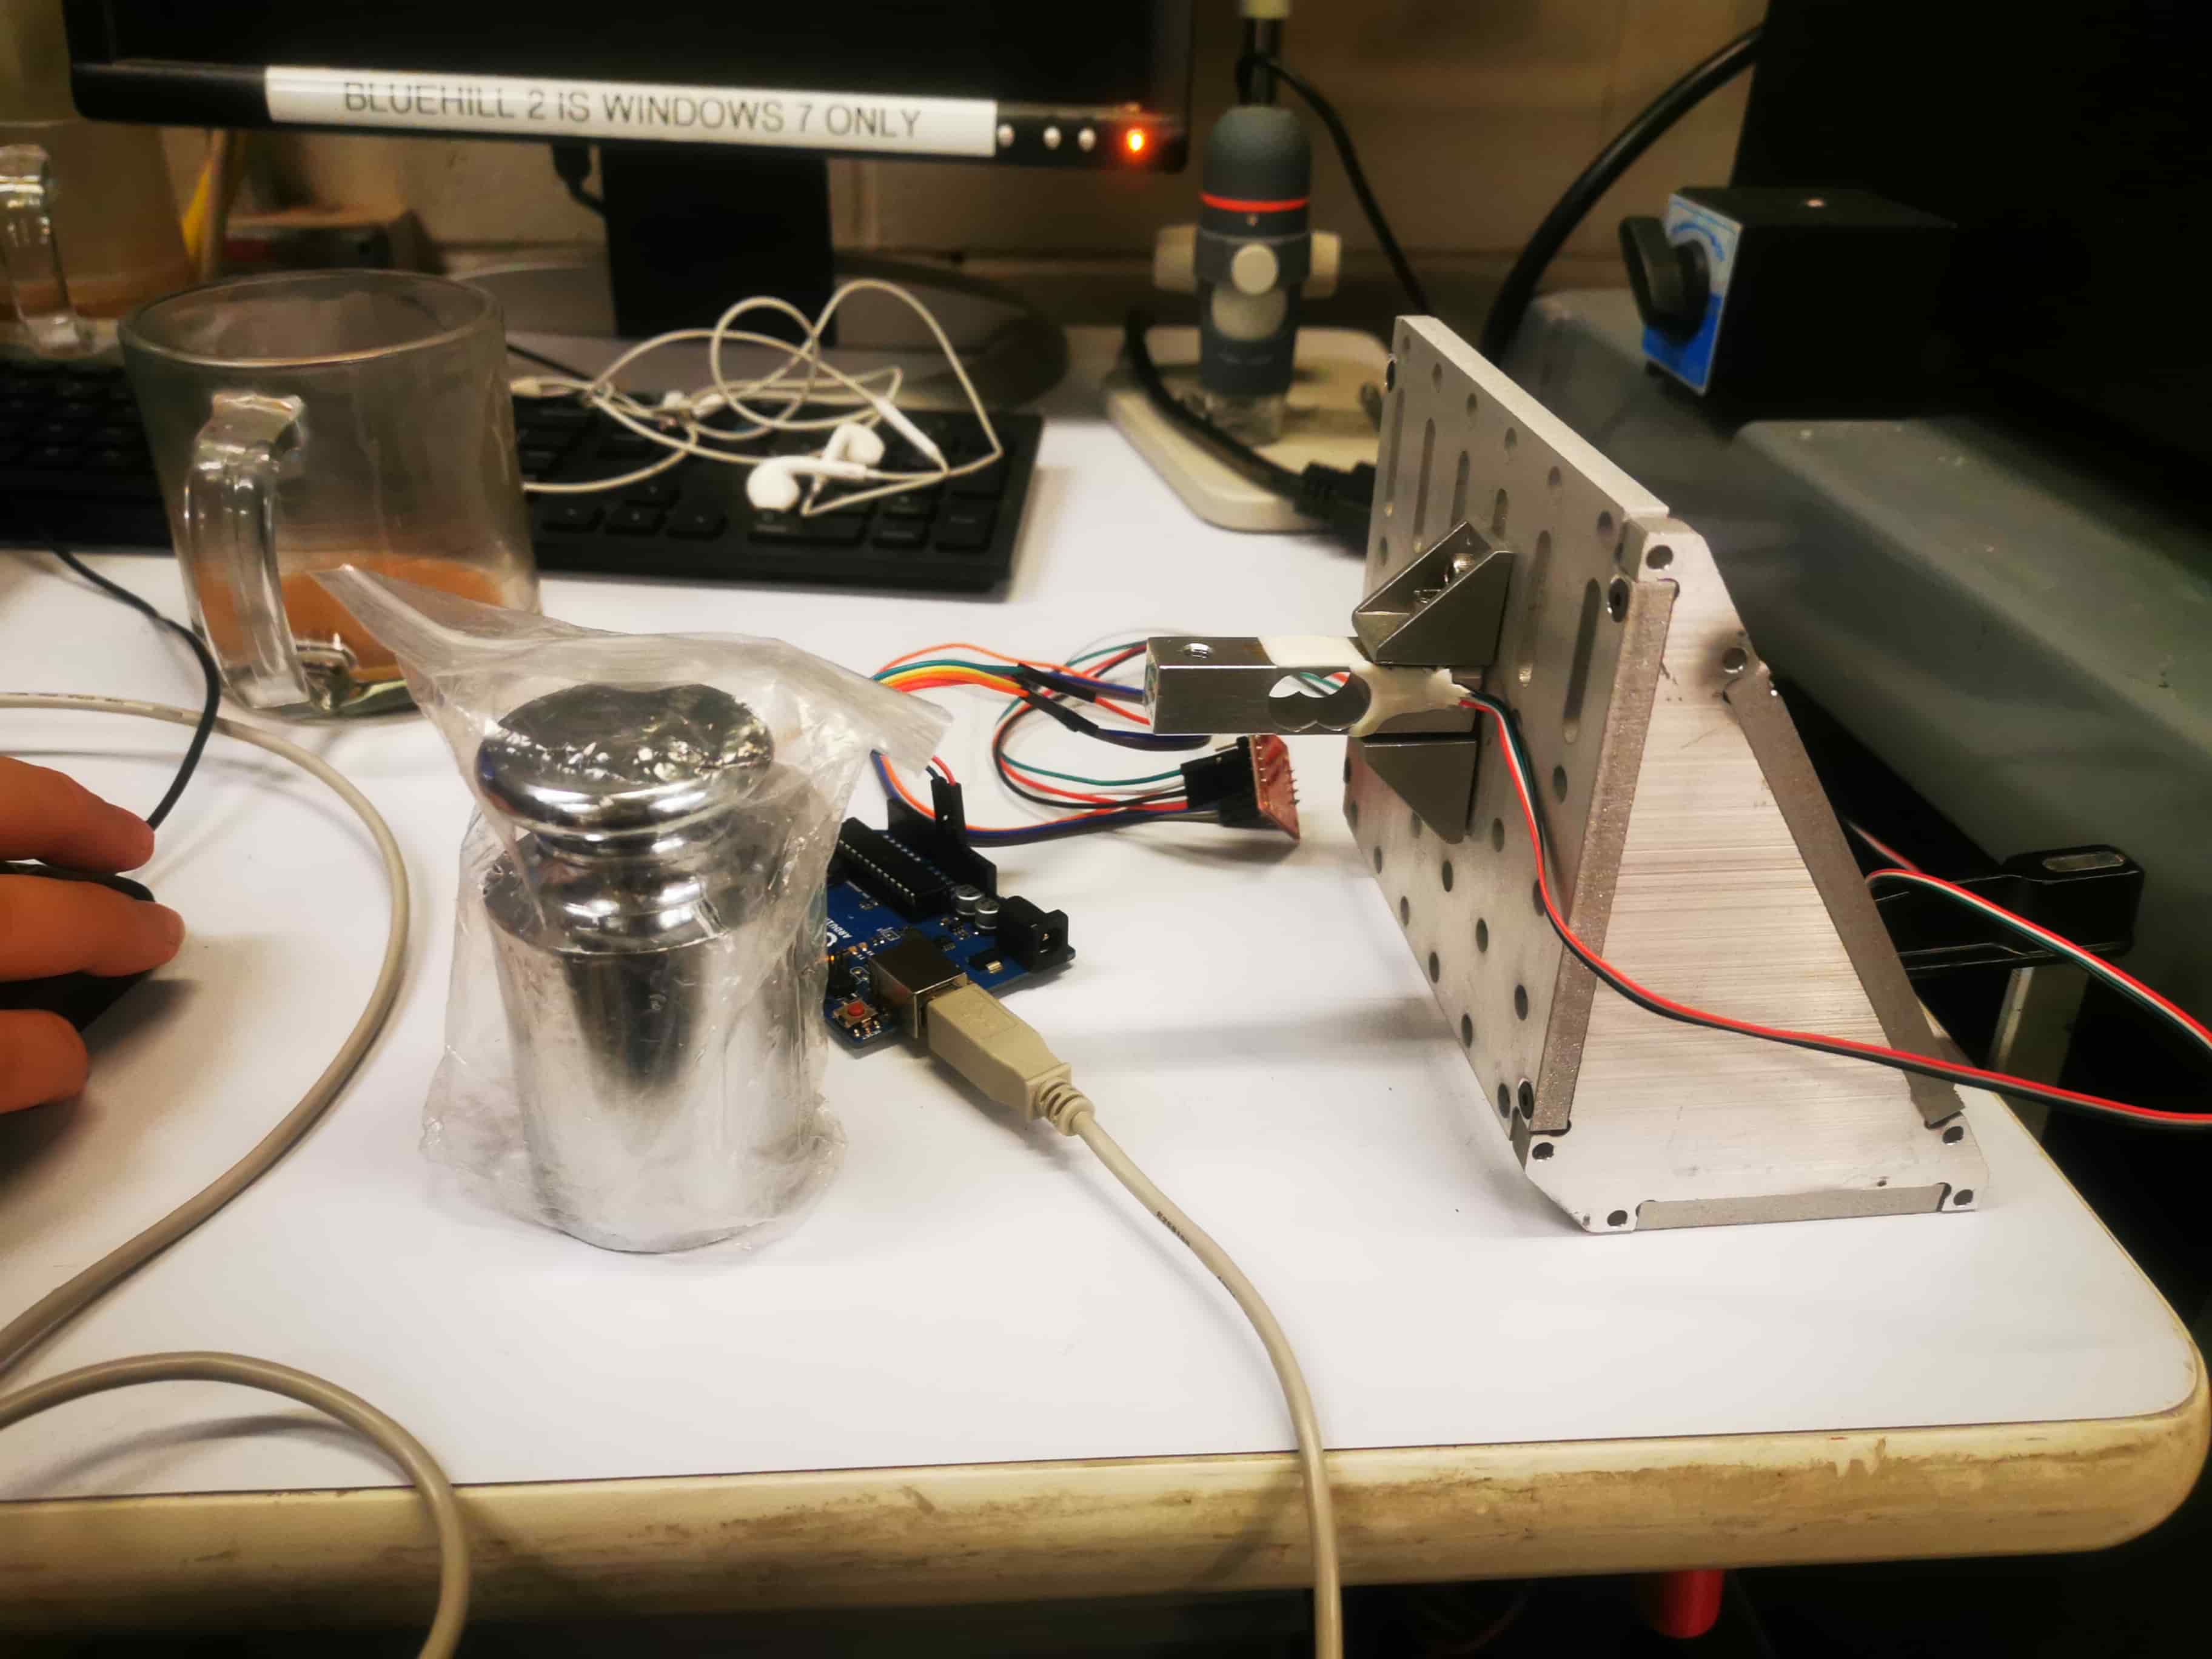
I decide to use this assignment to make the loadcell to interact by plotting live data in a line chart. The deadline for the windtunnel is getting close and I needed to see how coult I output the real data of the windtunnel. In a parallel way I designed a fancy bar composed by two flexures rotated 90 degrees but in the same bar! I will generate this shape by EDM it next week in the wildcard assignment.
I decided to explore two programming languages that I like, javascript, wich I know less, and python, a language that I am starting to be more and more confortable.
Javascript
The workflow from JavaScript diferes a little bit whith the one we will see in python due to in JS we are plotting in a local web server. To do that, we have to:
First, to download node.js in order to be able to run js in a local enviroment. Then, we will run the loadcell code inside an arduino ide. We will send the result in a serial port, and with Javascript we will read this value. The data type expulsed by the serial is a byte array, so we need to decode it into a strinng, and later into a number!. Once we have this data in a number form, we will plot it in a live stream.
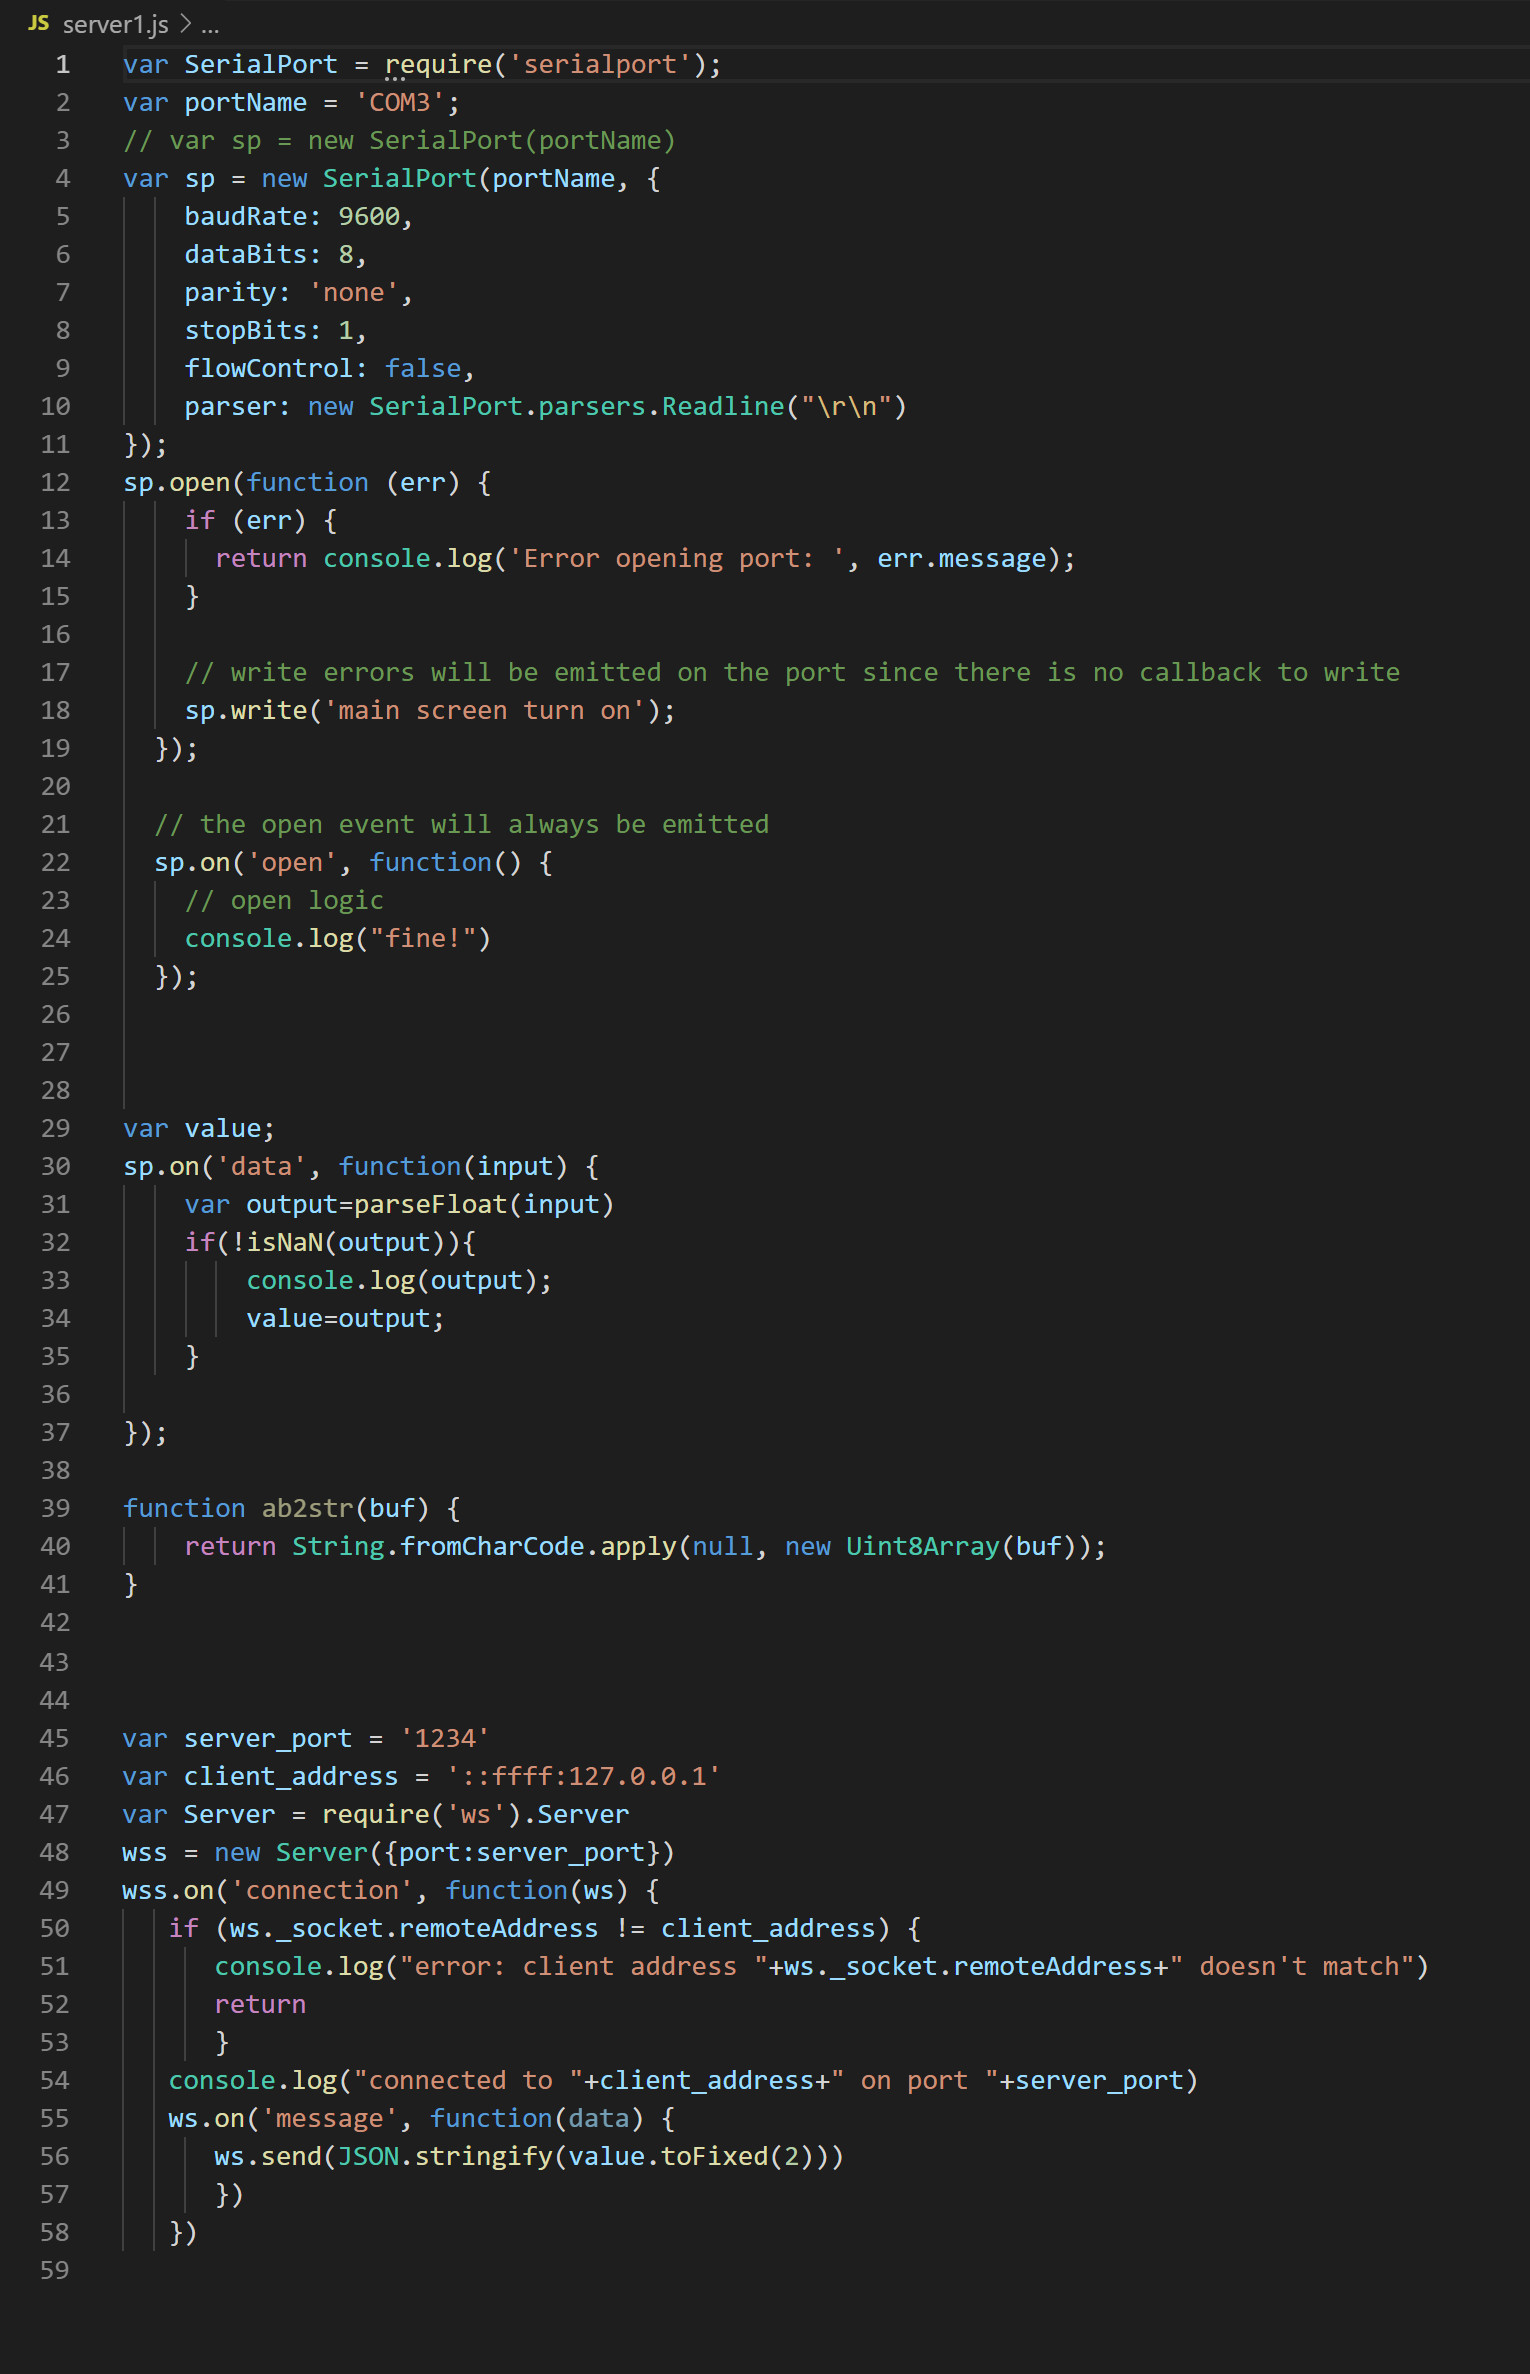
The code used for that prupose is splitted in 3 main files. 1st server.js generate a serial reading through the serial port. In my case, through COM3 at a baud rate of 9600. The code evaluate if the conection has succeded, read the values, filter the NaN and converts the byte array into a string. At the end of the code, it generates a server in which the data will be available by the costumer! (also us, but another code)
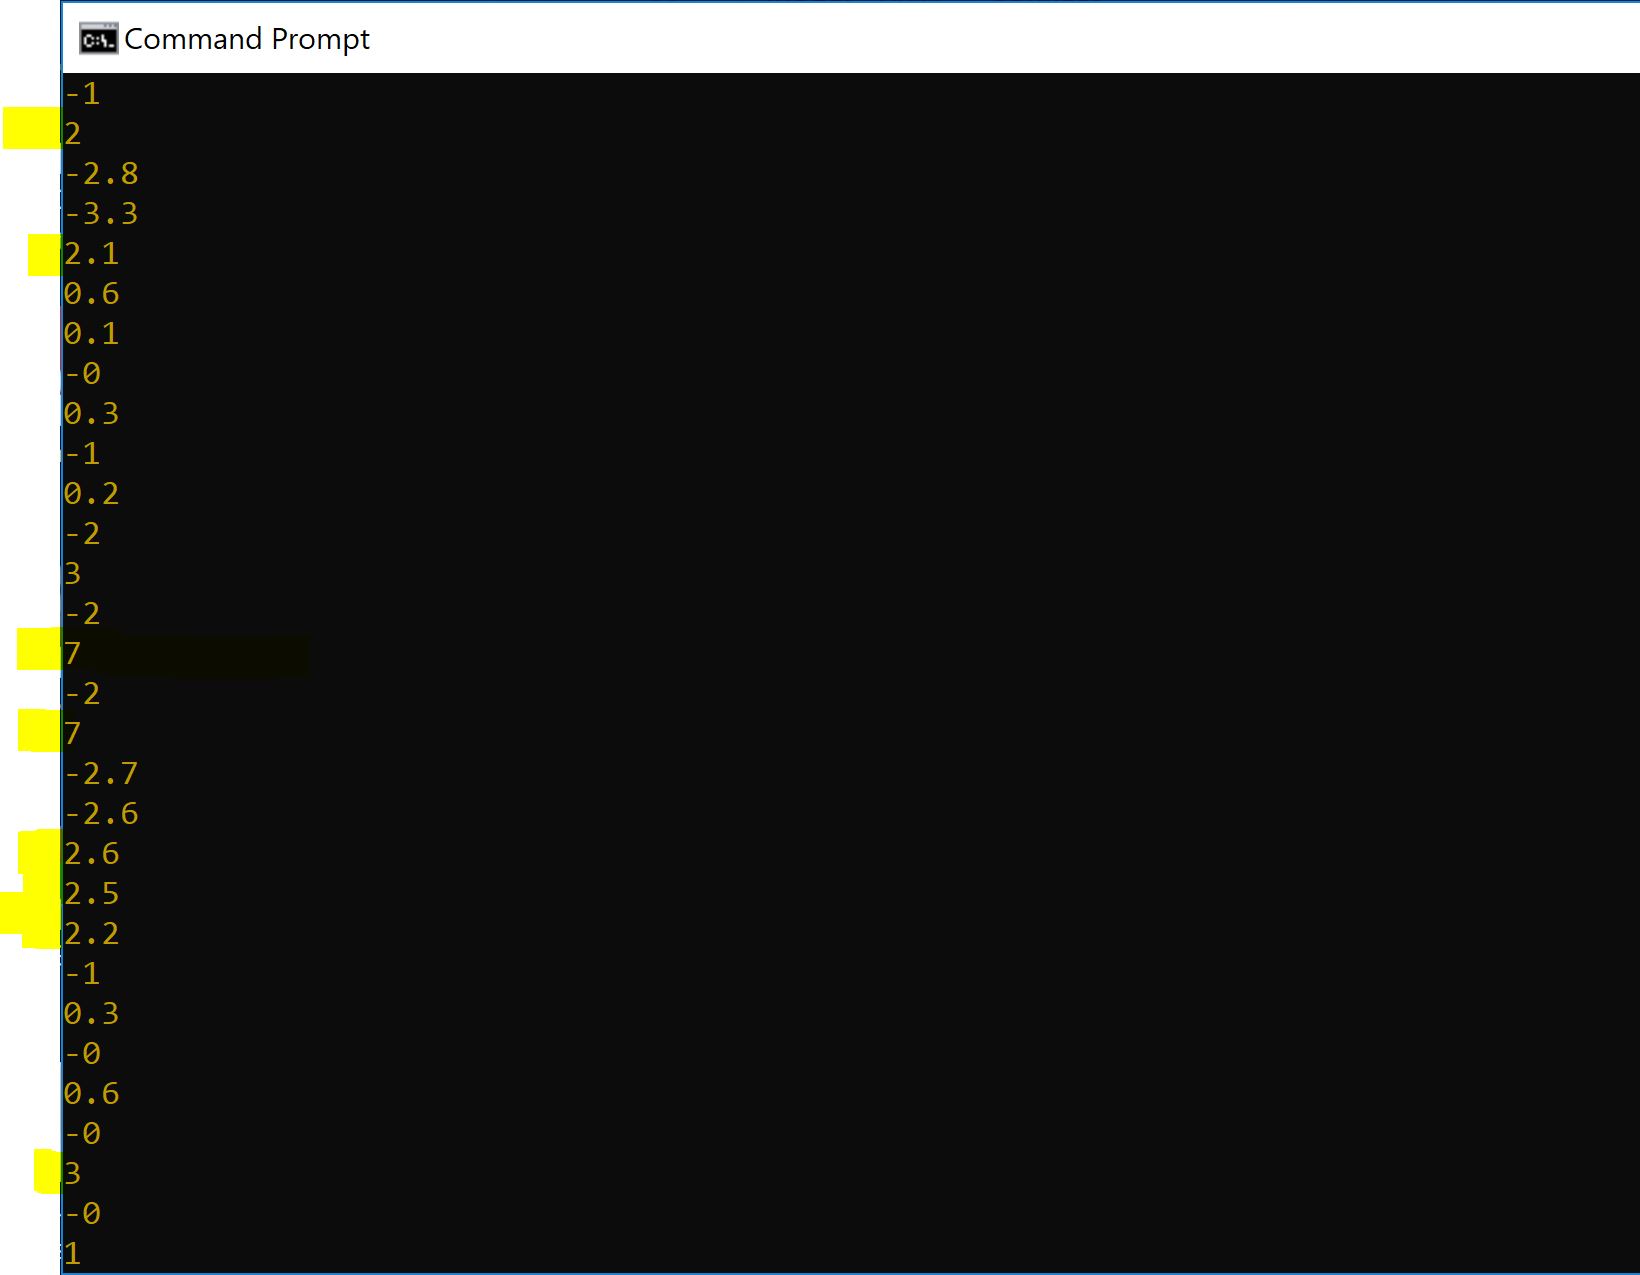
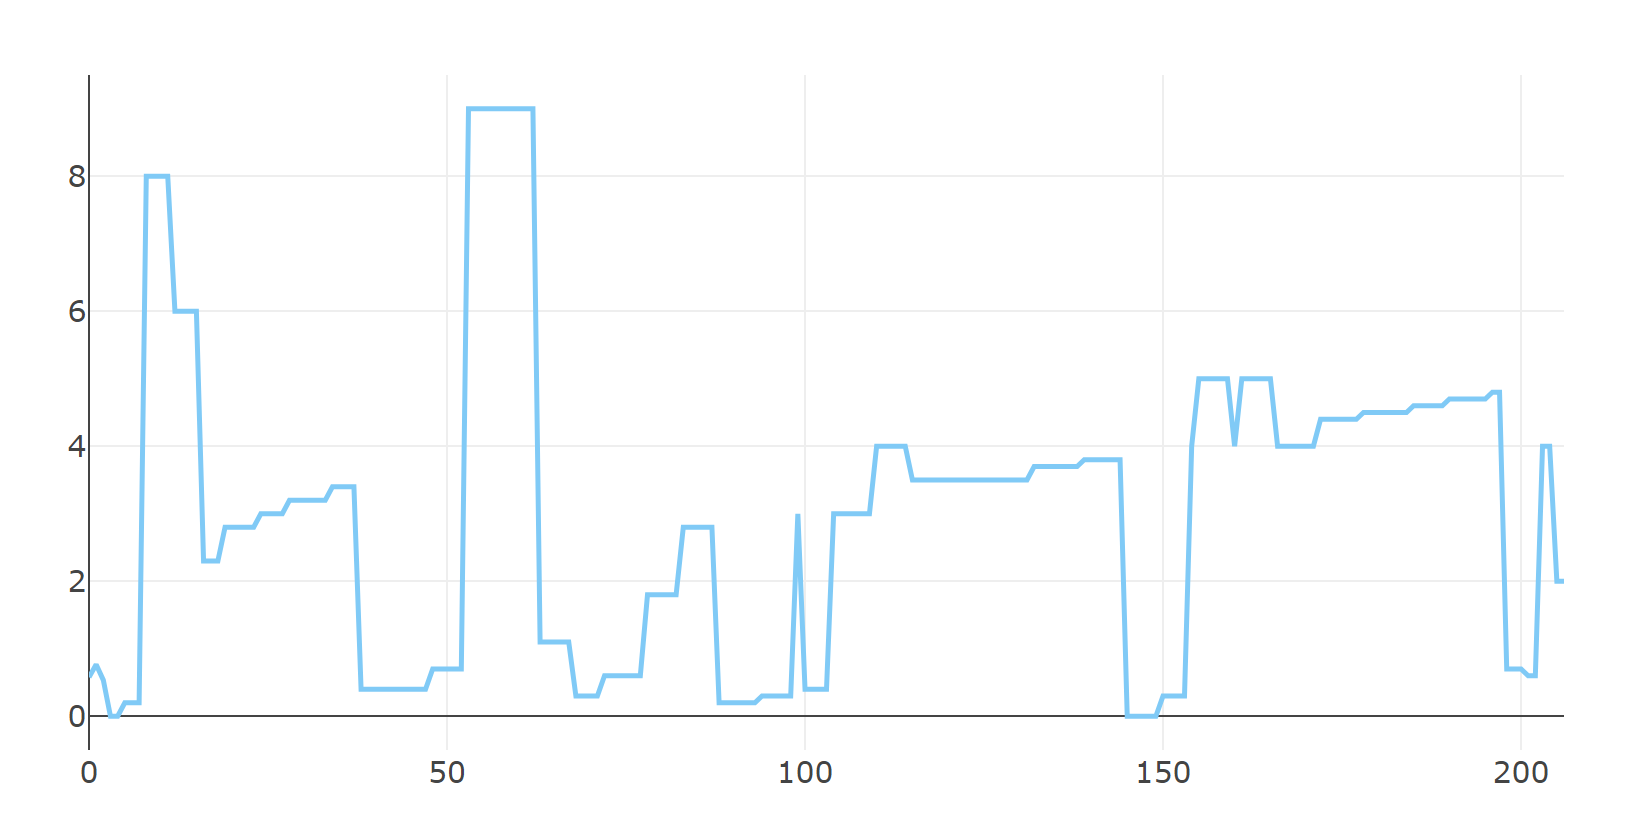
When launching this code in the terminal, after how we treated the data I founded the samples so unestable and difficult to filter. From the Arduino ide monitor the data were smooth and constant. I calibrated well the load cell and it was so linear, repetitive and smooth, but the data we were obtaining with JS were like this (highlited the crazy jumps in value)
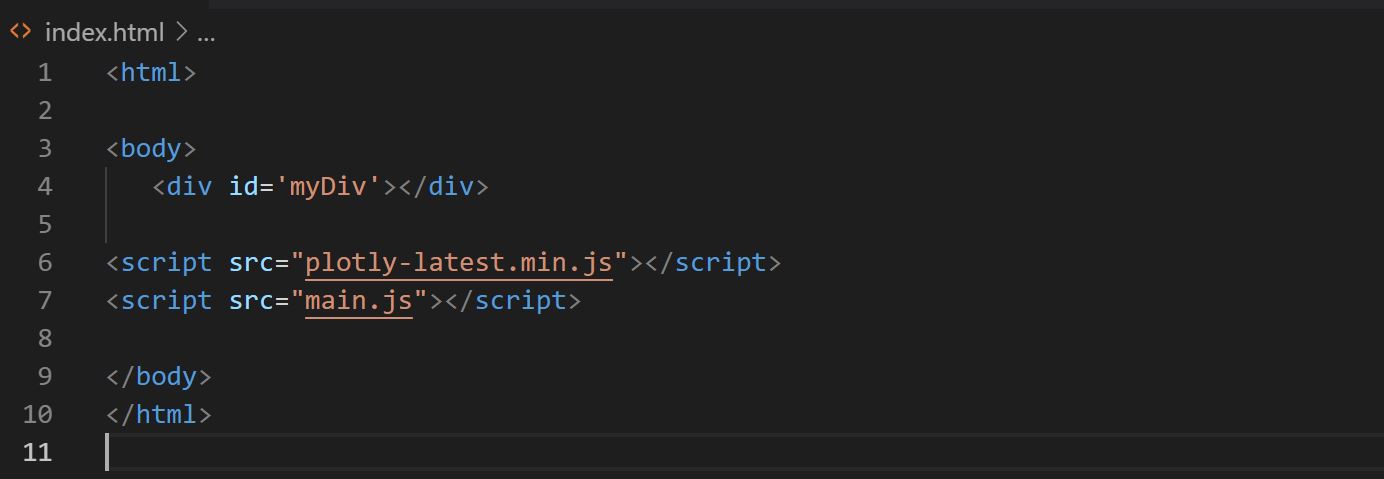
Anyway, I wanted to plot those values. To do that, we generated another js file able to plot the in real time thanks to the library plotly previously downloaded. This code reads the values and calls the plot function. We will call this script in the html page it is gonna be created to see the live plot in the server.
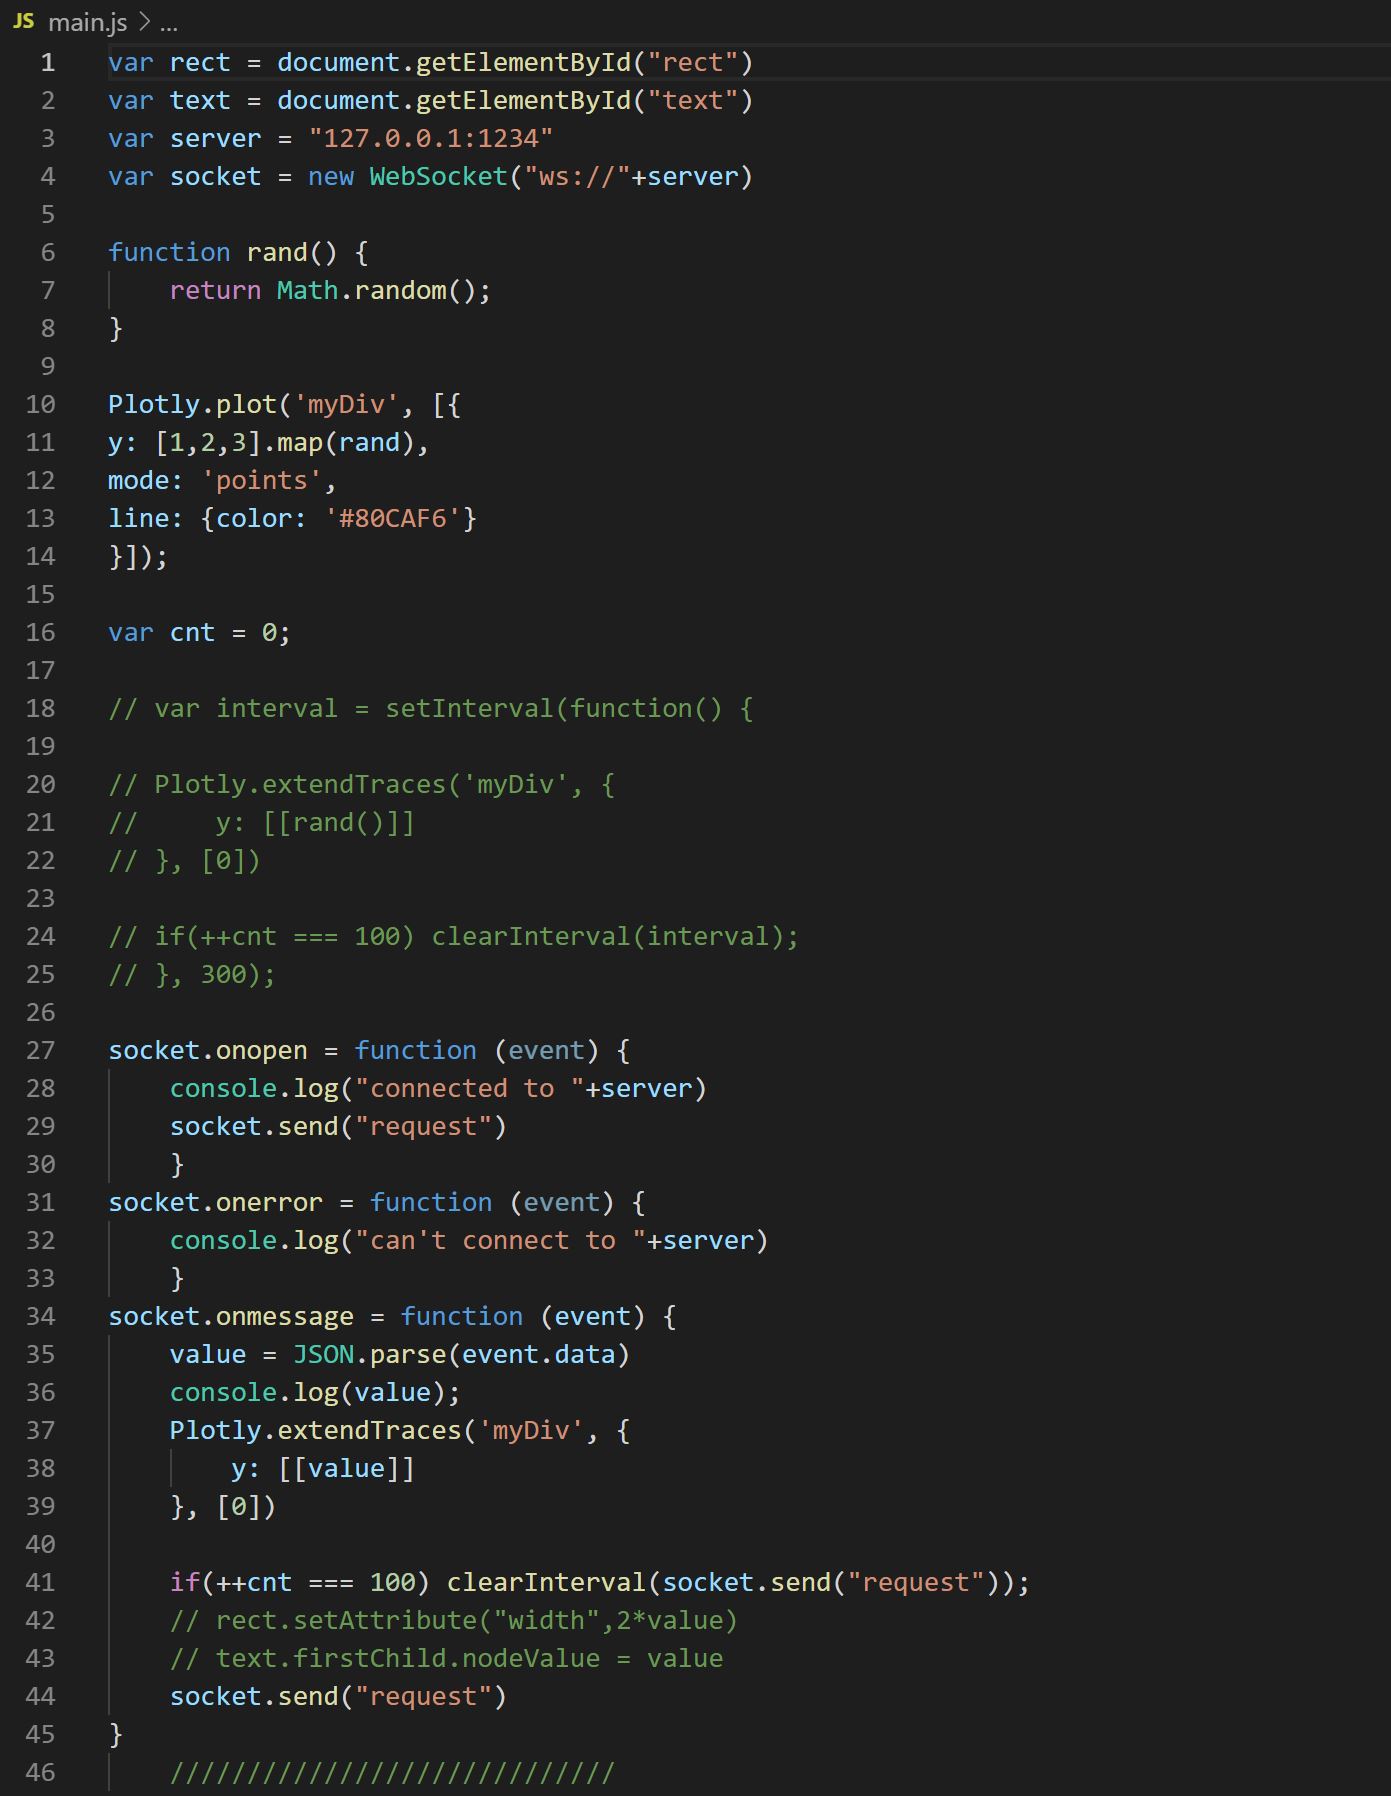
We recycled Neils code in order to put the script generated to read it as it can be seen here
When loaded and clicked the html script to be loaded in our browser, the chart, as spected, reacts to the load applied but with a lot of ghost values, so it is not very acceptable for my future proposes.
Amira helped me so much in this unknown world for me (js). I decided I was gonna spent the rest of the day in order to be able to do the same, but in python and see wich are the pros and the cons of both processes. Also, python is more usual to me so It woudnt be much problem to succeed and there is tons of information in the internet to ask those tiny details.
Python! < 3
Python has a bunch of libraries that makes your live EASY for this propose. To succeed in our desire, we need to call the following libraries (in case you dont got ti, pip download them is so so so easy)
We have to import serial to be able to read the serials and use this data reading. Also we will call numpy in case we need to treat data. We will import matplotlib in order to obviously plot something. Also we will call drawnow, a library that allows us to draw live data!
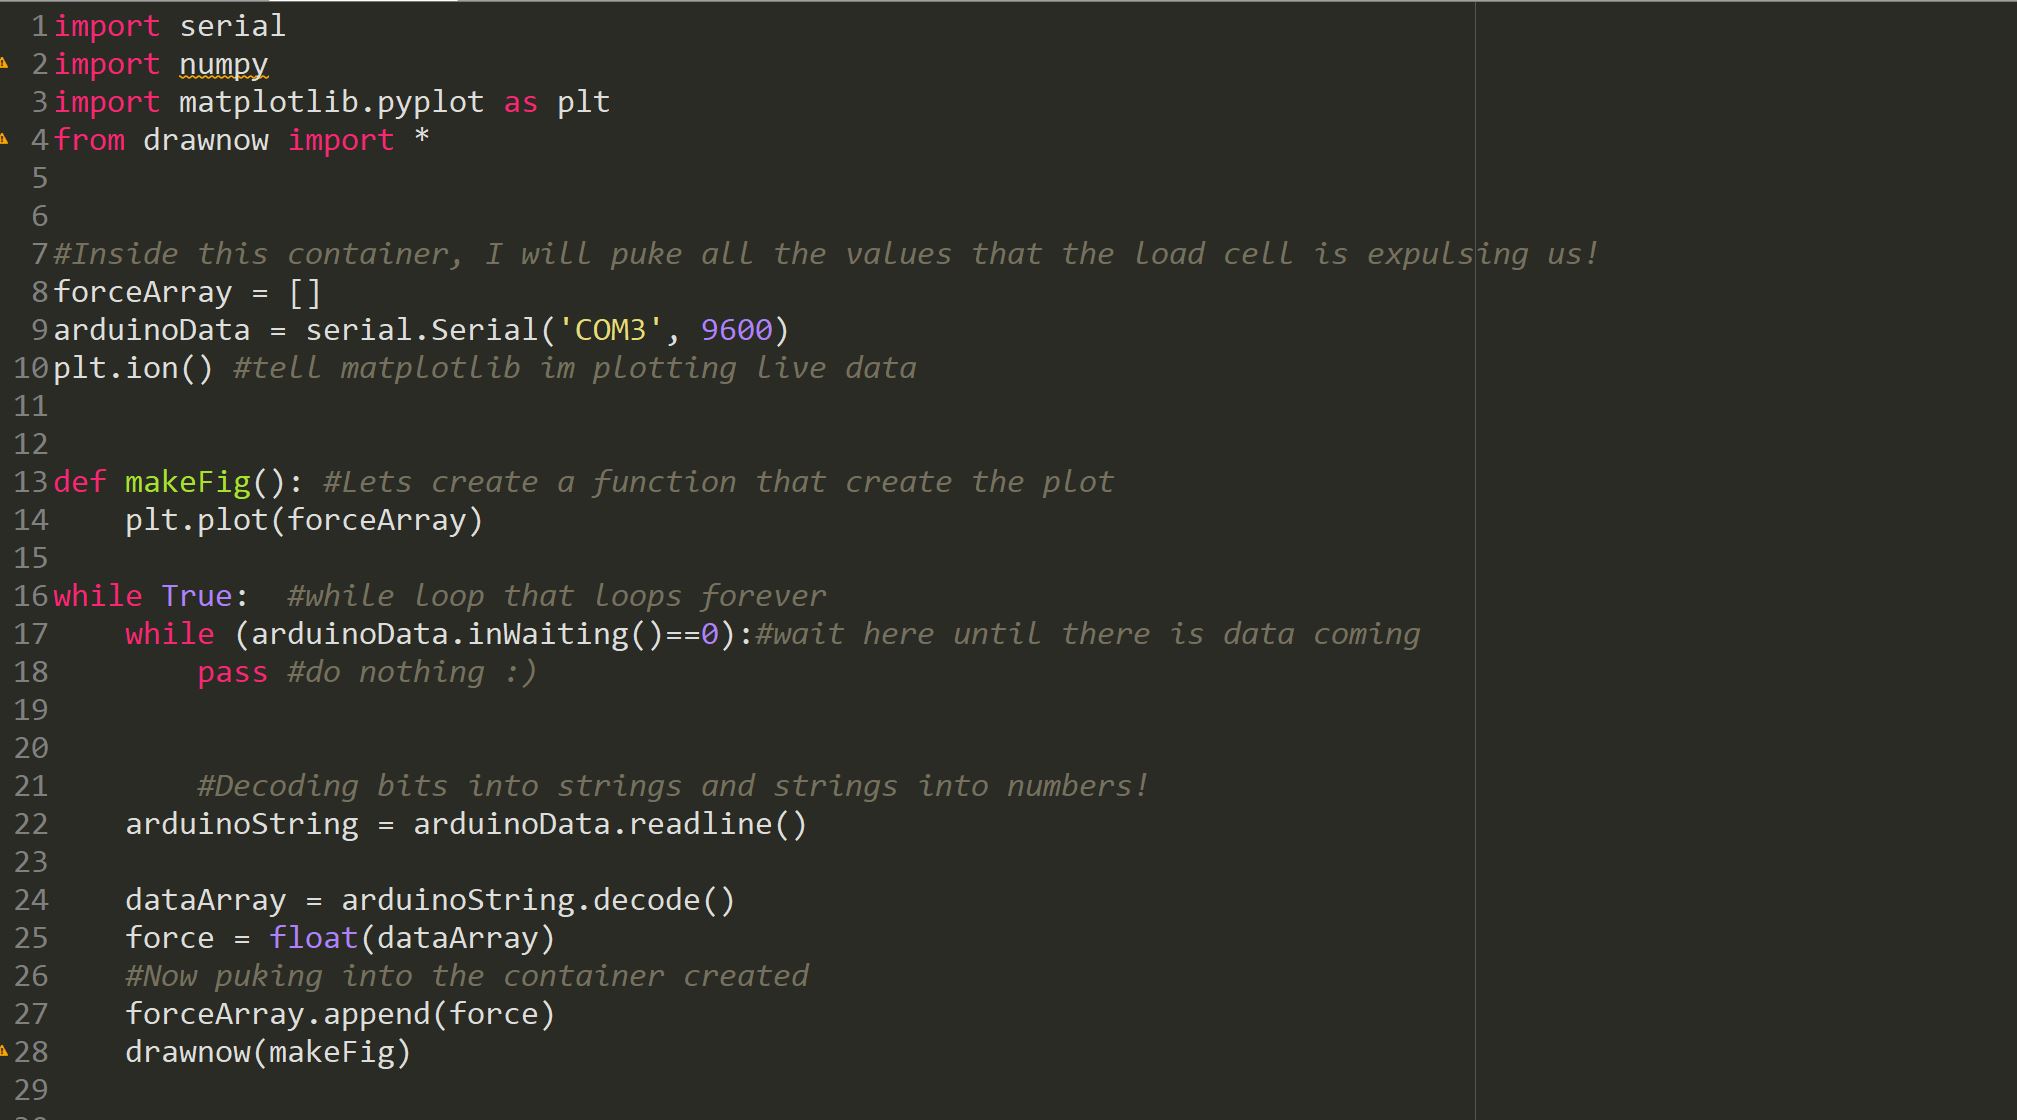
I am starting to be more organizing in the python code and I did a good job comenting the code. Anyway, what i am doing here is:
After call all libraries, we generate a empty container in which we will insert in an array aaall the reading data. Then, we tell python where the arduino data comes from (COM3 and speed) and in order to draw live, we MUST insert plt.ion() function. We will generate a function called MakeFig able to plot in a simple way the data in the container. Now it is time to store data in the commented container! Inside an infinite while , we will wait till the data comes with this second while. After the data is coming, we will read WHATEVER the arduino expulses. Then, after realizing is bit array, we will decode the value into a float and we will append those float in the container. The last part of the while loop is plotting the figure! Each cicle the plot will be updated. Beautifull right!
The data comes so so so smooth but with a little bit of lag... But incredibly smooth! Find here the video of how it works in real time