6.9020 HTMAA Week 13

[group work looks like this!]


Objectives for Web App

The interface I built this week is one component of my Final Project, which collects GPS data and needs a place to visualize it. To support that project, I built an interactive map interface that can show both GPS positions and the other sensor data that was collected at those points.

The main tool I used this week was Mapbox, which is a popular and free API for building custom map visualizations online. It's great for building custom map styles and has an intuitive interface for this as well as lots of examples about how to use them for visualizing geospatial data. I had used it before to create this project on property tax disparities in Pittsburgh, and I would recommend it to any students looking for a very low-friction way to build beautiful web maps. In my experience, it offers more stylistic flexibility than Google Maps API.

Interface Scope

I built a very simple HTML page here that basically just serves as a container for the map. It is built on the same page that used to serve my flask application and WiFi network outputs (from last week). However, in the intervening time I made an important change to my Final Project, which was to switch from a Pico W microcontroller to an ESP32 S3 Sense microcontroller, and to condense all the electronics onto one PCB.

This change meant that all my data would be passing through one place, and that I would have a natural spot in the camera module of the ESP to put an SD card. After my realization that WiFi networking wouldn't gain me any ground in making a live map visualizaiton, I decided to abandon that and just write all my sensing data to the SD card and later upload it to the interface.

As such, the interaction of the interface is twofold: it allows a user to upload a CSV that includes lat/long coordinates and data to be visualized on the map, and then it allows the user to navigate that data through popups at each point in the map.

Interface Construction

The construction of the interface is an extremely basic HTML wrapper where most of the visualization is done through Javascript. The first interaction happens through a file upload button, which updates the map when a new file is detected.

I used a little HTML hack to modify the display of the button, using an invisible "input" element and a dedicated button class: 
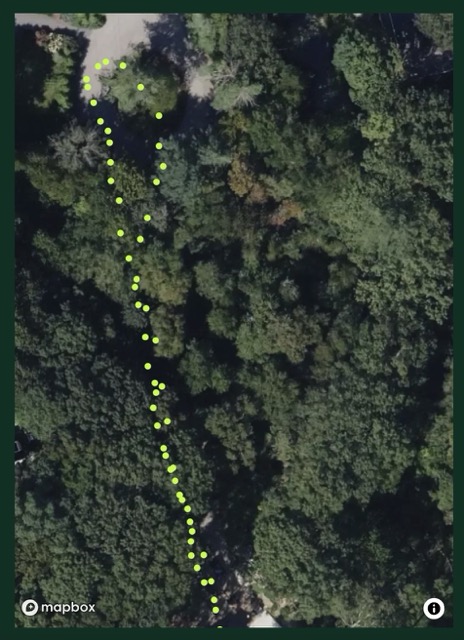
Then, I did the rest of the work in Javscript. I created a Mapbox "map" element using the standard satellite basemap (although I did experiment with making my own map style first, using the style playground), and I set its central lat/long point relative to where my walks would be leaving from. 
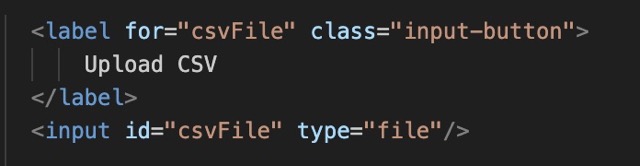
The rest of the interaction in the script is all triggered by the upload of a CSV. The script parses the CSV and extracts the lat/lon columns into the geometry element of a geojson, to which it adds all other fields as properties of each point.

It then creates little HTML wrappers for the display of each property (including the coordinates) and visualizes these inside the popup element: 
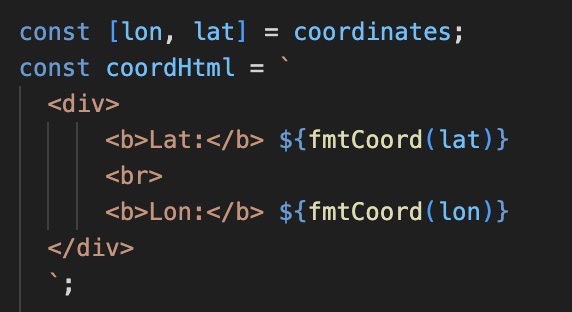
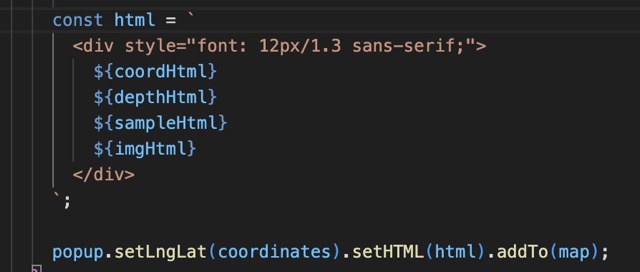
There is some handling built in for the cases where some elements are available and some aren't and the resulting popups include all the data that is recorded in the CSV for a given element: 
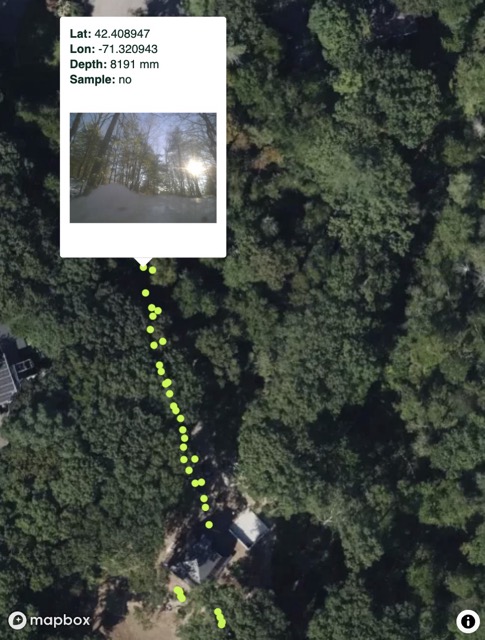
There are some limitations to the strategy that will be discussed in the next section, but the interaction is there!

Importing Data / Limitations

This interface introduced me to some key browser security dynamics about what web browsers can and cannot access on a user's local computer. The way it's currently designed (which is just for my own testing ultimately) assumes that there will be a file of images called "/walkimgs" in the same folder as the template, and that the interface will just be visualized in the browser locally, not hosted.

This is important because browser security protocols don't allow websites to search around in a user's local filesystem in order to pull up data, even if the user gives direct filepaths (such as through the uploaded CSV in this case). To get around this, it is possible to use "fetch()" calls in a hosted setting, or for the user to upload an entire directory of images to be processed in the background using webkit-relative paths, but both were beyond the scope I could implement this week.

As such, the way to use the interface is to upload the file 00.csv which already points to the existing walkimgs directory. Both files would need to be changed in the background for it to show any other data.

Group Assignment: Comparison

For simplicity I am comparing my web interface to Saleem's WiFi web interface, based on the attributes he summarized:


Ease of Implementation straightforward HTTP server, Chart.js CDN integration requires minimal setup lots of style options from mapbox, but custom JS requires some maneuvering if moving beyond tutorials
Remote Access accessible from any device on WiFi network requires full file system to be visualized locally
Visualization Capabilities rich data visualization with real-time plotting, smooth animations, and interactive features smooth and precise data visualization along GPS path, with map context visual
Real-Time Updates efficient data transfer, 300ms refresh rate maintains responsive feel no real-time updates due to local implementation
Limitations requires WiFi network, limited to local network without additional configuration, power consumption higher than OLED alone requires user to visualize data locally for image file access
Best Use Cases remote monitoring, data logging visualization, multi-user access, professional dashboards rapid prototyping feedback and personal project visualization

Trials and Tribulations

Following are some observations of the process this week, and some challenges or disappointments to record:

Learnings and Progress

Below is the delta between where I started on the skills for this week and where I arrived:

Resources and Acknowledgments

I relied heavily on the Mapbox tutorial for popup visualizations to structure the interaction. This was a very flexible tutorial that basically allowed me to add whatever HTML I wanted inside the popups-- my code builds on this by adding images in those popup elements.

Design Files

My interface and the CSV + folder of images it visualizes are in the WalkMap folder under "templates."