
HTMAA Week 3
Assignment Description:
browse through the data sheet for your microcontroller
write program for a microcontroller development board to interact (with local input &/or output) and communicate (remotely)
Final Product
GitHub Repository with Code (will be updated when I make changes)
Code on This Server (frozen in time)
Parent Repository (Which I Forked)
Introduction to the Inky Frame 7
The Inky Frame 7 is a 7", 7-color e-ink display controlled by an onboard Raspberry Pi Pico W microcontroller.
I have seen a few of these e-ink dashboards floating around the internet and it has been on my theoretical to-do list to make one for myself. I initially planned on creating a project similar to this for my final project, but I came up with a better idea and realized this would be better suited for this week's assignment!
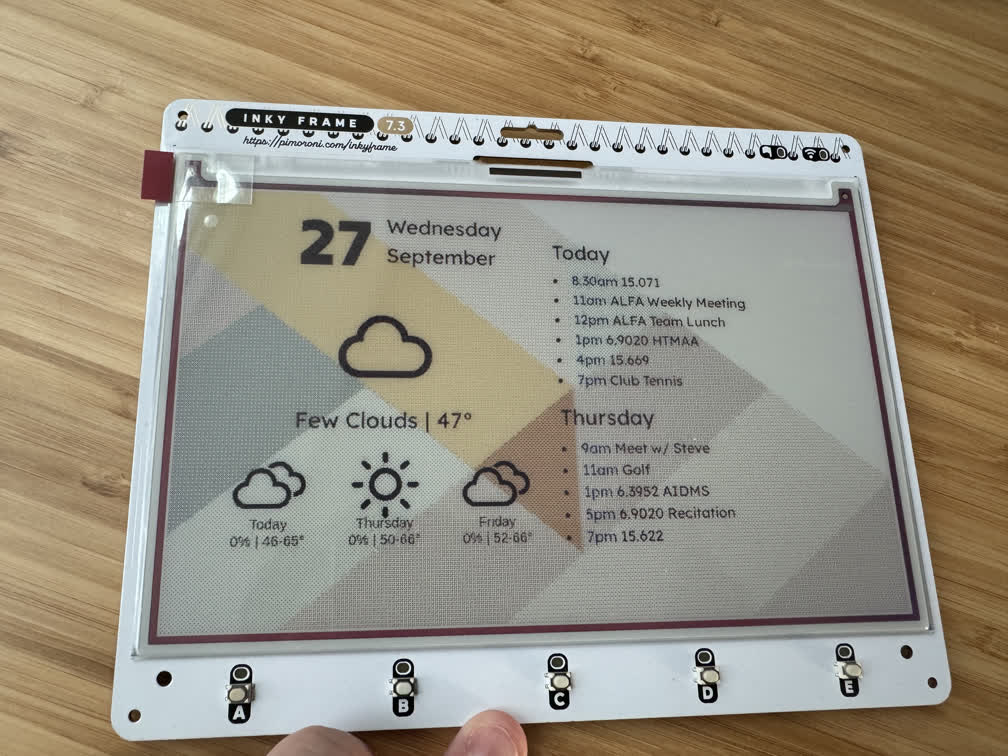
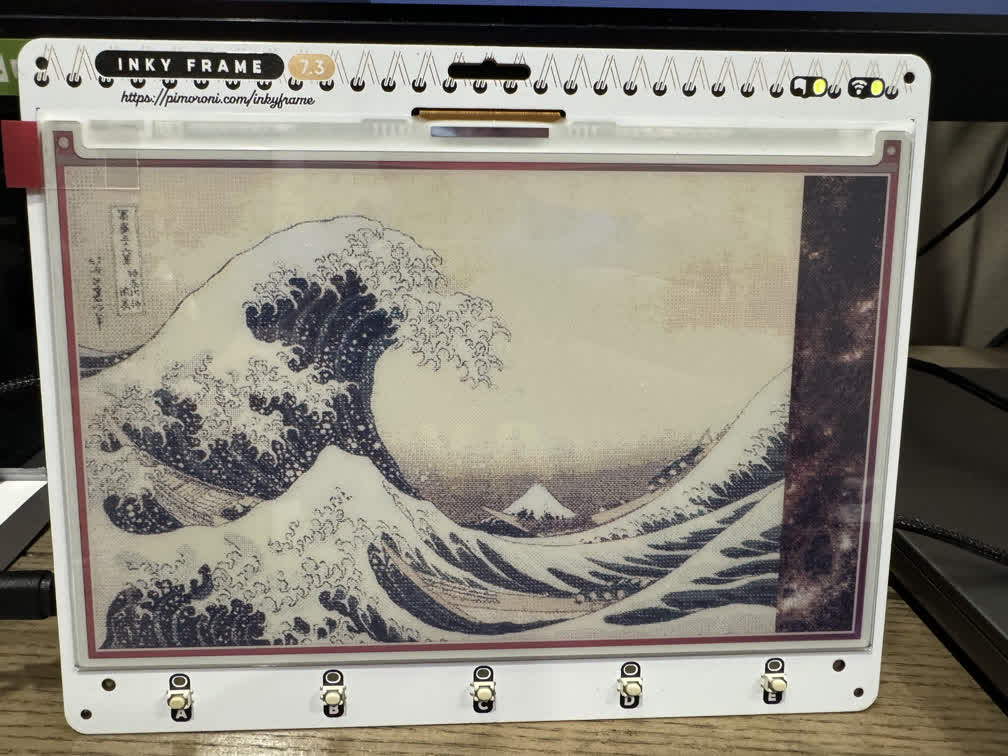
The basic idea of the project is to utilize the 'always-on' capability of e-ink displays to have a battery powered portible display on my desk for any purpose. At its current stage, the "InkyDash" as I like to call it, can present a weather/calendar dashboard, a photo slideshow, and a few other pre-baked modules from the manufacturer.
Getting Started with the Pico W (RP 2040)
It took a while to understand the workflow with the microcontroller and interacting with it in Thonny. Thankfully the manufacturer has a helpful guide to understand the basics as well as how to interact with the display. Thankfully the onboard Pico came pre-installed with micropython and a library specifically for this so one doesn't have to get too low level.
I started by messing with the pins that control the LEDs at the top of the display, then tinkered with getting the included modules to work. Make sure to include your network information in a file named 'secrets.py'. This was the first time I had ever used a microcontroller or micropython, so I experienced growing pains, specifically with understanding control flow, memory management, and persistence across executions. Once I got comfortable (or so I thought) I began to sketch out the plan for the dashboard.
The Status Dashboard
I want the Inky Frame to display a dashboard describing the weather, news articles, and events from my calendar. Drawing text directly on the display seemed tedious and even more so to do so in a way that is dynamic given differing inputs (such as the number of events on the calendar a certain day). The Inky also has the capability to display jpeg images. I found a similar project that approached the problem by using an external Raspberry Pi to render the information in a headless browser with bootsrap, take a screenshot, and upload it to a web server for the pico to retrieve and display. The Pico does not have the capacity (computationally and library support-wise) to perform this task so it must be done externally. I forked this project and used it as a starting point.
I have a Pi 4 at home that runs a few automation tasks in the background that I used for this project. However, I wanted the display to reside on my desk on campus and my Pi4 at home is not exposed to the public internet for security reasons. Therefore, instead of hosting a web sever to serve the rendered dashboard image, I utilized the Google Drive API to host the file. I used the sharing link as a sort of "dead drop" in which the Pi4 uploads a revision of the file (in order to maintain a constant sharing link) and the Pico downloads the image with a GET request. This process turned out to be not as easy as it sounds. There was code already in the project to interact with the Google Calendar API which was easy enough to set up for my Google Account, but the process required the following steps:
- Enabling the API on your Google Account
- Defining the "scopes" of the project, i.e. the permissions. This project requires the "calendar.readonly" and "drive.file" scopes
- Downloading your account's credential
- Generating your OAuth token (this requires a browser to authenticate, meaning I could not do it on the Pi4 living under my bed, so I had to transport it from my laptop)
- Make sure you don'y accidentally upload secrets to GitHub... (now in .gitignore in my repo)
Therefore the dashboard compiles information from the following APIs: OpenWeatherMap, Google Calendar, and Google Drive. I set up a cron job to run on the Pi4 to update the dashboard image every hour.
Adventures with Bootstrap

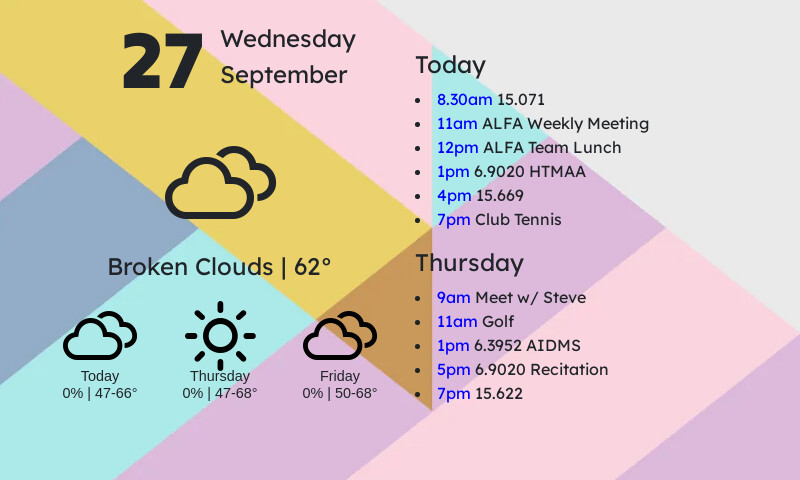
The repo I forked contained an elegant html/css format for rendering the information into a webpage before taking a screenshot. However the original project utilized the Inkplate 10 Display, a larger, higher resolution 9.7" black and white display. Sadly, the existing format broke when I set the dimensions to the resolution of the Inky Frame.

Therefore, I used Adobe Dreamweaver to tinker with both the template html file and the css stylesheet. The corrected versions are present in the repo. This was my first run in with Bootstrap, so I utilized the following tutorial to familiarize myself with its grid structure. This led me to realize that the issue was not the layout itself, but just the font and padding block sizes. The live preview in Dreamweaver was extremely helpful for tuning and adjusting the values to make it look right.
Getting the Dashboard on the Pico
After much tinkering and banging my head on the desk with issues external to the display/Pico, I returned to the realm of the microcontroller to first test if it would properly display the dashboard image, then to deploy it automatically and add more features.
Before trying to download the image from Google Drive, I uploaded it to the Pico via Thonny. The guide from Pimoroni helped lay out how to utilize the provided library to render the jpeg and draw it to the screen. Success!
However, uploading the file over USB is extrmely clunky. With the Pi4, we set up a persistent sharing link for the dashboard image it regenerates every hour. I naively thought it would be as simple as using urllib's urequest to make a GET request to the Drive link, reading the content into a buffer then a file, and displaying that file. However, Google Drive sharing links do not actually point directly to the image data, but to a web interface for viewing and interacting with the file with Google's tools. However, one can convert a "sharing" link to a "content" link with the following tool that alters the URL to point to the file itself.
Once again, we face another hurdle. This persistent link actually redirects to a temporary link that actually serves the content. Using micropython's built in urequest function renders an error stating that redirects are not supported. Thankfully, Google led me to the pycopy-lib repository, which contains a version of urequest that supports redirects. Copy this file over to the pico and use it instead.
After much tinkering in micropython, the launcher allows for selecting between modules and cycling between the dashboard and slideshow.