Portable UV-Near IR Spectrometer
Summary
Report
1. What is spectroscopy?
Spectroscopy is the study of the way light (electromagnetic radiation) and matter interact. There are a number of different types of spectroscopic technique and the basic principle shared by all is to shine a beam of a particular electromagnetic radiation onto a sample and observe how it responds to such a stimulus. This allows scientists to obtain information about the structure of the molecules.
2. What is light?
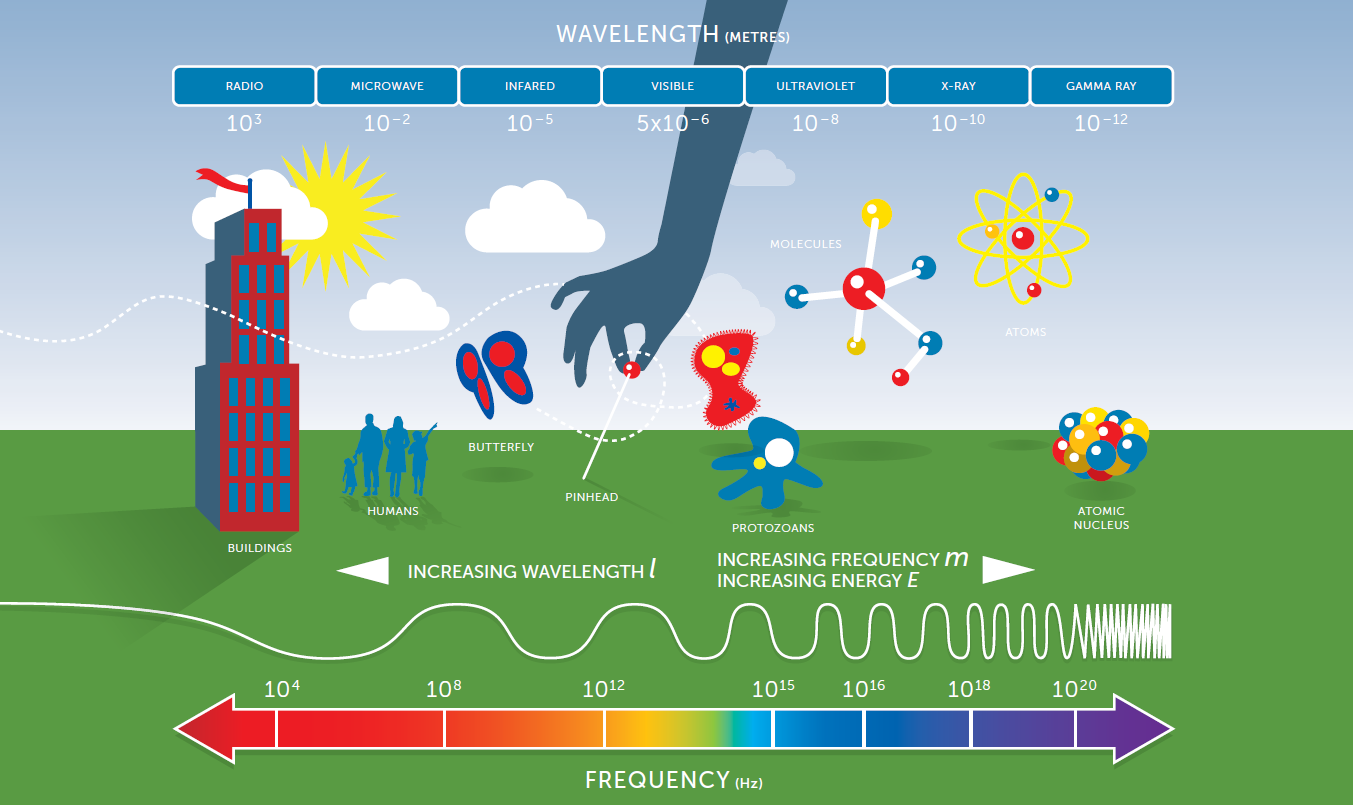
Light carries energy in the form of tiny particles known as photons. Each photon has a discrete amount of energy, called a quantum. Light has wave properties with characteristic wavelengths and frequency (see the diagram below).
The energy of the photons is related to the frequency (ν) and wavelength (λ) of the light through
the two equations:
E = hν and ν = c/λ
(where h is Planck’s constant and c is the speed of light).
Therefore, high-energy radiation (light) will have high frequencies and short wavelengths.
The range of wavelengths and frequencies in light is known as the electromagnetic spectrum. This spectrum is divided into various regions extending from very short-wavelength, high-energy radiation (including gamma rays and X-rays) to very long-wavelength, low-energy radiation (including microwaves and broadcast radio waves). The visible region (white light) only makes up a small part of the electromagnetic spectrum, considered to be 380–770 nm.
When matter absorbs electromagnetic radiation the change which occurs depends on the type of radiation, and therefore the amount of energy, being absorbed. Absorption of energy causes an electron or molecule to go from an initial energy state (ground state) to a high-energy state (excited state) which could take the form of the increased rotation, vibration or electronic excitation. By studying this change in energy state scientists are able to learn more about the physical and chemical properties of the molecules.
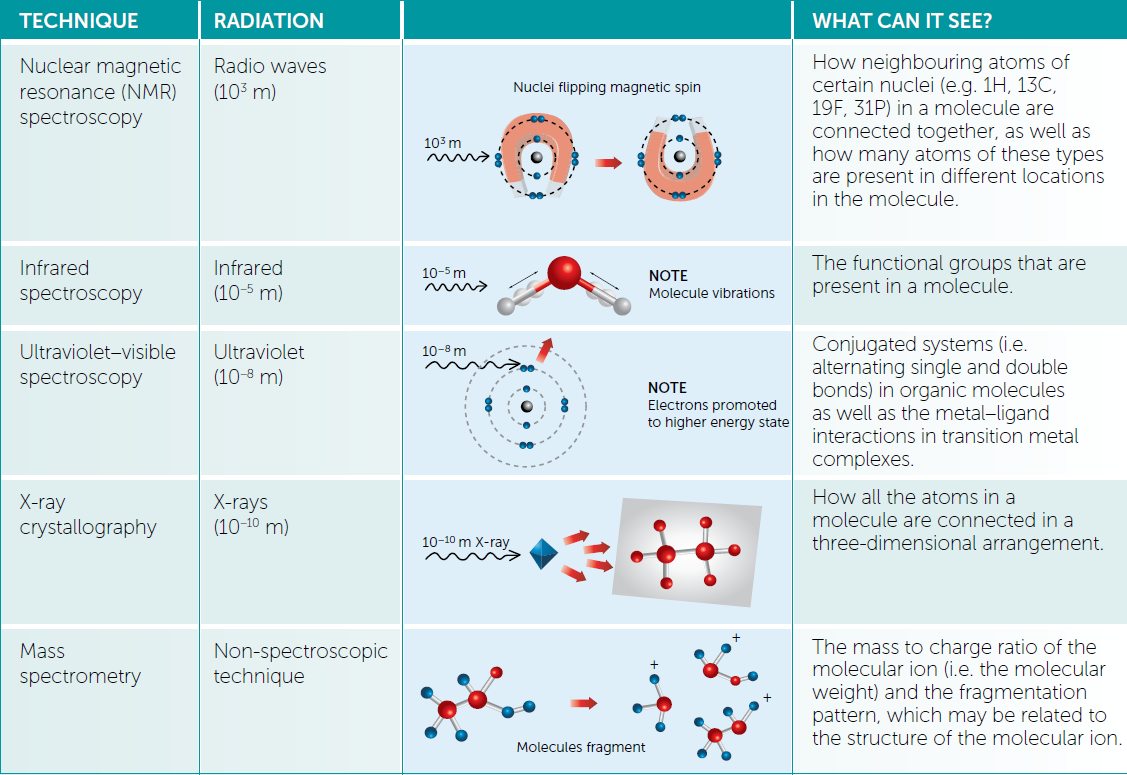
- Radio waves can cause nuclei in some atoms to change magnetic orientation and this forms the basis of a technique called nuclear magnetic resonance (NMR) spectroscopy.
- Electrons are promoted to higher orbitals by ultraviolet or visible light.
- Vibrations of bonds are excited by infrared radiation.
The energy states are said to be quantised because a photon of precise energy and frequency (or wavelength) must be absorbed to excite an electron or molecule from the ground state to a particular excited state.
Because molecules have a unique set of energy states that depend on their structure, IR, UV-visible and NMR spectroscopy will provide valuable information about the structure of the molecule.
3. Introduction to ultraviolet - visible (UV-VIS) spectroscopy
Absorption of ultraviolet (UV) and visible radiation is associated with excitation of electrons, in both atoms and molecules, from lower to higher energy levels. Because the energy levels of matter are quantised, only light with the precise amount of energy can cause transitions only light with a precise amount of energy can cause transition from one energy level to another. Light with a different energy level would not be absorbed and would not change the level. The possible electronic transitions that light might cause are:
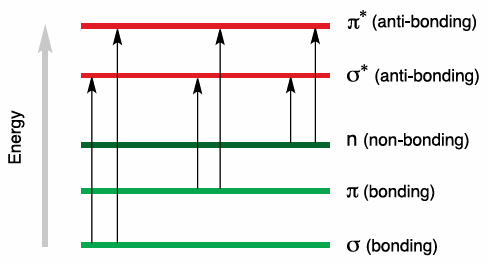
In each possible case, an electron is excited from a full (low energy, ground state) orbital into an empty (higher energy, excited state) anti-bonding orbital. Each wavelength of light has a particular energy associated with it. If that particular amount of energy is just right for making one of these electronic transitions, then that wavelength will be absorbed.
The larger the gap between the energy levels, the greater the energy required to promote the electron to the higher energy level, resulting in light of higher frequency, and therefore shorter wavelength, being absorbed.
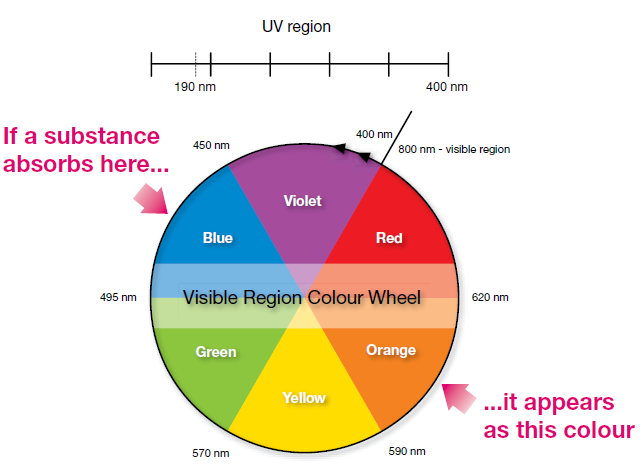
It is possible to predict which wavelengths are likely to be absorbed by a coloured substance. When white light passes through or is reflected by a coloured substance, a characteristic portion of the mixed wavelengths is absorbed. The remaining light will then assume the complementary colour to the wavelength(s) absorbed. This relationship is demonstrated by the colour wheel shown on the right. Complementary colours are diametrically opposite each other.
It is possible to predict which wavelengths are likely to be absorbed by a coloured substance. When white light passes through or is reflected by a coloured substance, a characteristic portion of the mixed wavelengths is absorbed. The remaining light will then assume the complementary colour to the wavelength(s) absorbed. This relationship is demonstrated by the colour wheel shown on the right. Complementary colours are diametrically opposite each other.
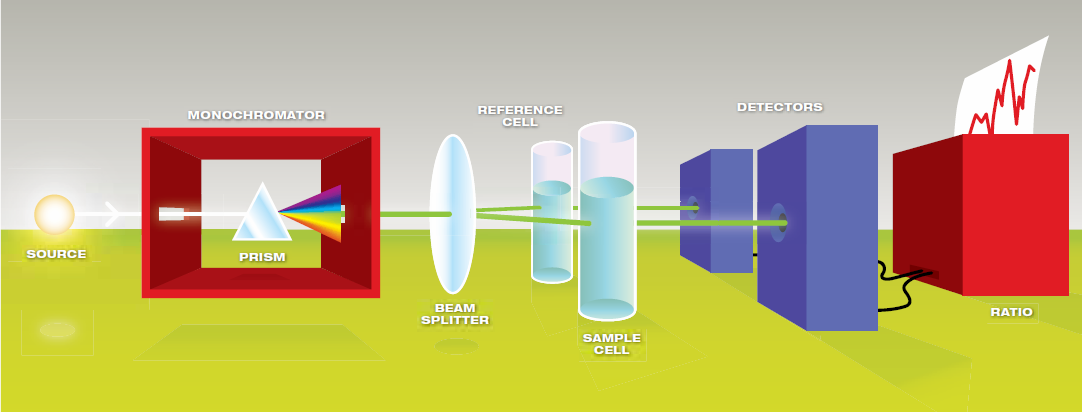
UV-VIS spectrometers can be used to measure the absorbance of UV or visible light by a sample, either at a single wavelength or by performing a scan over a range in the spectrum. The UV region ranges from 190 to 400 nm and the visible region from 400 to 800 nm. The technique can be used both quantitatively and qualitatively. A schematic diagram of a UV-VIS spectrometer is shown above.
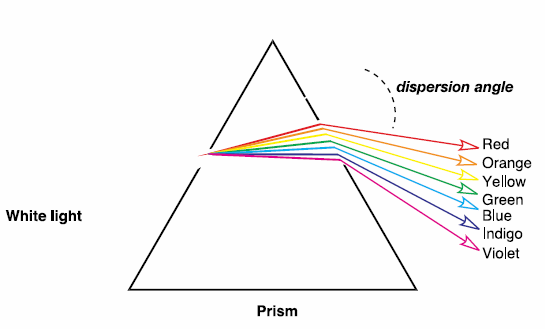
The light source (a combination of tungsten/halogen and deuterium lamps) provides the visible and near ultraviolet radiation covering 200–800 nm. The output from the light source is focused onto the diffraction grating which splits the incoming light into its component colours of different wavelengths, like a prism (shown below) but more efficiently.
For liquids the sample is held in an optically flat, transparent container called a cell or cuvette. The reference cell or
cuvette contains the solvent in which the sample is dissolved and this is commonly referred to as the blank.
For each wavelength the intensity of light passing through both a reference cell (I0) and the sample cell (I)
is measured. If I is less than I0, then the sample has absorbed some of the light.
The absorbance (A) of the sample is related to I0 and I0 according to the following equation:
A=log10(I0/I)
The detector converts the incoming light into a current, and the higher the current the greater the intensity. The
chart recorder usually plots the absorbance against wavelength (nm) in the UV and visible section of the
electromagnetic spectrum. (Note: absorbance does not have any units.)
4. Low Cost VIS - Near IR Spectrometer
In order to build a spectrometer, we need something to illuminate the object under analysis,
and something capable of catching the reflected light from the object. It’s not mandatory to have a collimated ray of light,
like a laser, but a normal beam works fine, even with a certain angular opening. Producing this kind of light is easy enough:
a LED is everything you need; catching and recording the reflected light is a different matter. Here a photodiode comes in handy,
which, when it’s hit by a photon (that is the elemental particle of light) an electrical current begins to flow. The more intense
the light radiation that strikes the photodiode, the more intense is the current created (within the components limits of course).
With the photodiode, we can catch the reflected light and measure its intensity, but to calculate the spectrum we need to know exactly
which wavelengths are contained in that light. To do this we need to filter the beam of light before it hits the photodiode, dividing
it in many beams of known wavelengths that will cover the spectrum of interest.
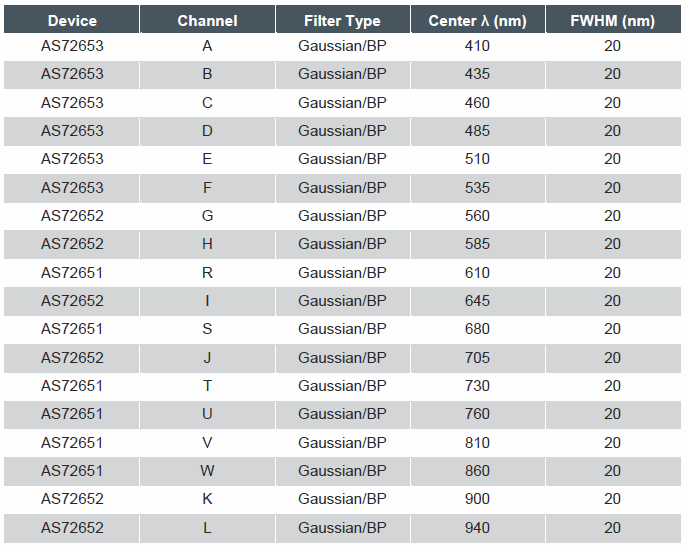
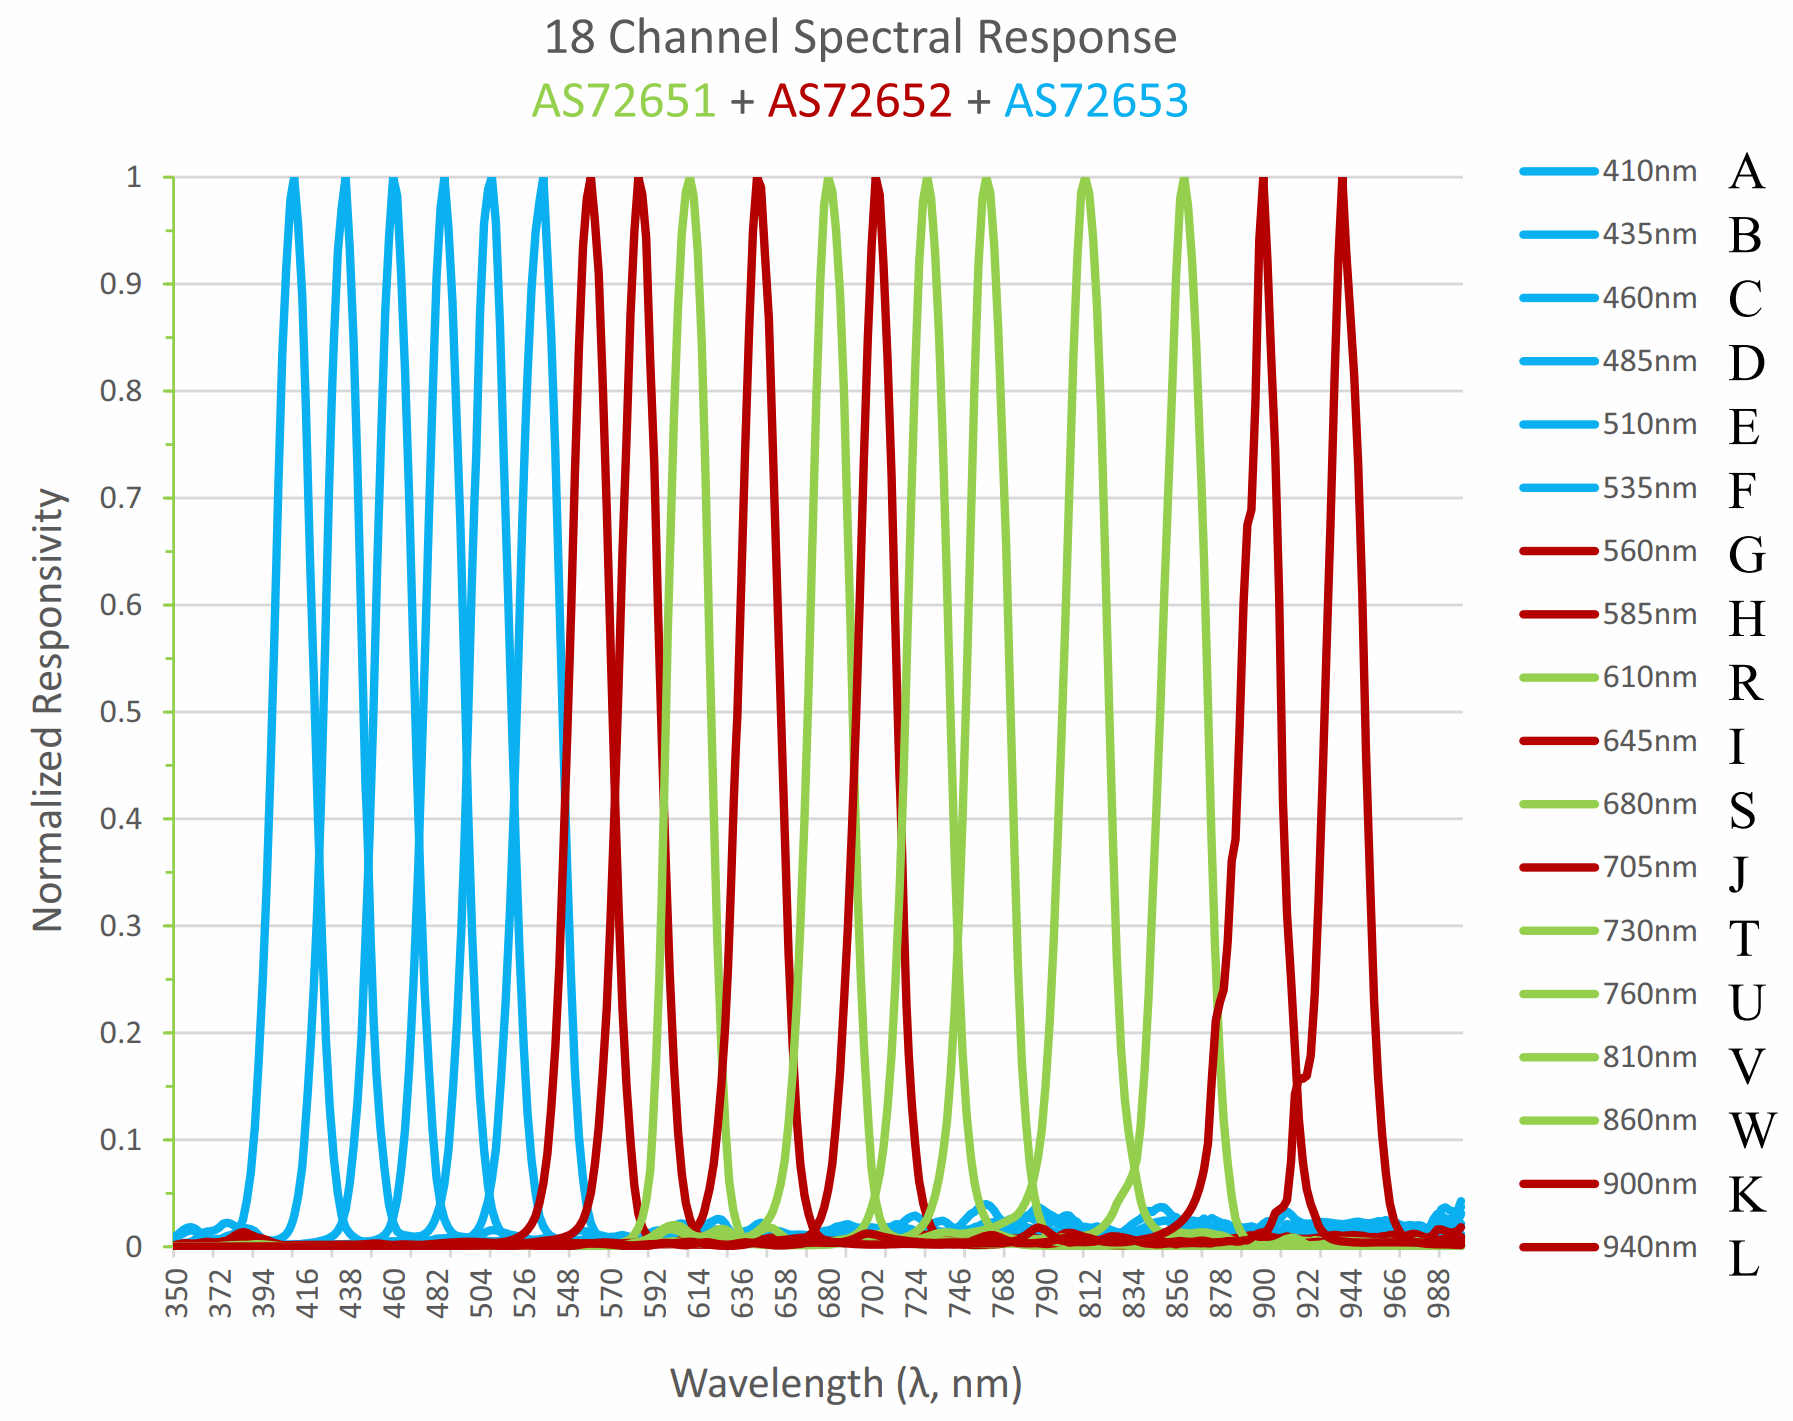
Various filter exists in electronics, in this case, a Gaussian bandpass is used. Let’s use an example to explain what we’re talking about: one channel measures the wavelength around 610nm (each channel is correlated to a different wavelength). The reflected light hits the sensors, is filtered to let pass through only the radiation with a wavelength similar to 610nm, and strike the photodiode; so that photodiode (channel) tells us only how much radiation of that specific wavelength is in the reflected light. The Gaussian bandpass filter lets through 100% of the target (in this case wavelengths at exactly 610nm) and a decreasing percentage of light at frequencies above and below 610nm. The result will be a Gaussian curve, similar to a bell, as you can see in the Figure below.
AMS AS7265X Spectral Sensors