Final Project Proposal & Documentation Log
Final Project Summary: EX-DASH, the Easily EXtensible Dashboard
[1] Final Project Proposal (Week 0 Assignment)
My initial proposal for the final project is some sort of interactive simulation of particle collision physics. Specifically, I want to create a device that can be used to model some aspect of how a group of particles collide, in a way such that someone can physically interact with this simulation. At first, I had the potential idea of making a small swarm of tiny robots that would act like particles, and then a person could change some of the ways these robots interact such as "stickiness" of particle collisions, particle speed, etc. After some more thought, I didn't really like this idea. I ended up with a new concept: a 3D LED cube which simulates "sand" particles in a box. The general idea is this: I can have a 3D grid of LEDs, say a 16x16x16 cube, and an LED in that cube will turn on if there is a particle at that position in the grid. Using sensors such as accelerometers, a user can tilt or shake the cube around, and then these particles will move around, effectively simulating some set of small particles bouncing around in a confined box.
[2] Implementation Strategy
One of the key goals for my final project is to use simple computing power, in the sense that I don't want to just solve a complex problem by throwing lots of compute power at it (e.g. many Linux SBCs) and calling it a day. As such, I would like to use as many microcontrollers as possible in my project, rather than 1 extremely powerful processor. There are two issues at hand for implementing a 3D LED cube: if there aren't enough LEDs, the particle simulation will look too discrete and therefore not visually pleasing. If there are too many LEDs, driving them will be very complicated. I decided that 16x16x16 was a reasonable balance between the two. Now, driving 16^3 = 4096 LEDs from one microcontroller is asking a lot, so I decided to maybe parallelize the simulation of the LED cube. I decided that I could give a processor to each layer of the LED cube, and then have all of these processors communicate together to effectively run the entire LED cube simulation.
[3] Switching Project Ideas
After what I had accomplished in weeks 4, 6, 8 together, I felt that I would rather pick a new final project idea rather than stick with the goal of creating a 3D LED cube. This is because after the end of week 8, I had created a successfully working 2D LED matrix which could simulate 2D particle collisions, so I felt that I had already demonstrated the concept of "interactive particle simulation" and I didn't think I would gain much more by making a 3D version of that project. Moreover, after seeing how much time it took to get the 2D LED matrix board up and running, I did not want to have to repeat that 15 more times to create all 16 layers of the LED cube.
My new project idea was to create a hybrid digital/analog automotive dashboard, specifically one for a racing vehicle. Being interested in motorsports, one of my plans for this upcoming winter break that I've been thinking about for a while is to build a full-sized drift kart from scratch. I decided that it would be nice to get a head start on this project by building part of the electronics for this project, and that is how I can up with the idea of building a car dashboard.
[4] Dashboard Details
Racing dashboards look something like this:
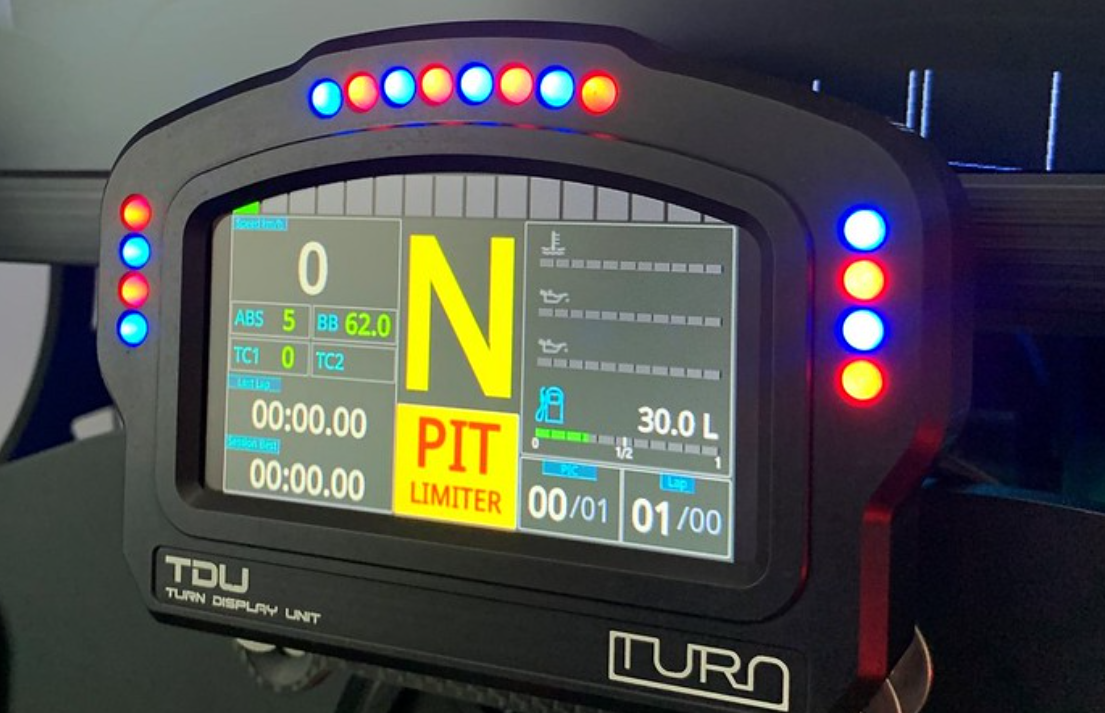
This is usually a lot more data and engine information than you would see on a production vehicle, and rightfully so -- performance vehicles are running at the limits of what the engine can handle, and therefore it is crucical to monitor all of the various aspects of engine information. If even one thing is wrong, such as a slightly low fuel pressure or overly lean air-fuel ratio, serious consequences could ensue such as complete engine destruction.
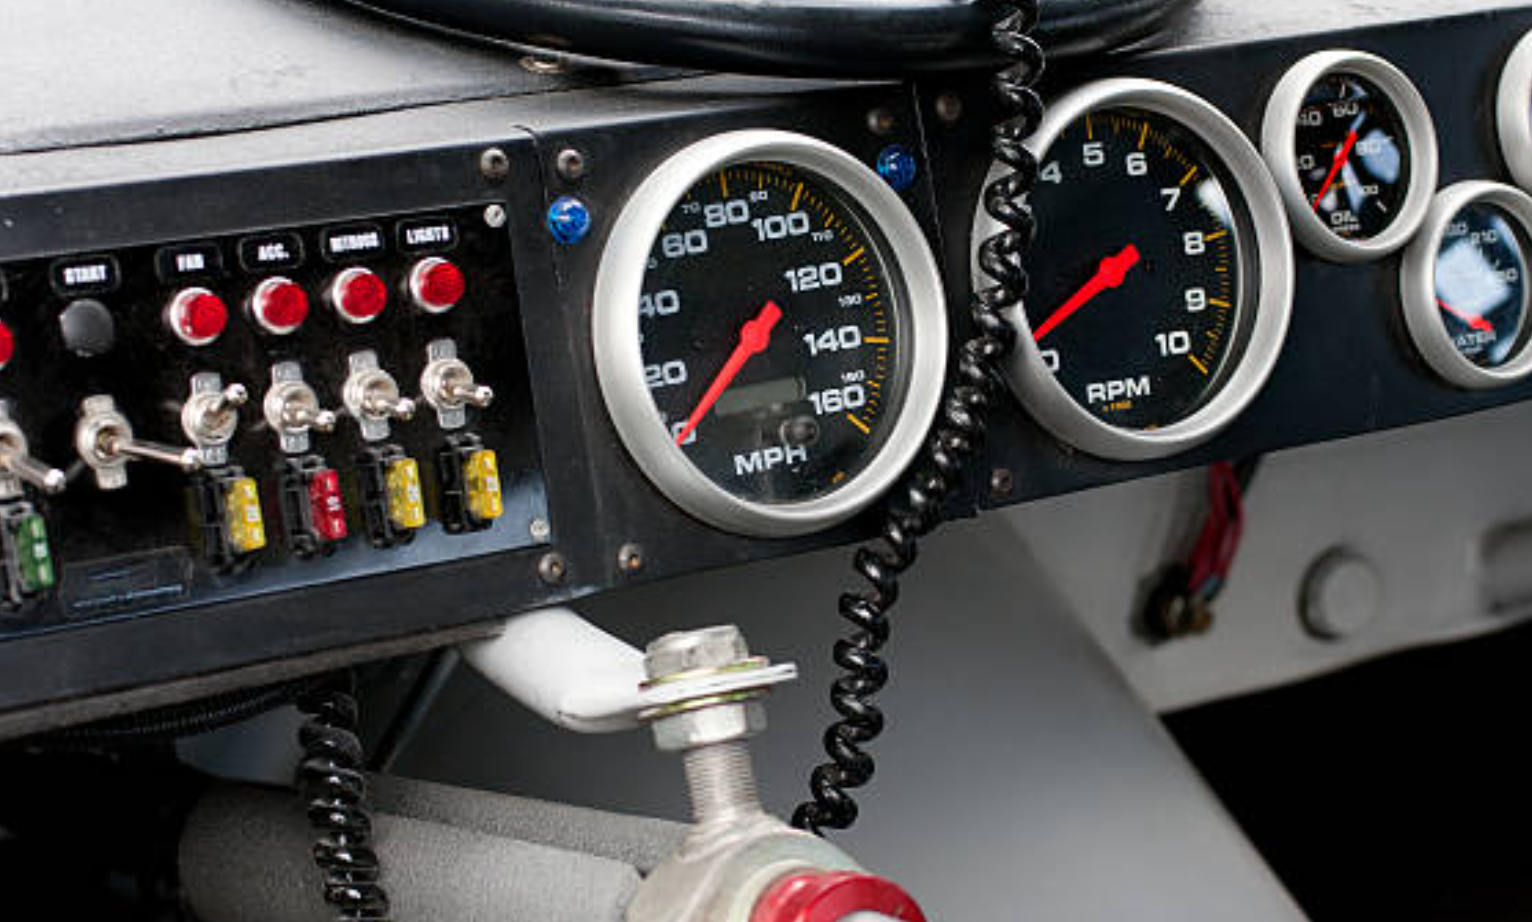
Most of these racing dashboards, however, and entirely digital: they consists of one large screen that displays all of the information. I wanted my dashboard to combine both digital screens and analog gauges, since I personally enjoy the look of moving mechanical gauges. As for what data the dashboard should display, I came up with the following preliminary list:
Engine RPM (tachometer), transmission gear indicator, vehicle speed (speedometer), intake manifold/boost pressure, coolant temperature, oil temperature and pressure, fuel level, battery voltage.
Some other features I wanted to add on were rev lights (which tell you when you should shift gears), race timers (for common things such as 0-60mph, 1/4 mile time, etc.), engine error code viewer and error code clearer.
[5] Implementing the Dashboard
If I wanted to display each of these pieces of data on its own display, I would need a very cluttered dashboard. I decided that a good balance would be having a few analog gauges displaying always-needed information (such as RPM and fuel level), and then having a few screens on the dashboard which could be configured, perhaps using a menu of some sort, to display other data. I sketched out a concept layout for the dashboard which looks like this:
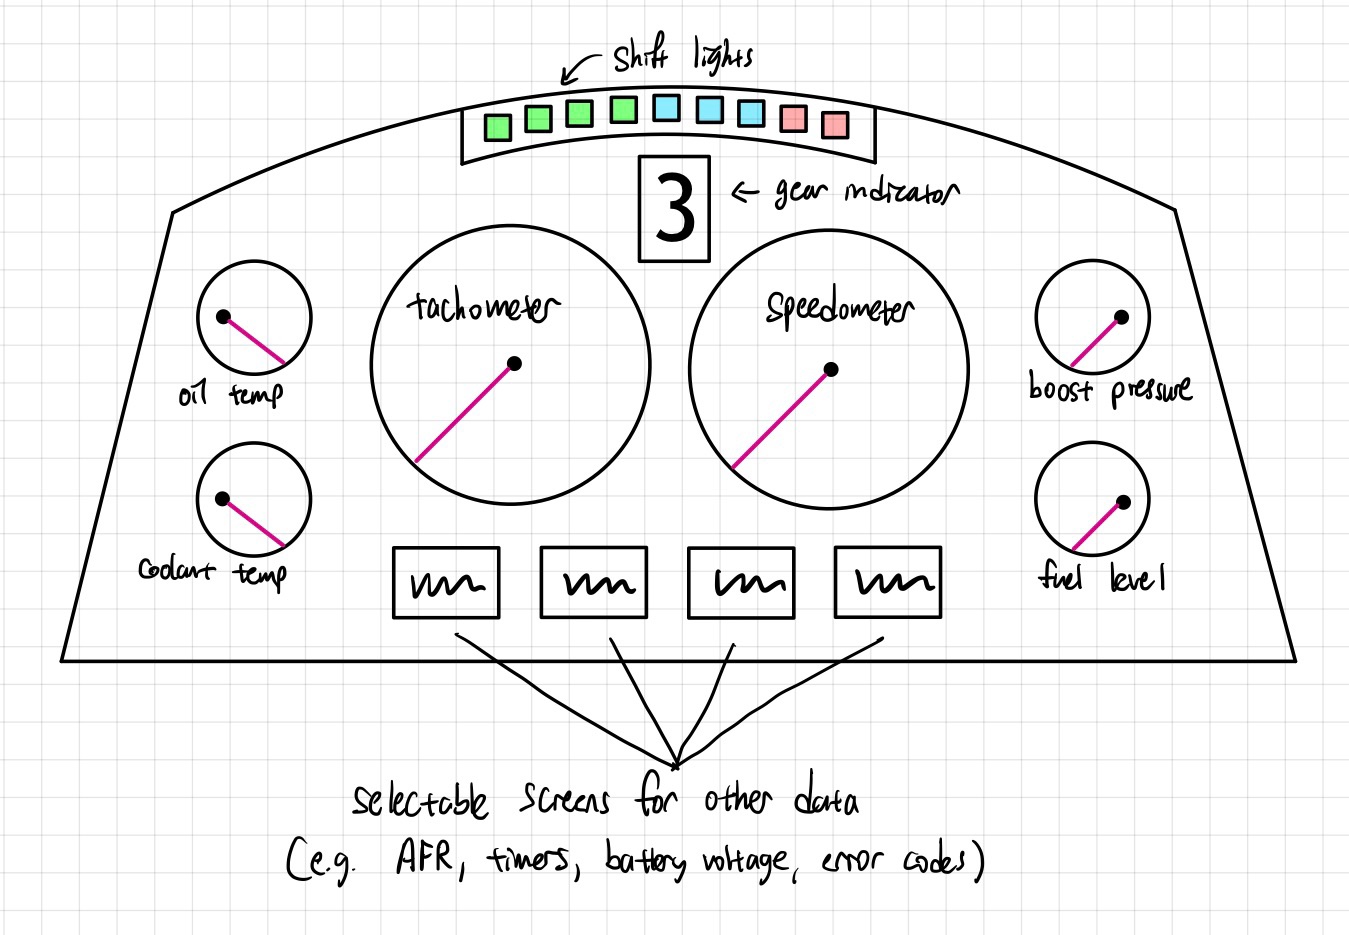
For the electronics of the dashboard, I still wanted to stick with the theme of simplicity in computing power which I wanted to pursue in my 3D LED cube project idea. I ended up deciding that each display, e.g. a digital screen or analog gauge, would have its own processor, and then all of these processors can communicate over a shared bus such as I2C with some master controller. This also felt like a more fun and interesting solution that something such as having a powerful Raspberry Pi reading all of the engine data and controlling every single display. The modular design of the dashboard -- by having many individual chainable display modules -- is also what gave birth to the project name, EX-DASH. It stands for Easily EXtensible Dashboard, referring to the feature that the dashboard can be customized by adding on different chainable modules.
[6] Interfacing With a Car
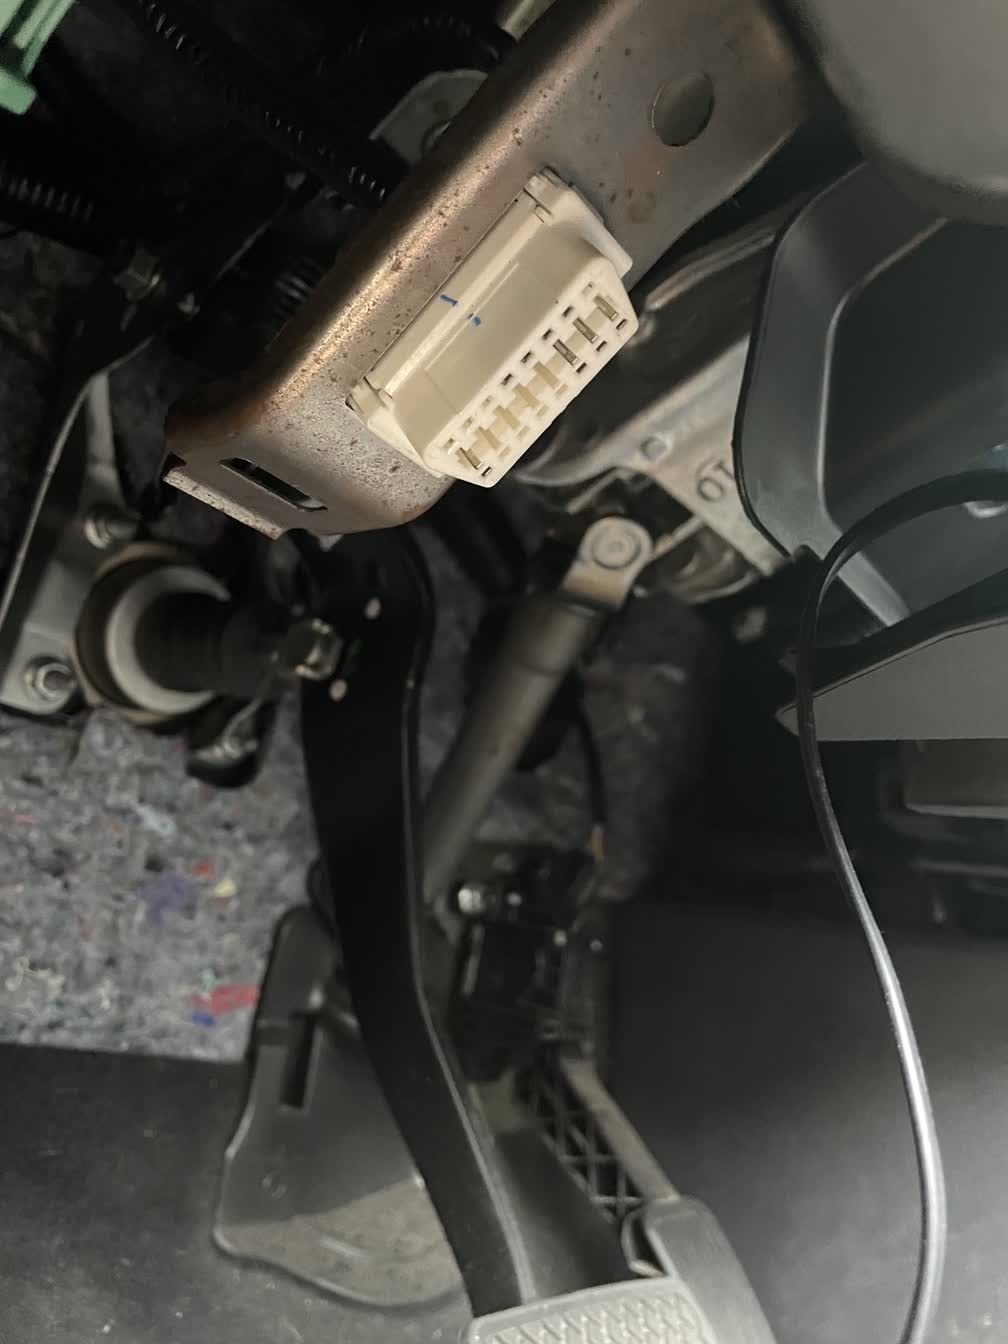
Most cars (and all manufactured after 2008) have a diagnostic port called the OBD2 port -- this connects directly to the car's engine control unit (ECU) and is able to relay information about the engine from the ECU to whatever device is connected on the OBD2 port. This allows the user device to request a view all sorts of engine parameters, much more than what is conventionally display on a normal car's dashboard. The OBD2 port runs on the CAN bus, which is fortunately a standardized interface that can be connected to a microcontroller with a small bit of external circuitry. For example, the OBD2 port is located under the steering wheel in my car:
To interface between the microcontrollers I am using and the OBD2 port, I bought a commercial OBD2 bluetooth reader based on the ELM327 chip. I then took it apart and desoldered the bluetooth module, following this guide. Since the bluetooth module in the OBD2 reader simply acts as a serial bridge, this means interfacing with the OBD2 reader is quite simple -- by connecting a microcontroller's serial pins to the serial pins where the bluetooth module would have been, this allows the microcontroller to directly talk to the ELM327 chip which translates data from the CAN bus into serial data.
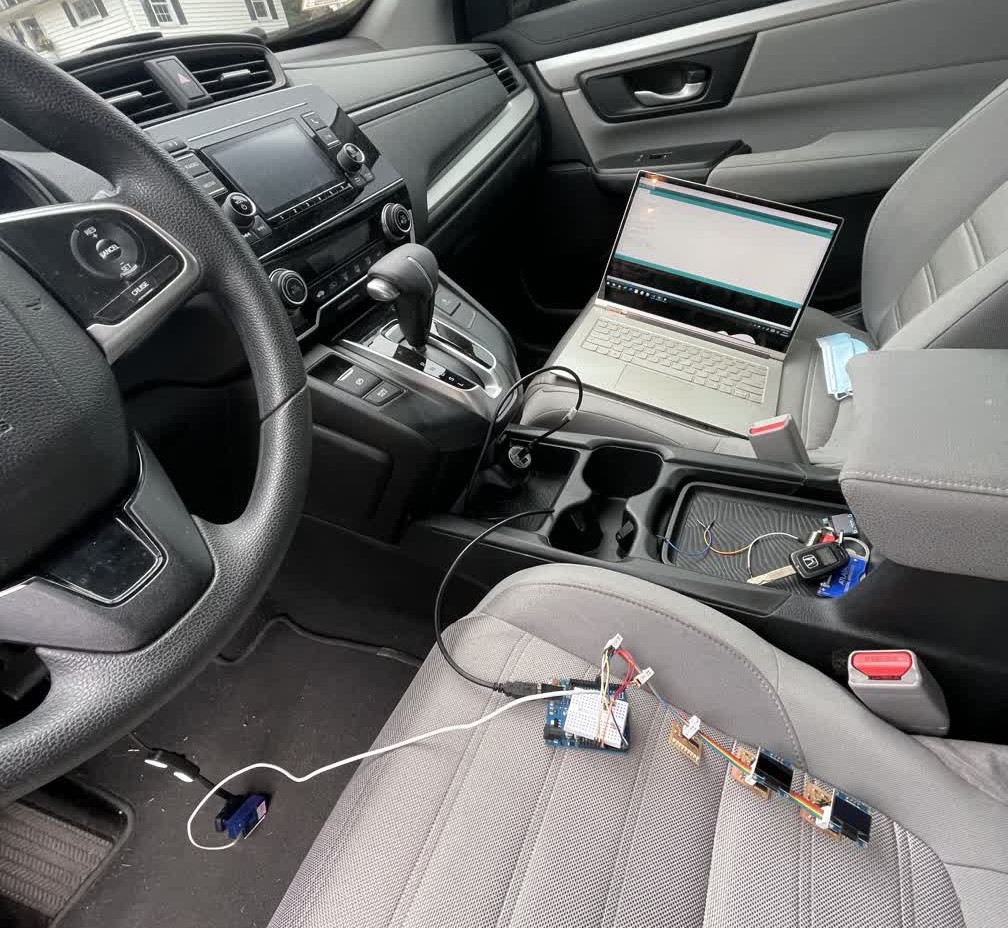
To test this out, I connected the serial input from the OBD2 reader to an Arduino Uno, which then forwarded data from the car's ECU onto an I2C bus to which I had connected my networking project from week 10. This is what the entire set up looked like:
I was able to run some example code which displayed the engine RPM and throttle percentage on the two screens, as well as the engine RPM in binary on the LED display:
[7] Designing The Dashboard
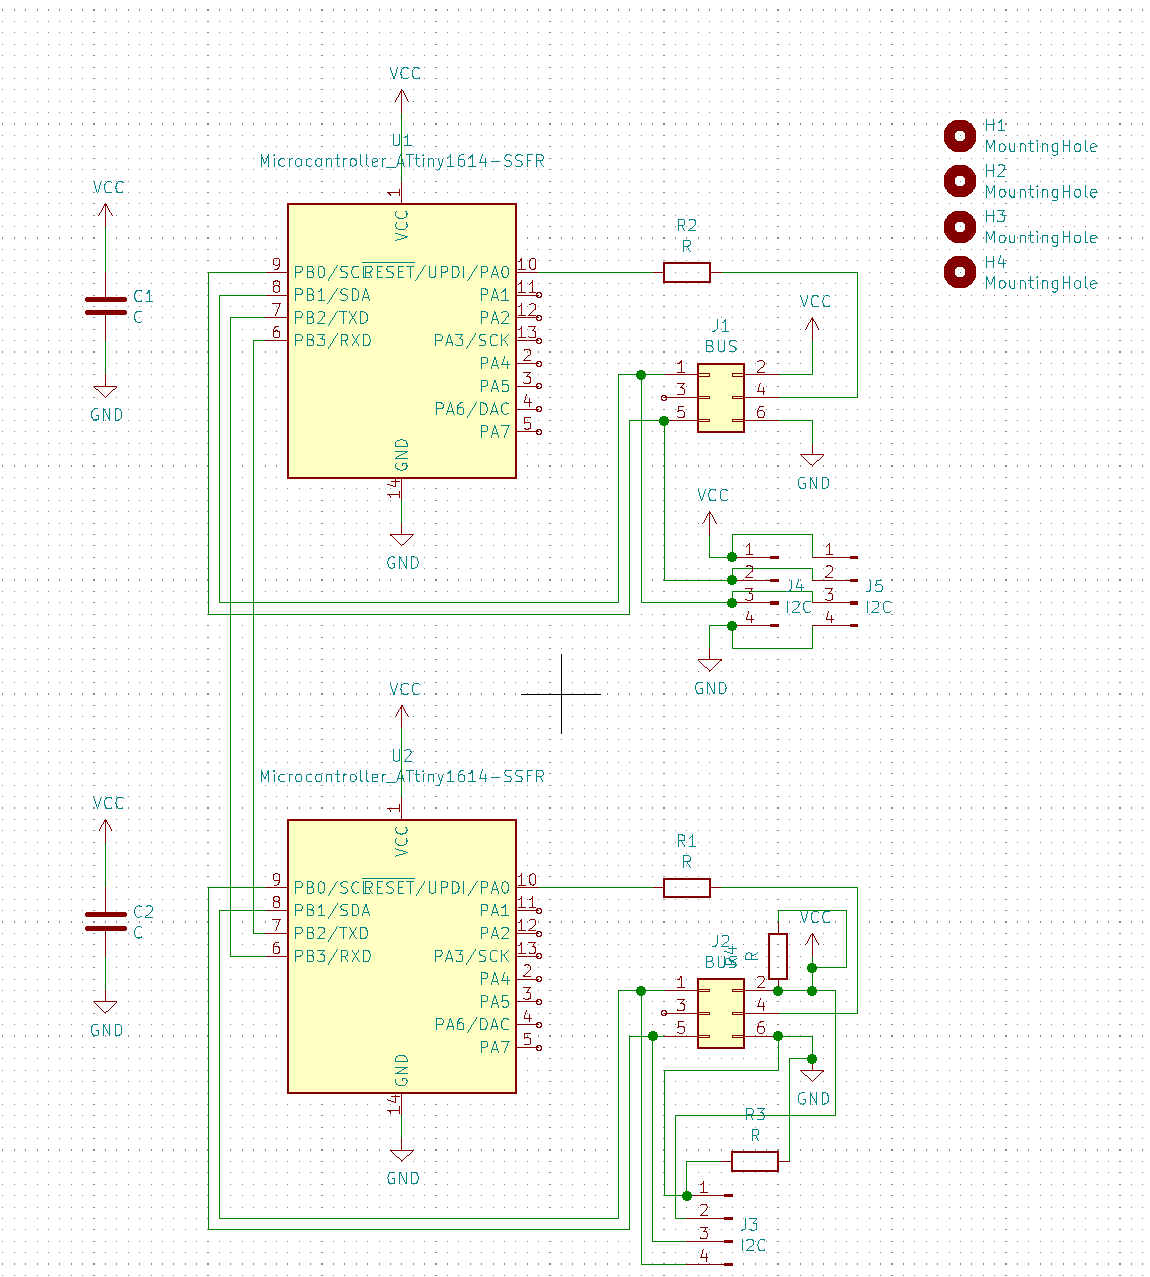
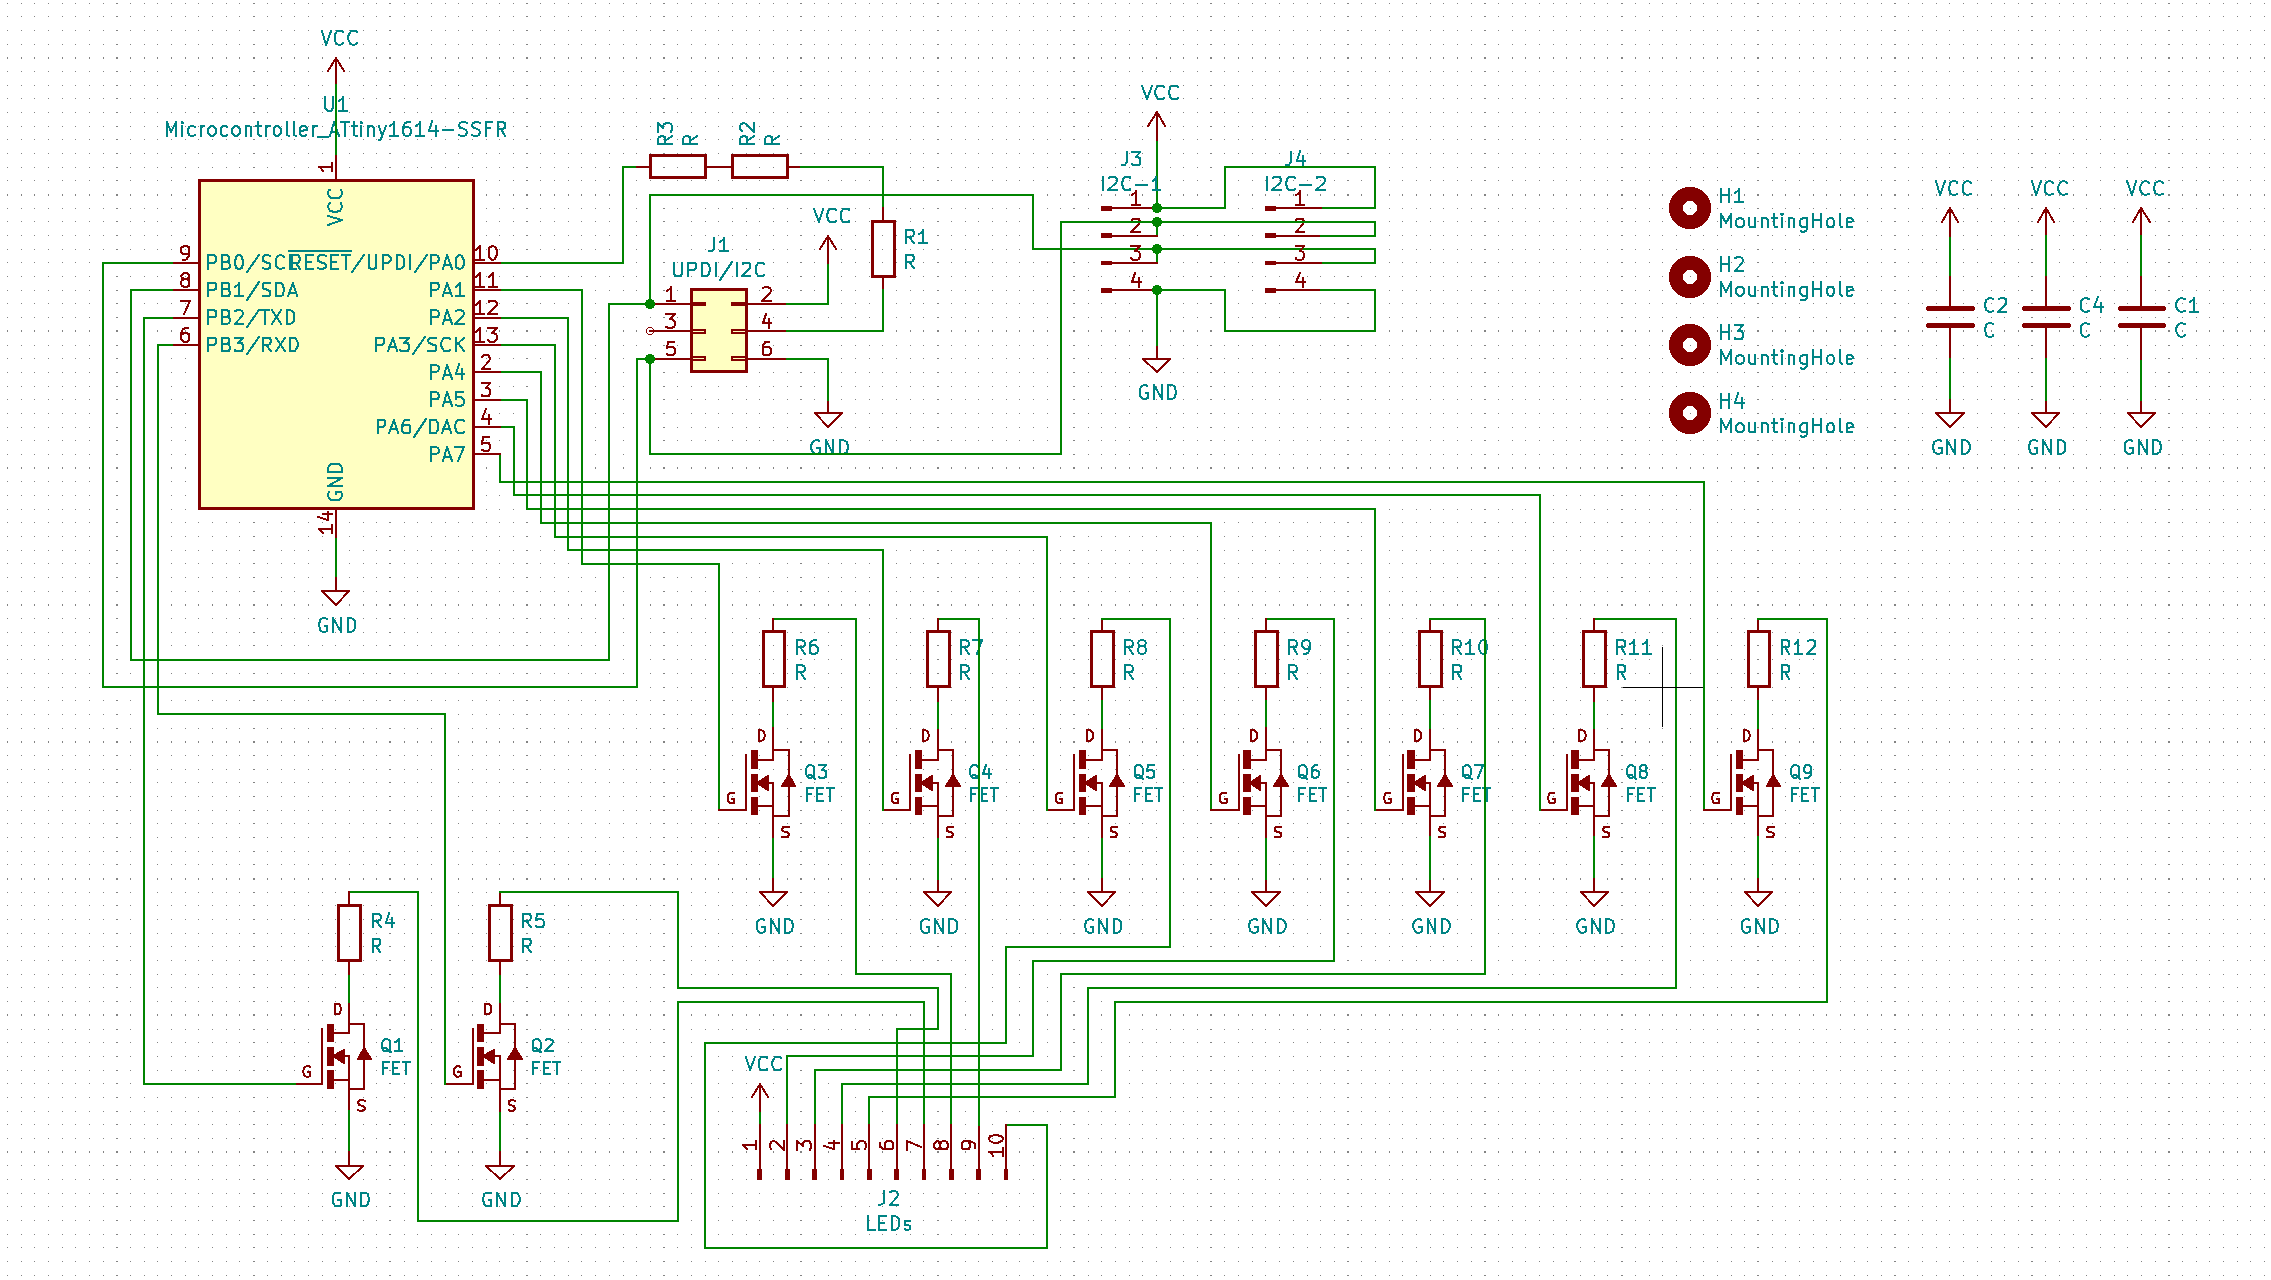
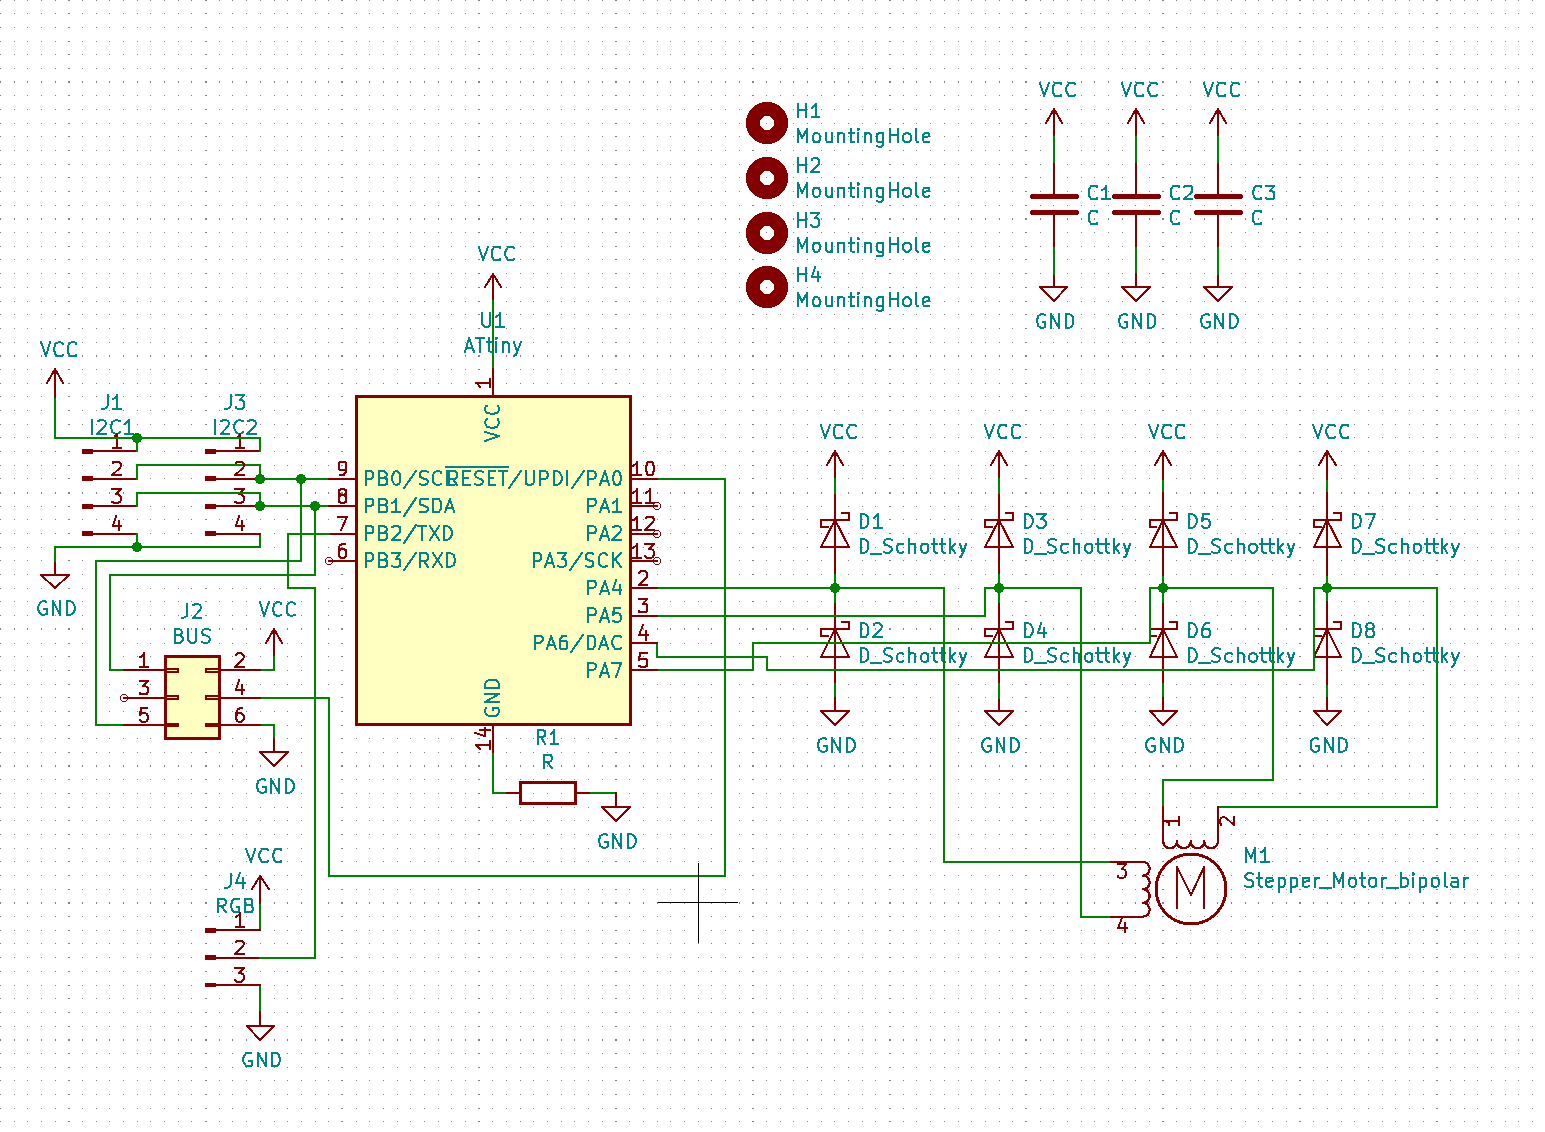
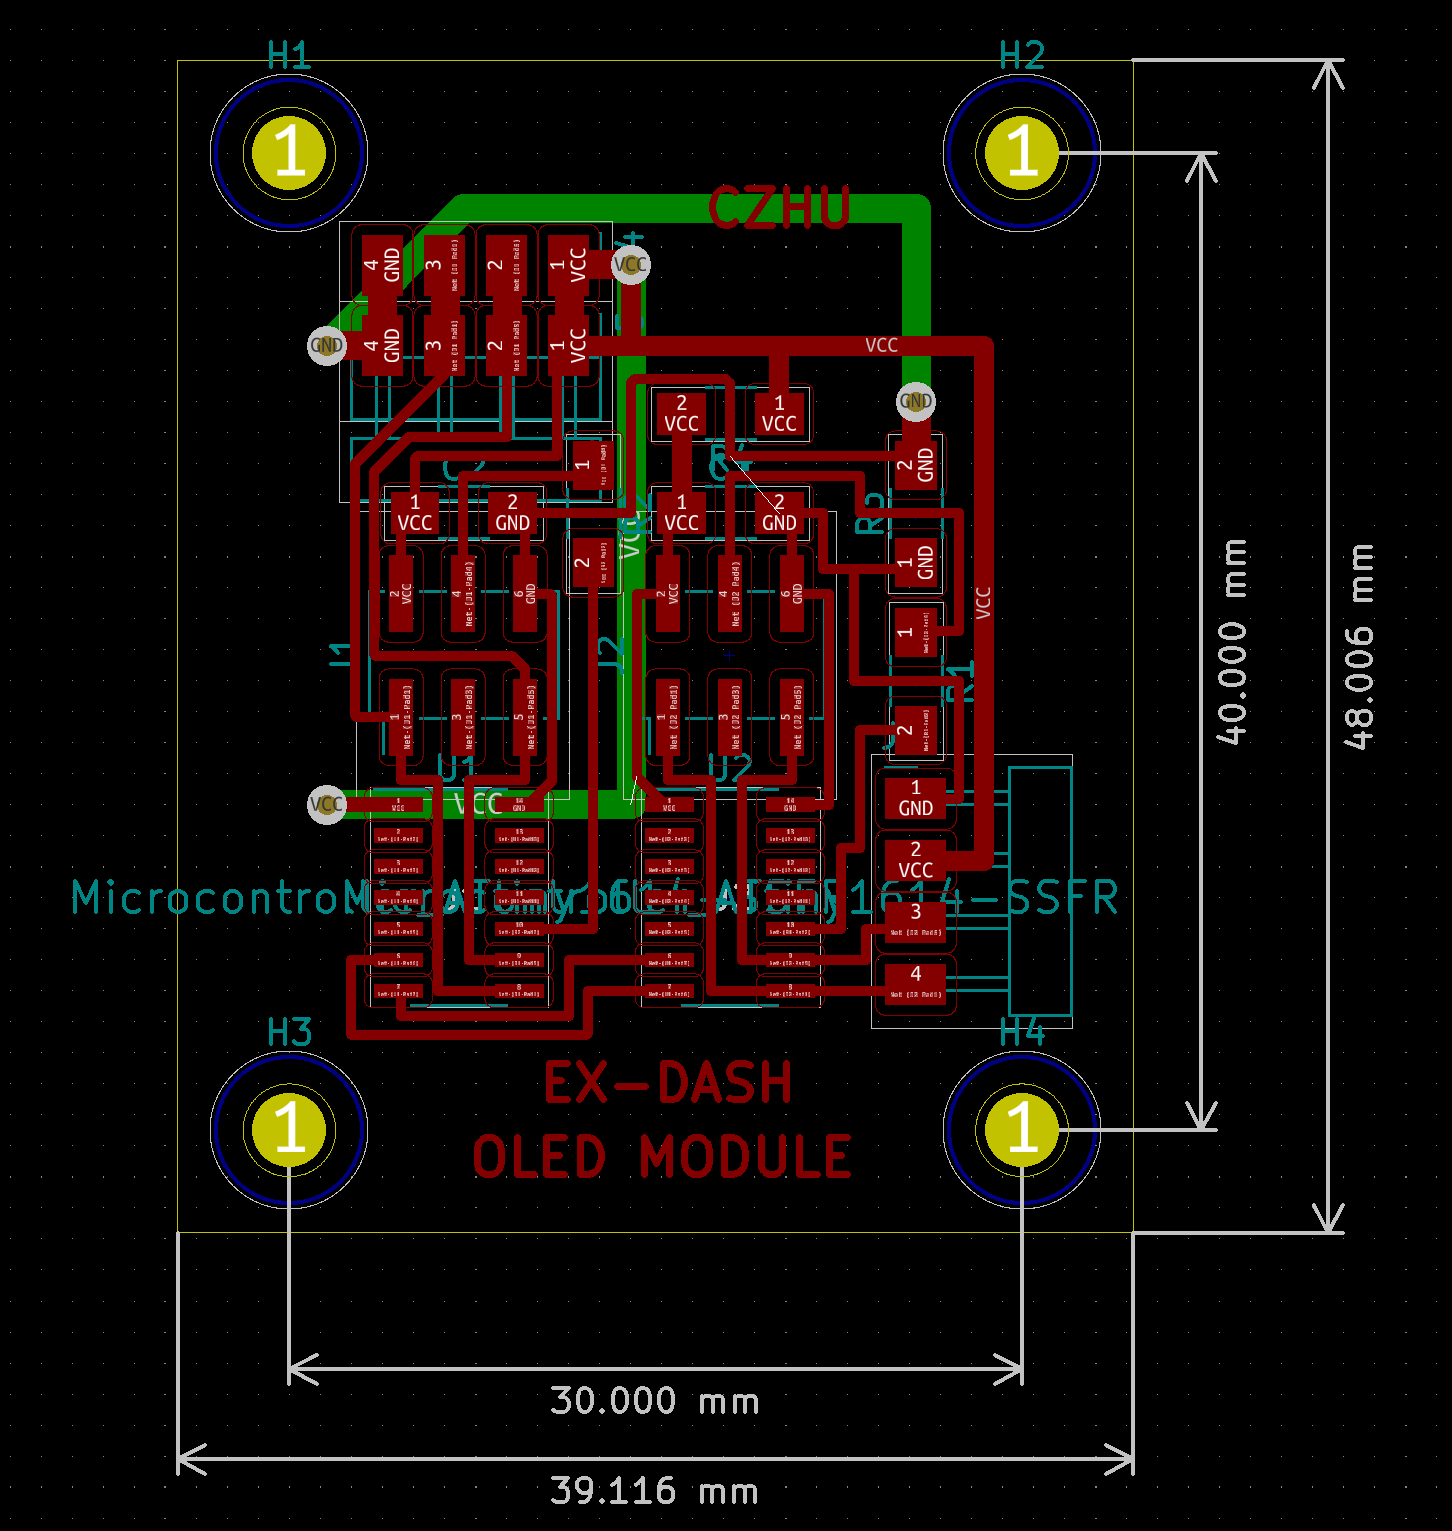
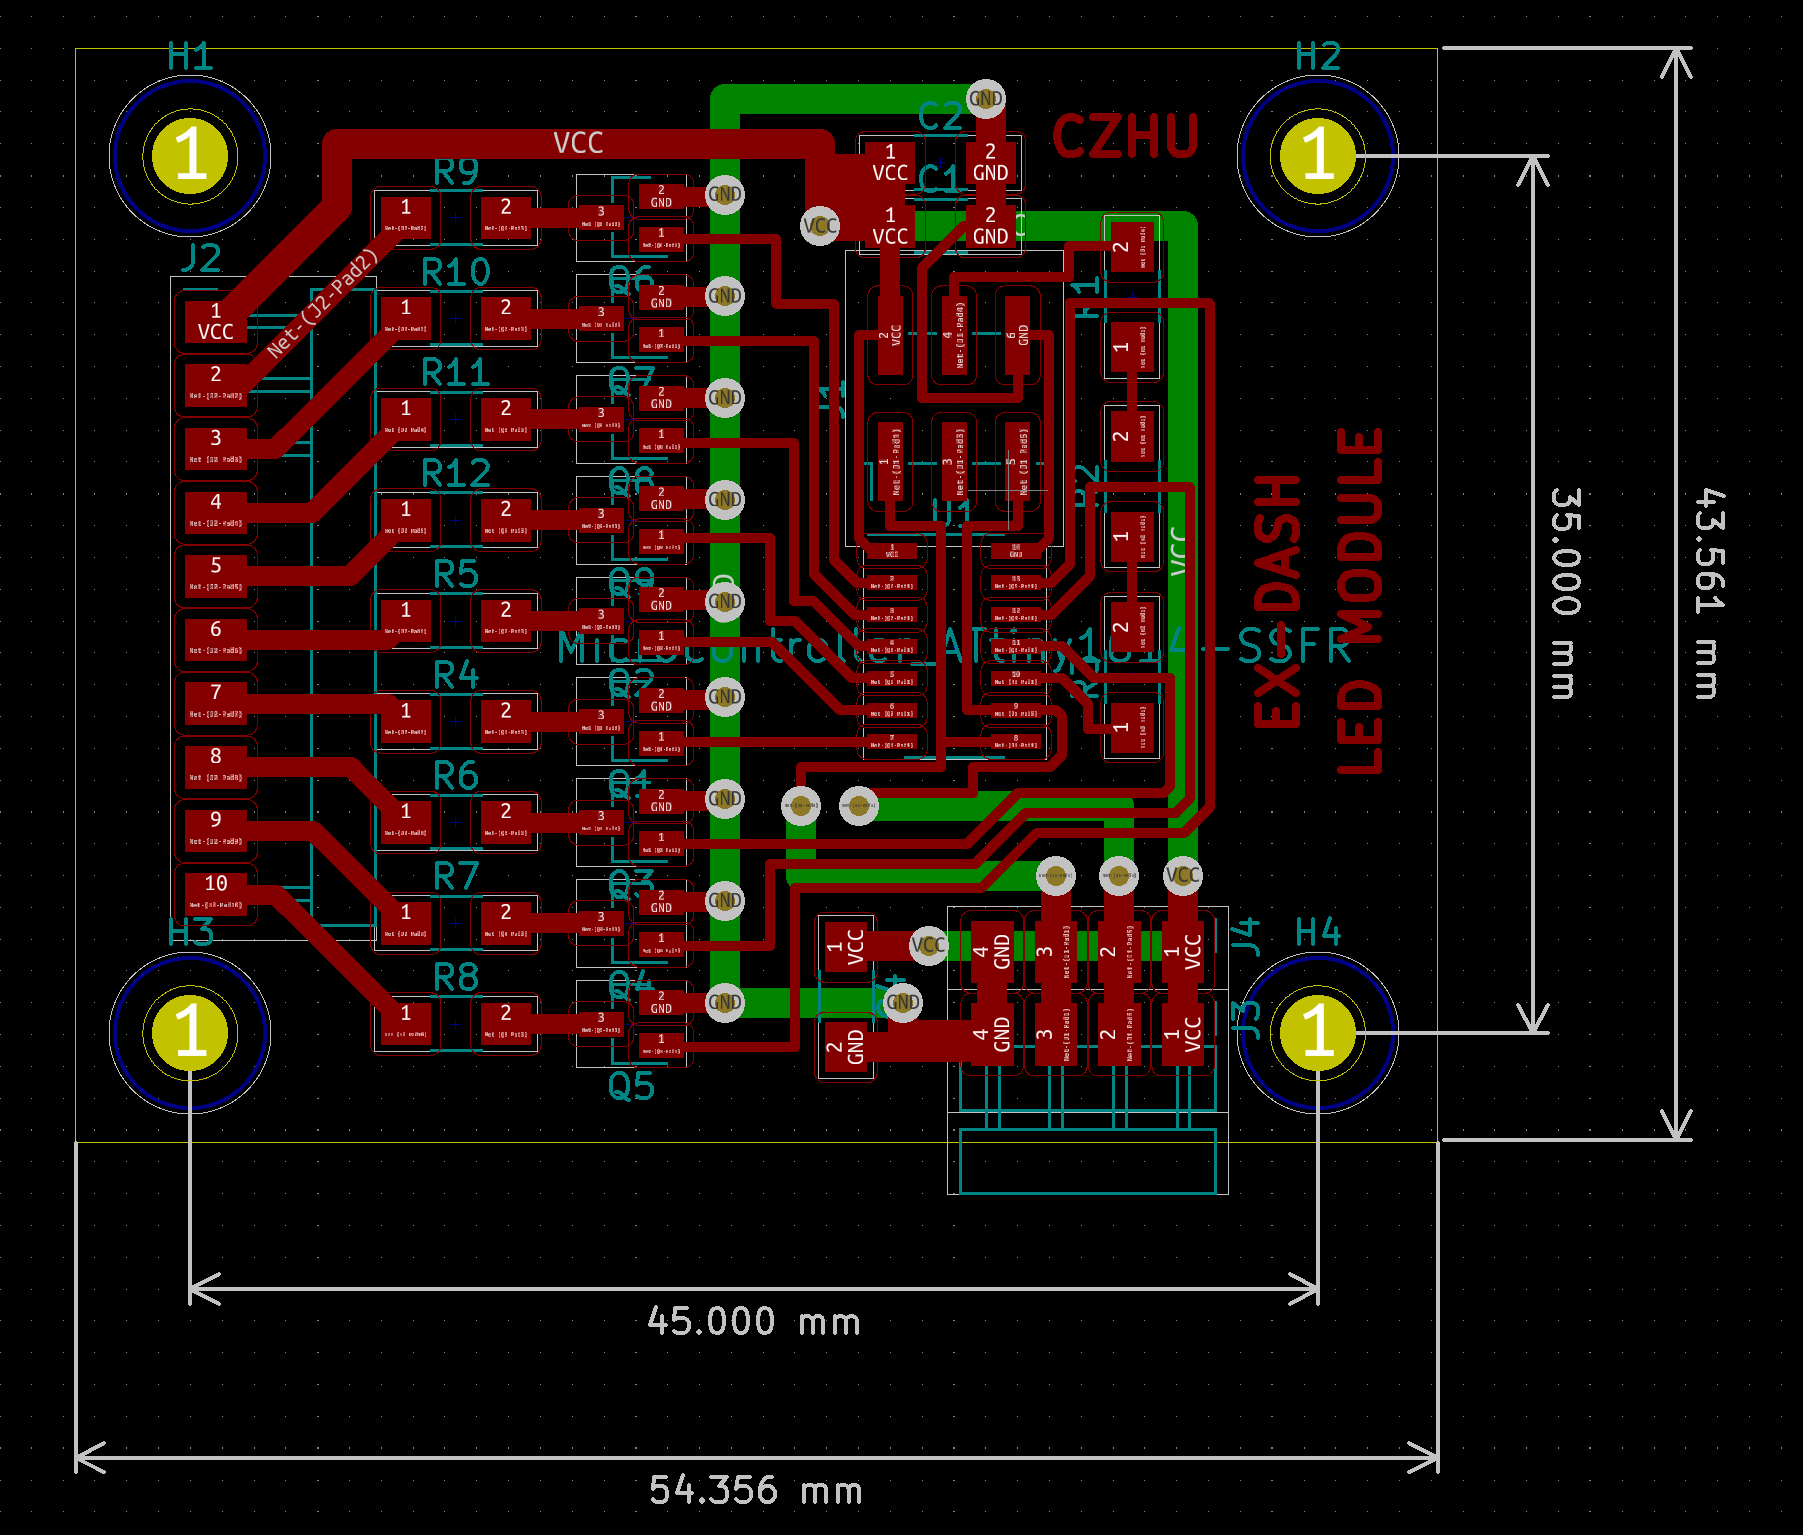
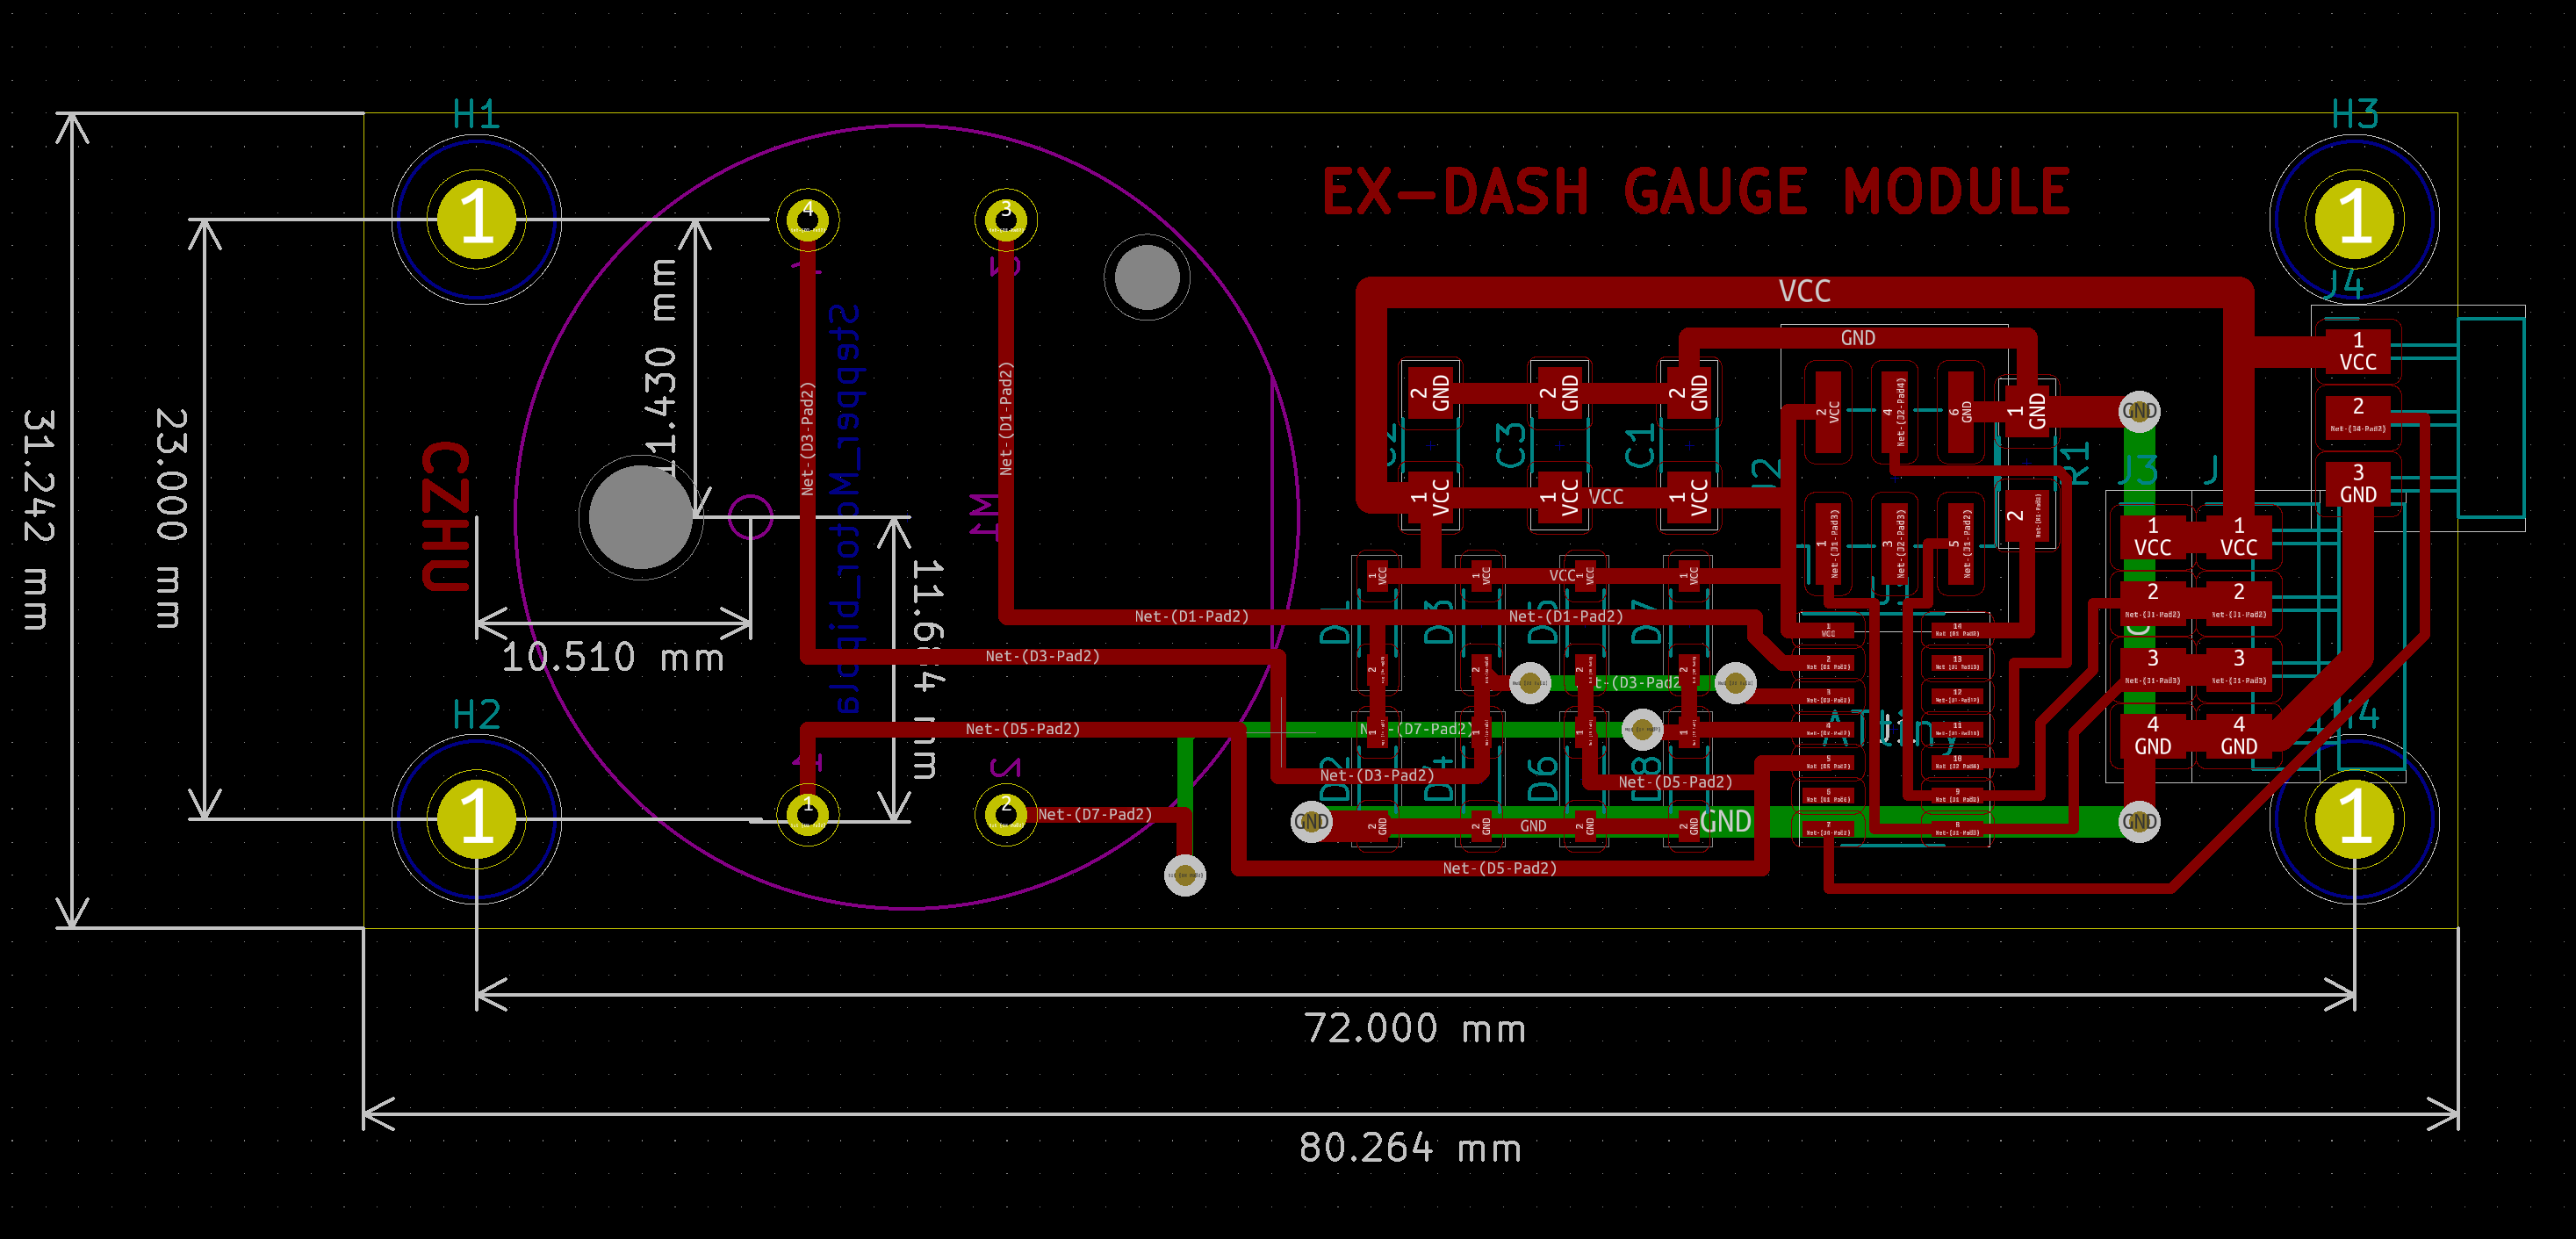
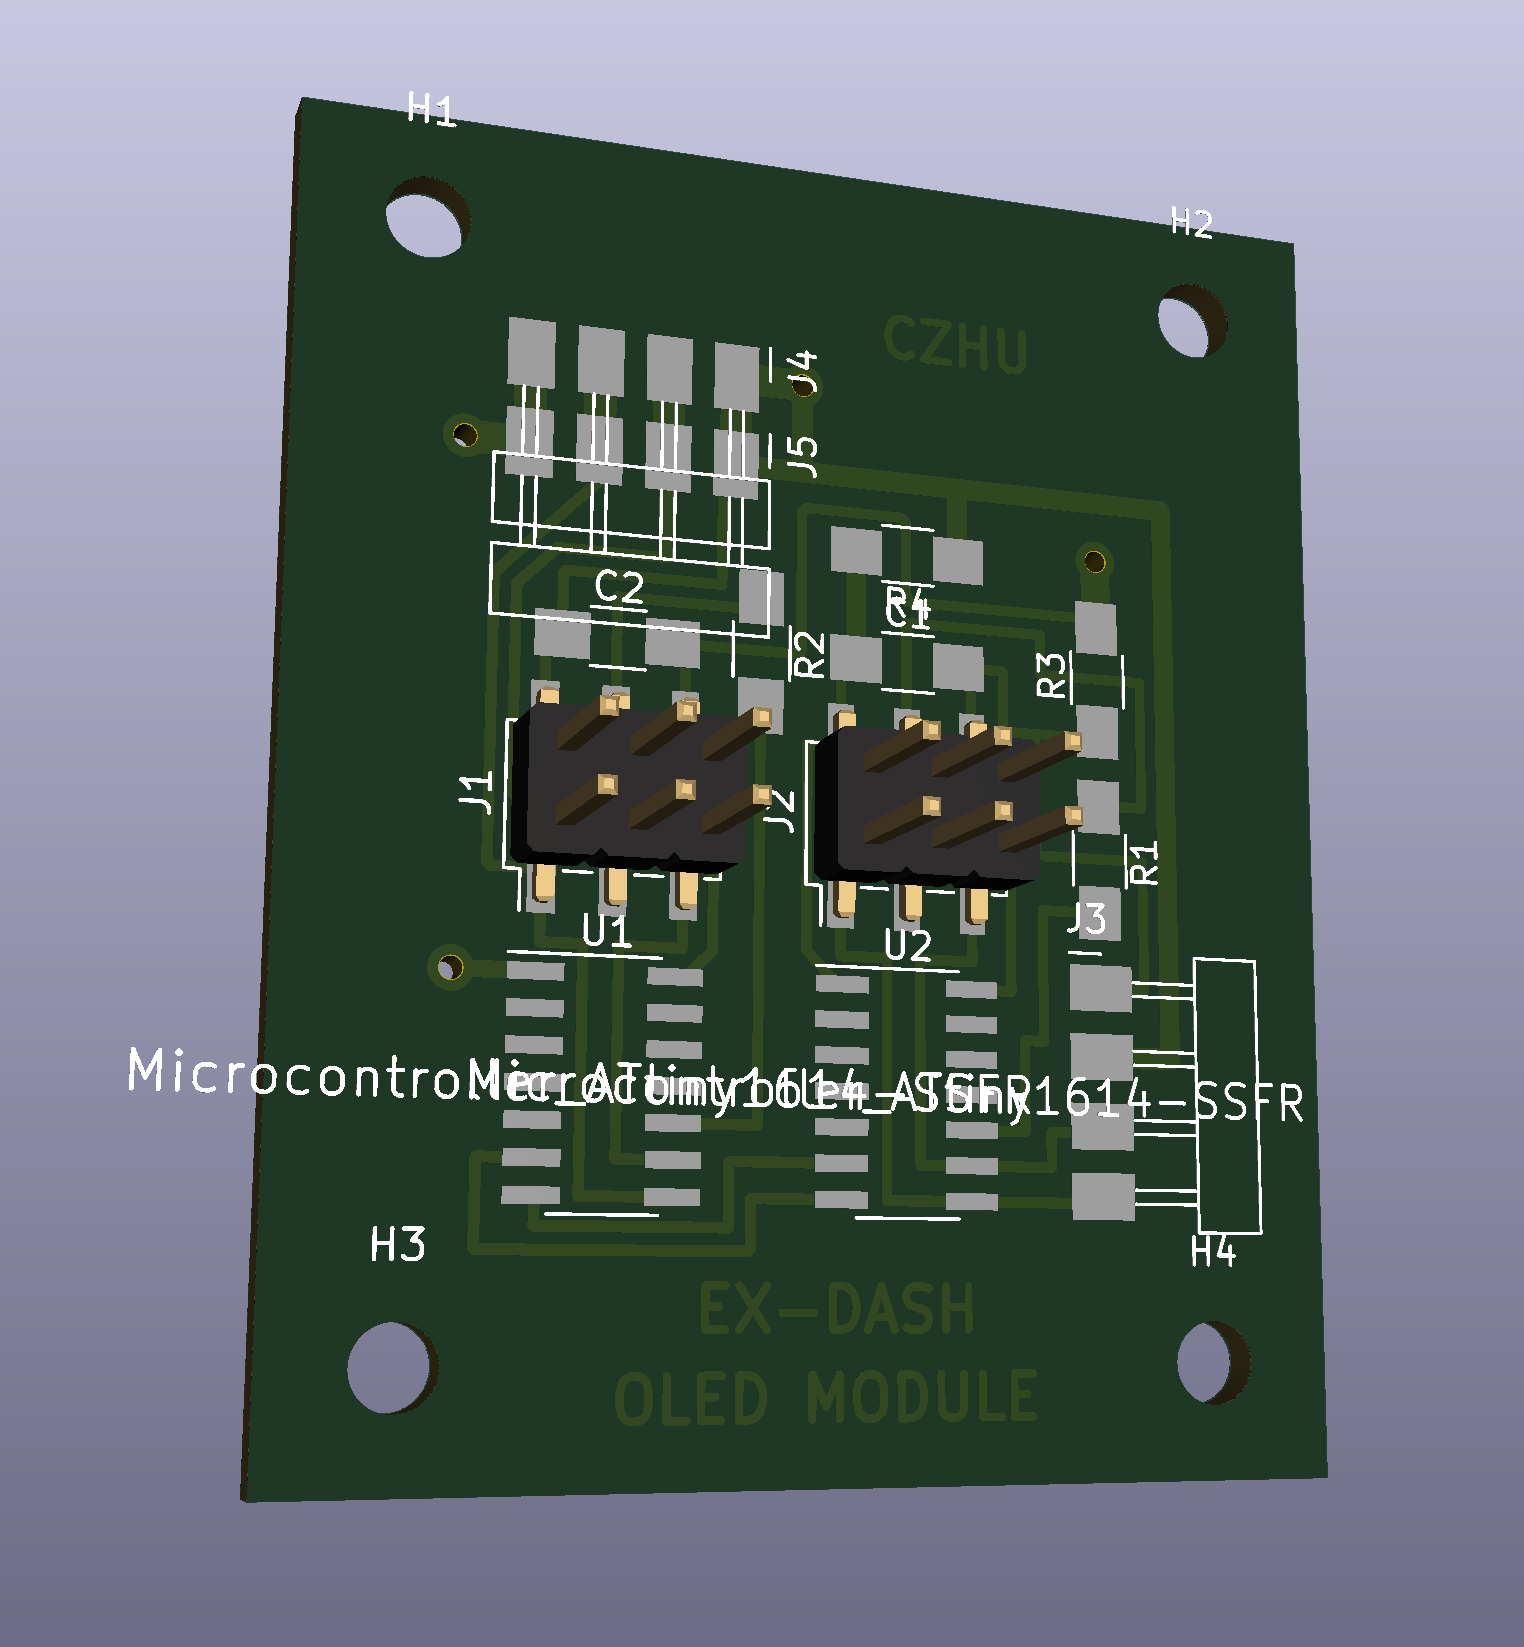
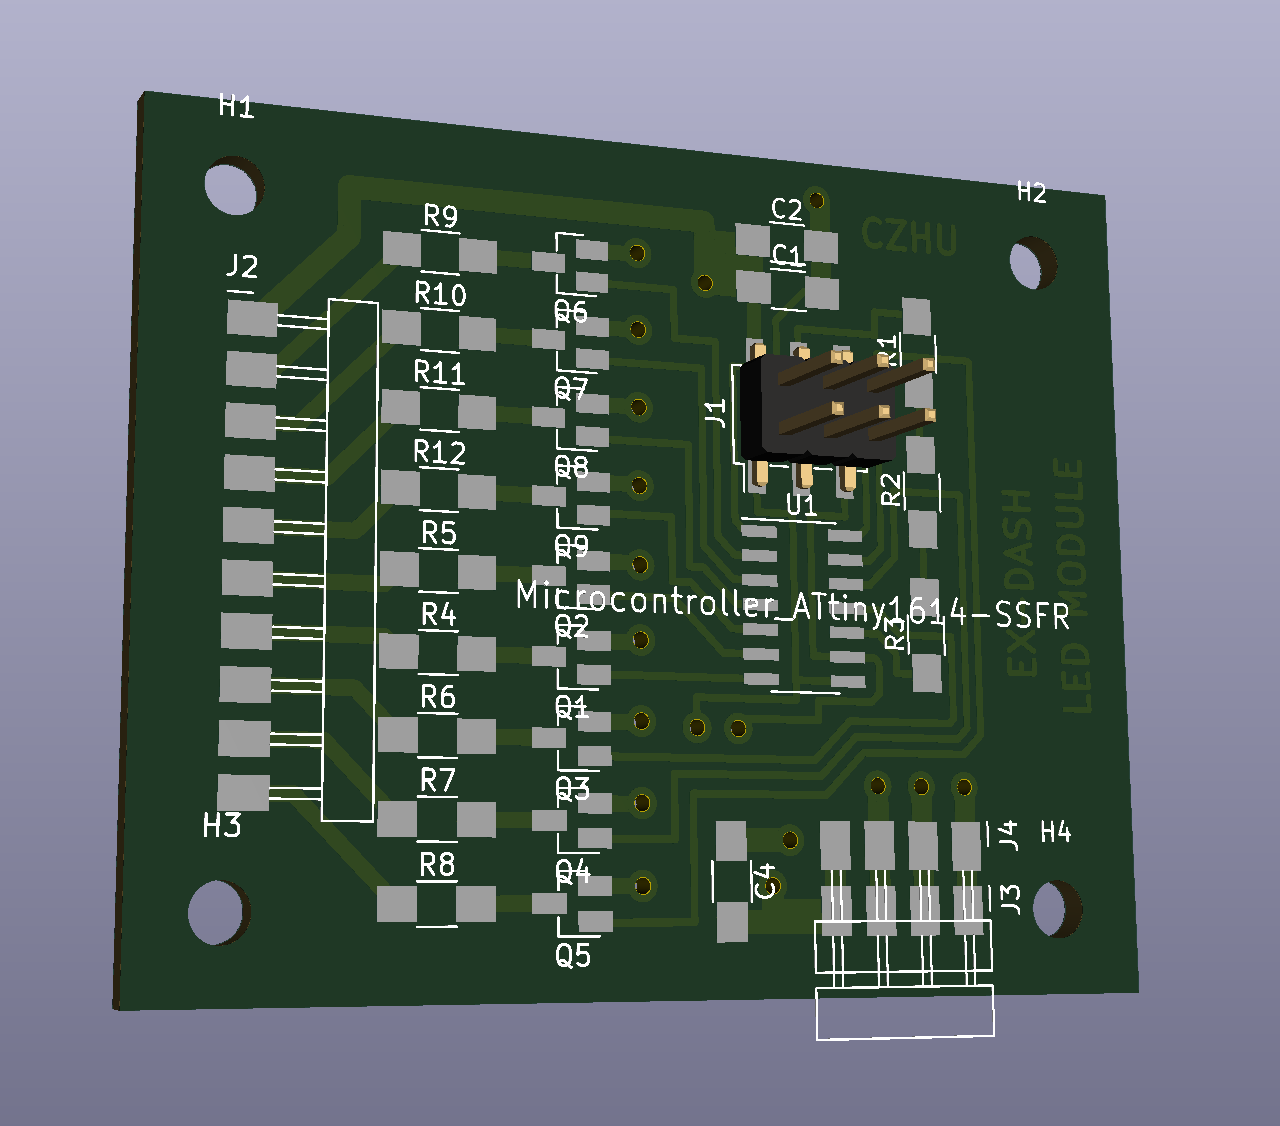
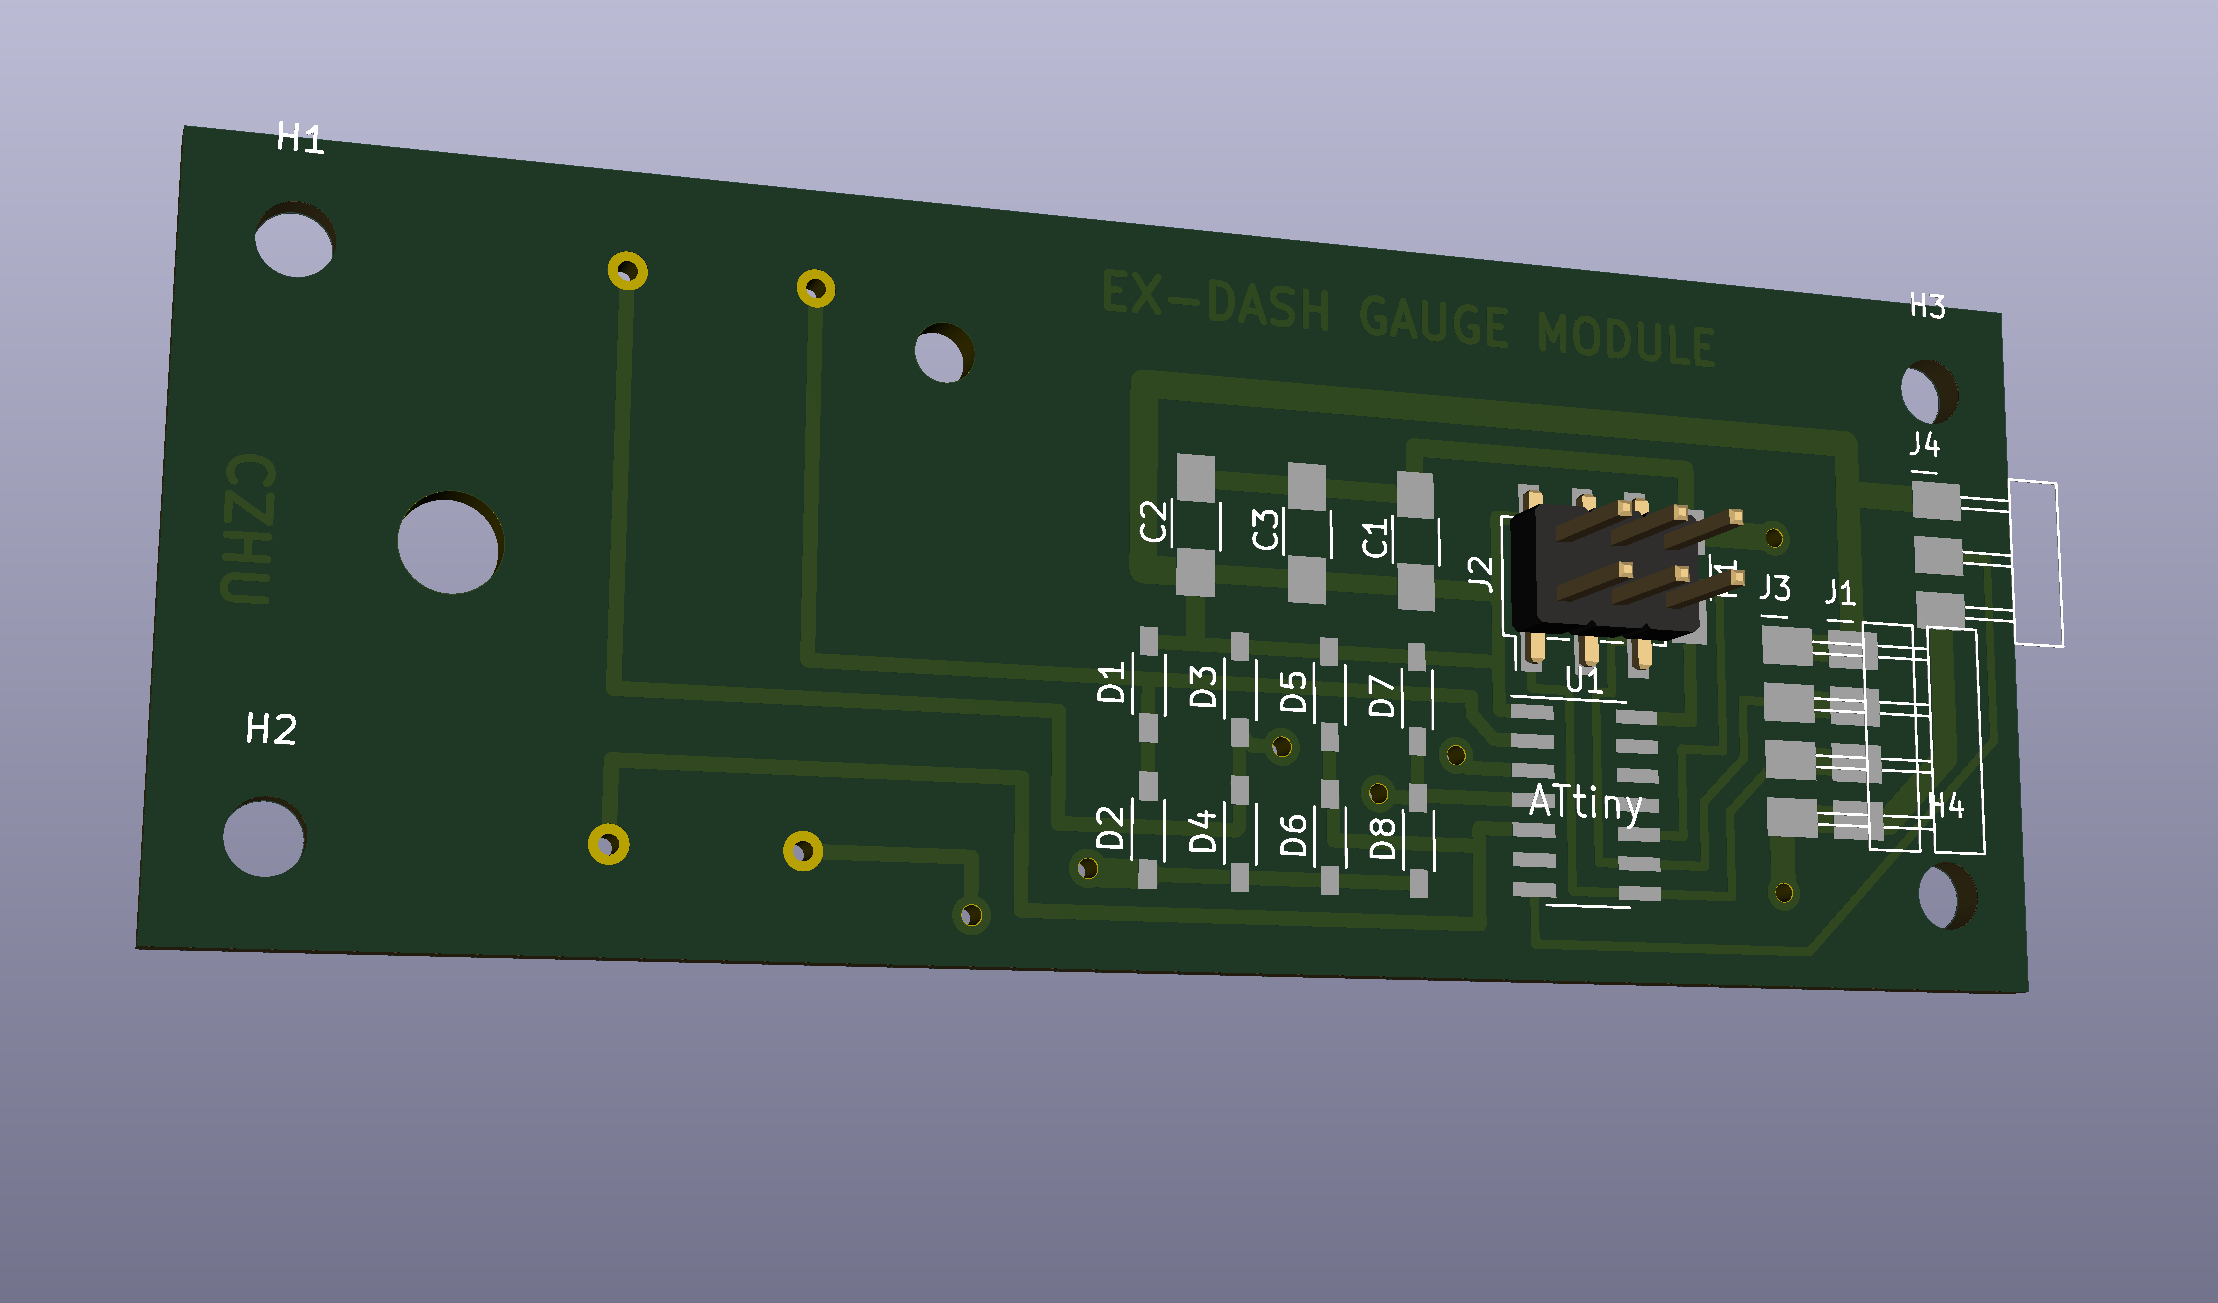
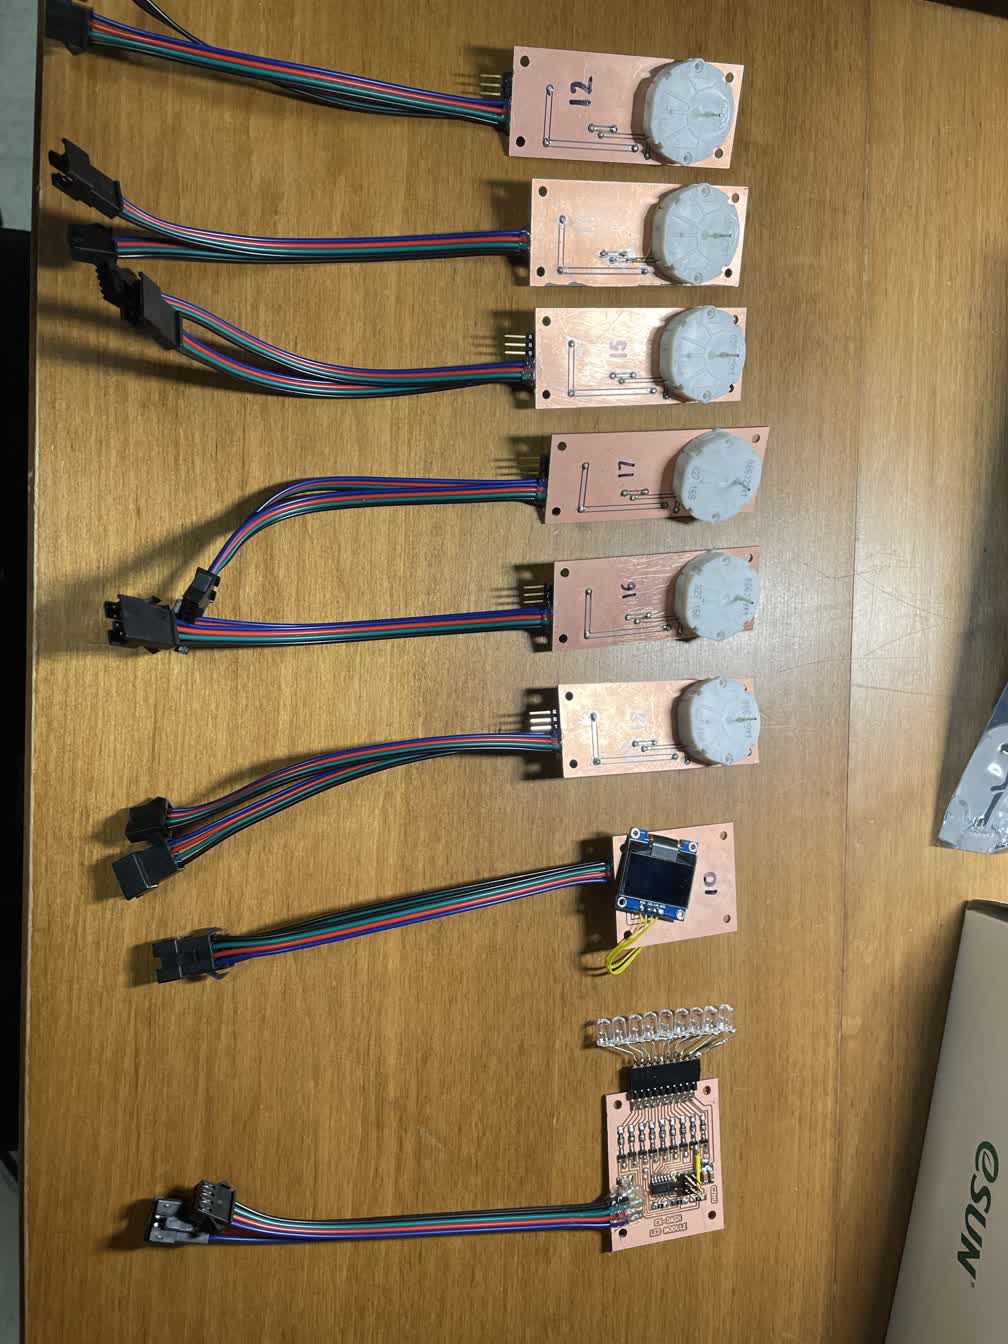
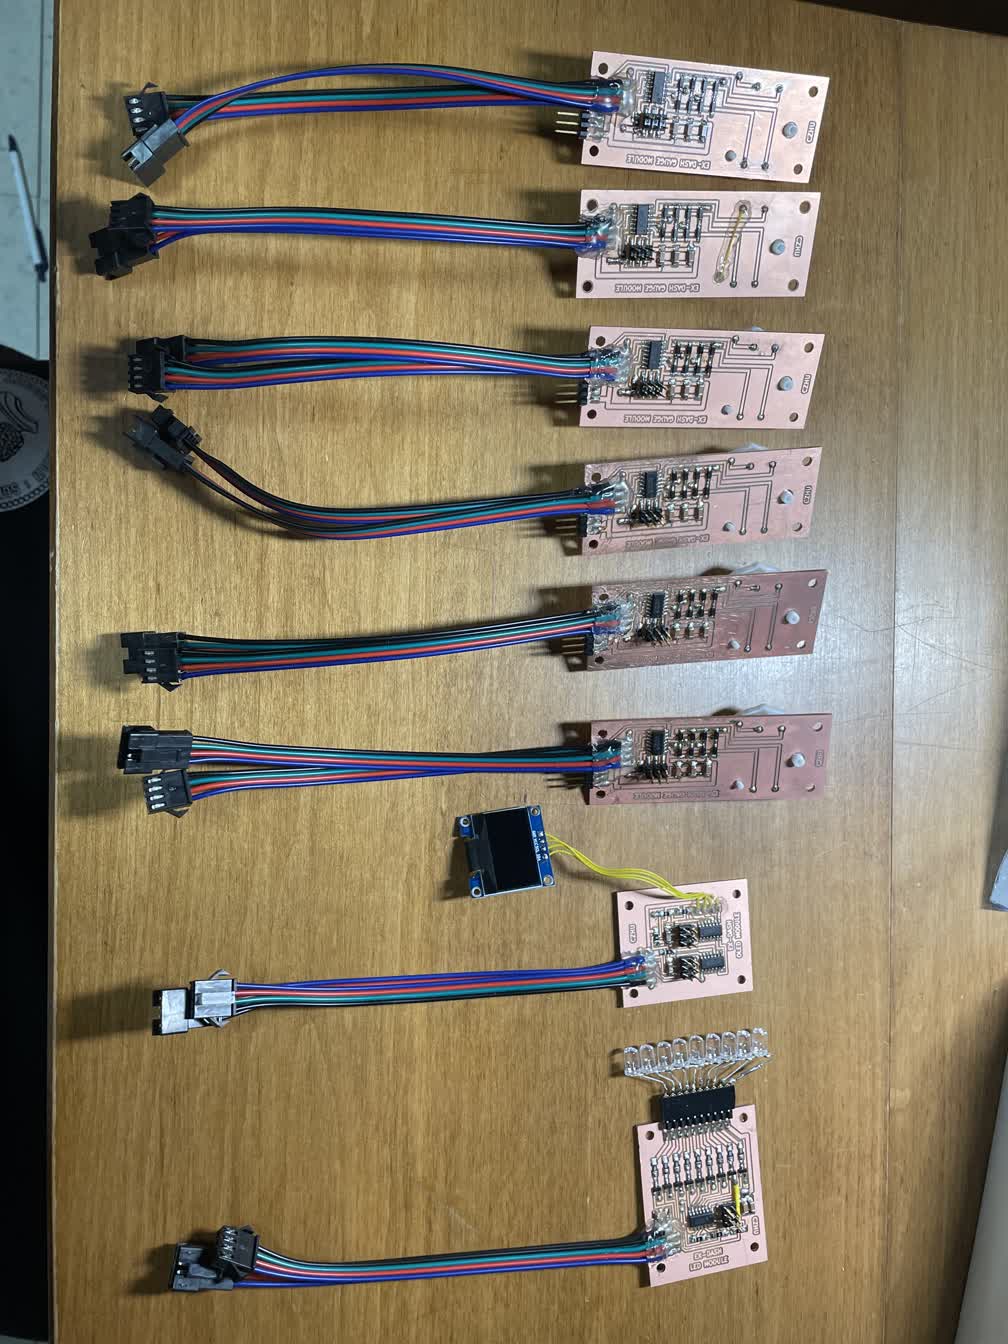
After confirming that I was able to interface with my car and retrieve engine data on I2C (via another Arduino acting as a bridge between the OBD2 reader via serial and the I2C bus), I began making the parts for my dashboard. Since the whole dashboard was to be modular, I split up the design into one board for controlling LEDs, one board for controlling an OLED display, and one board for controlling an analog gauge stepper motor. That way, if I wanted six gauges, I could just make six copies of that board and link them together via I2C. The design of these boards was heavily based on what I had done for the networking week, since that is where most of the planning for this final project happened. The design of the OLED board was nearly identical to what I had in week 10, except I just added large pads to break out the I2C connections which would make everything easy to chain together. For the LED board (which would end up controlling the rev lights), I again used what I had designed during week 10 and added I2C connection pads. Finally, for the stepper motor board, I took the design from week 9 and replaced the ATMega328P with an ATTiny1624, and also added on I2C connection pads. Here are their respective schematics, PCBs, and 3D renderings:
[8] PCB Fabrication
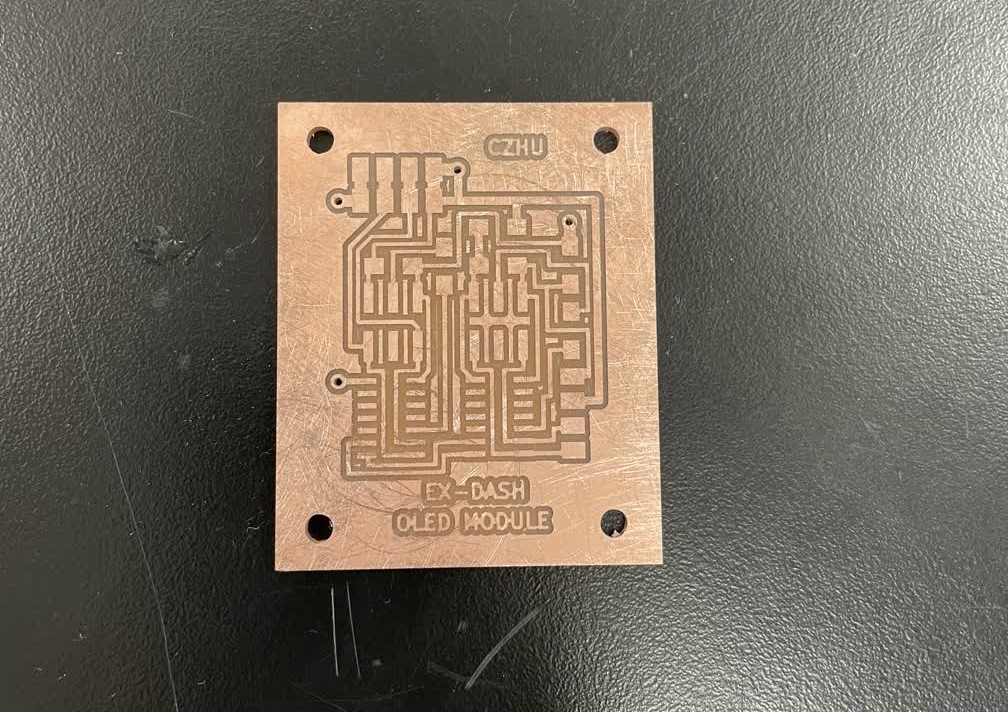
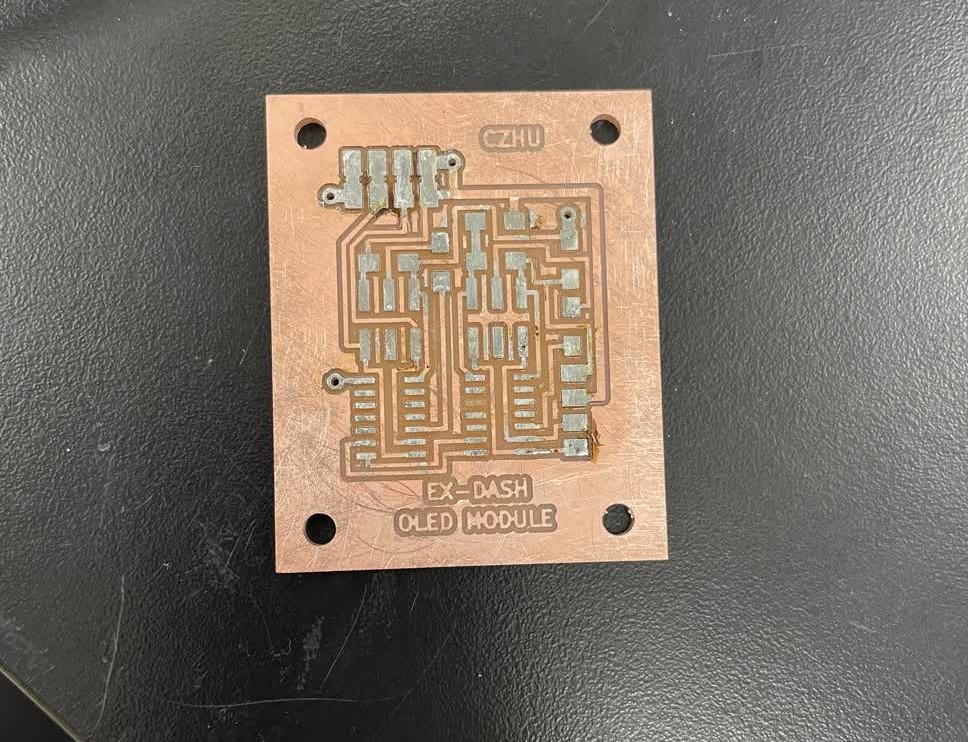
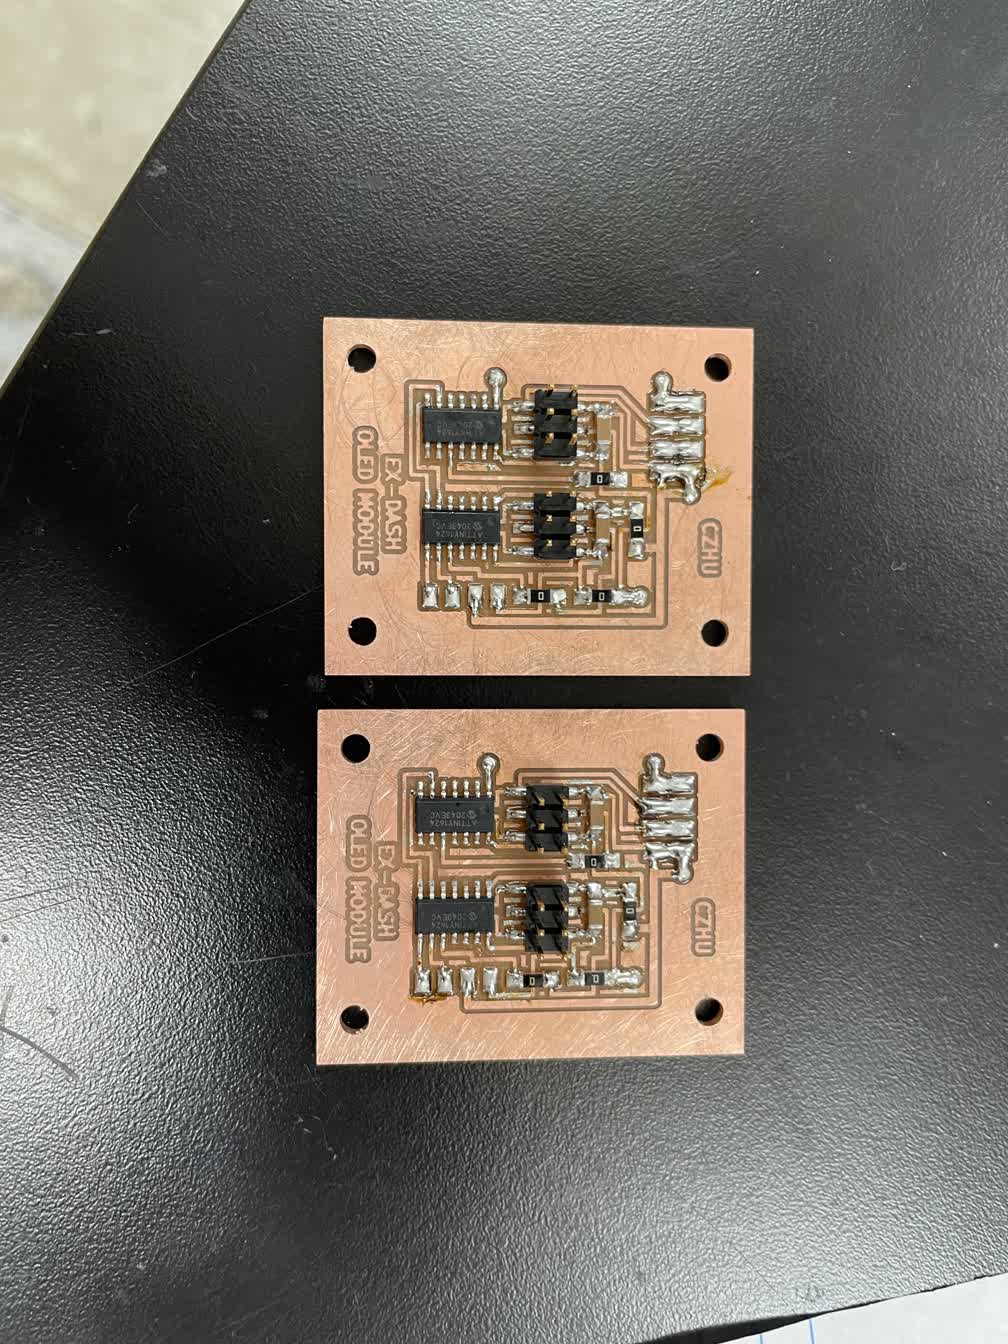
With all of the designs ready, I milled out all of the boards and began soldering all twelve of them. In order to make soldering easier, after milling the boards I would coat all of the pads with solder and use solder wick to desolder the excess. By tinning the pads this way, soldering on the components was much easier:
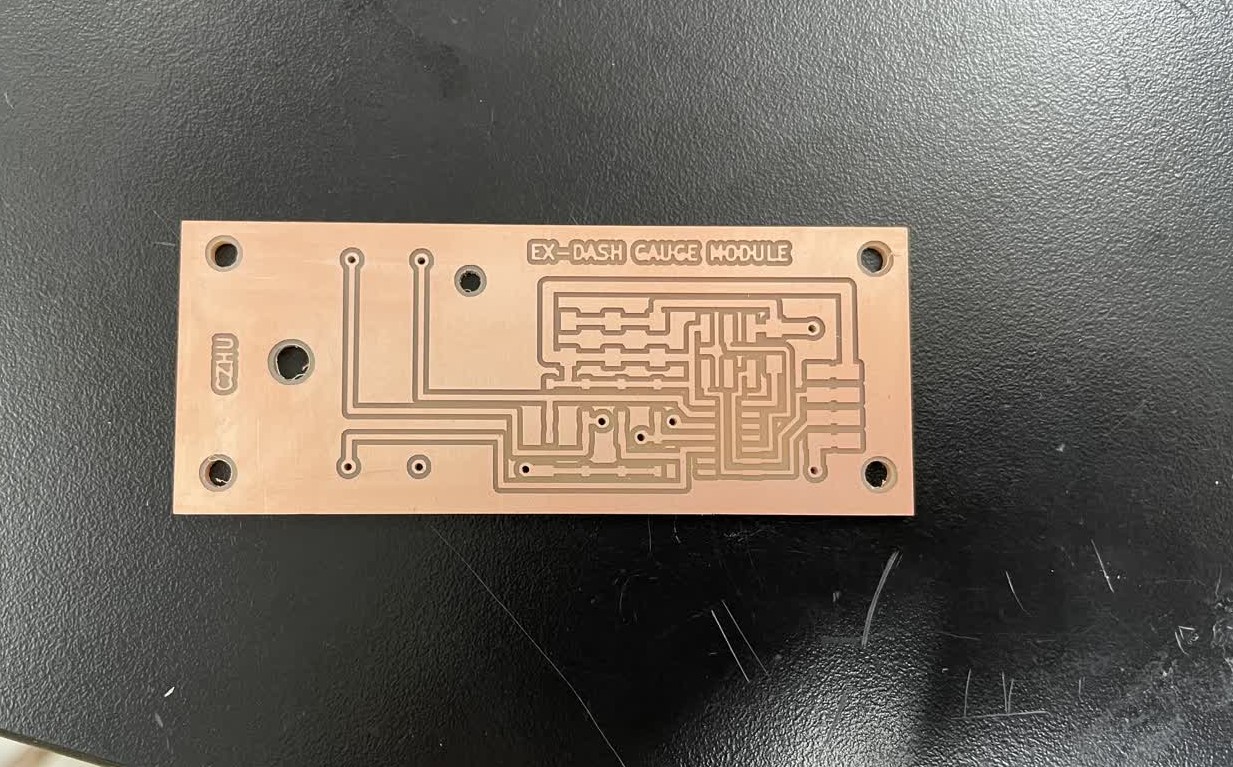
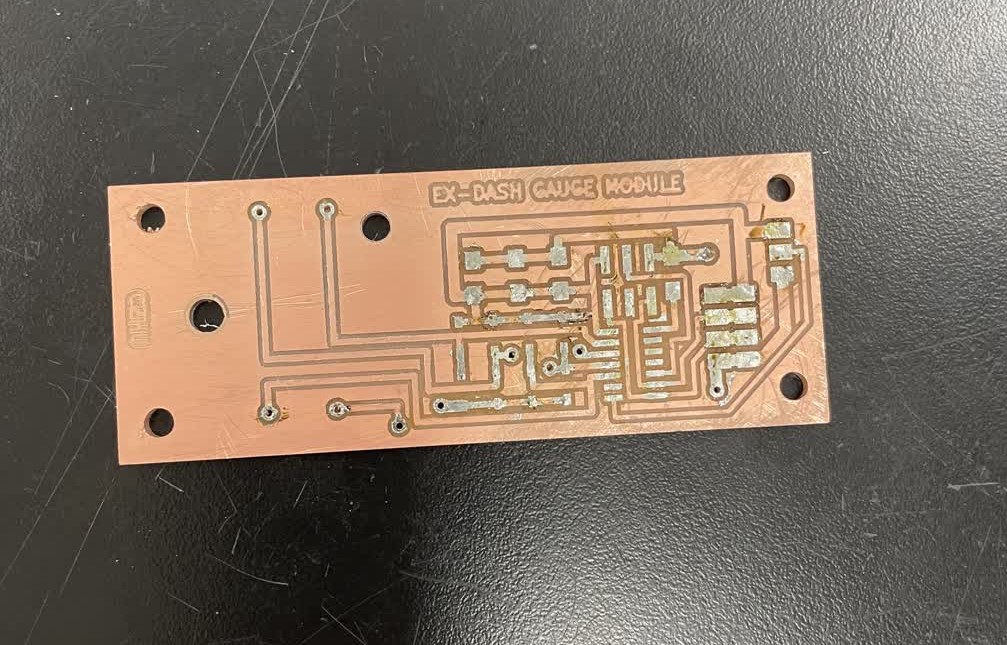
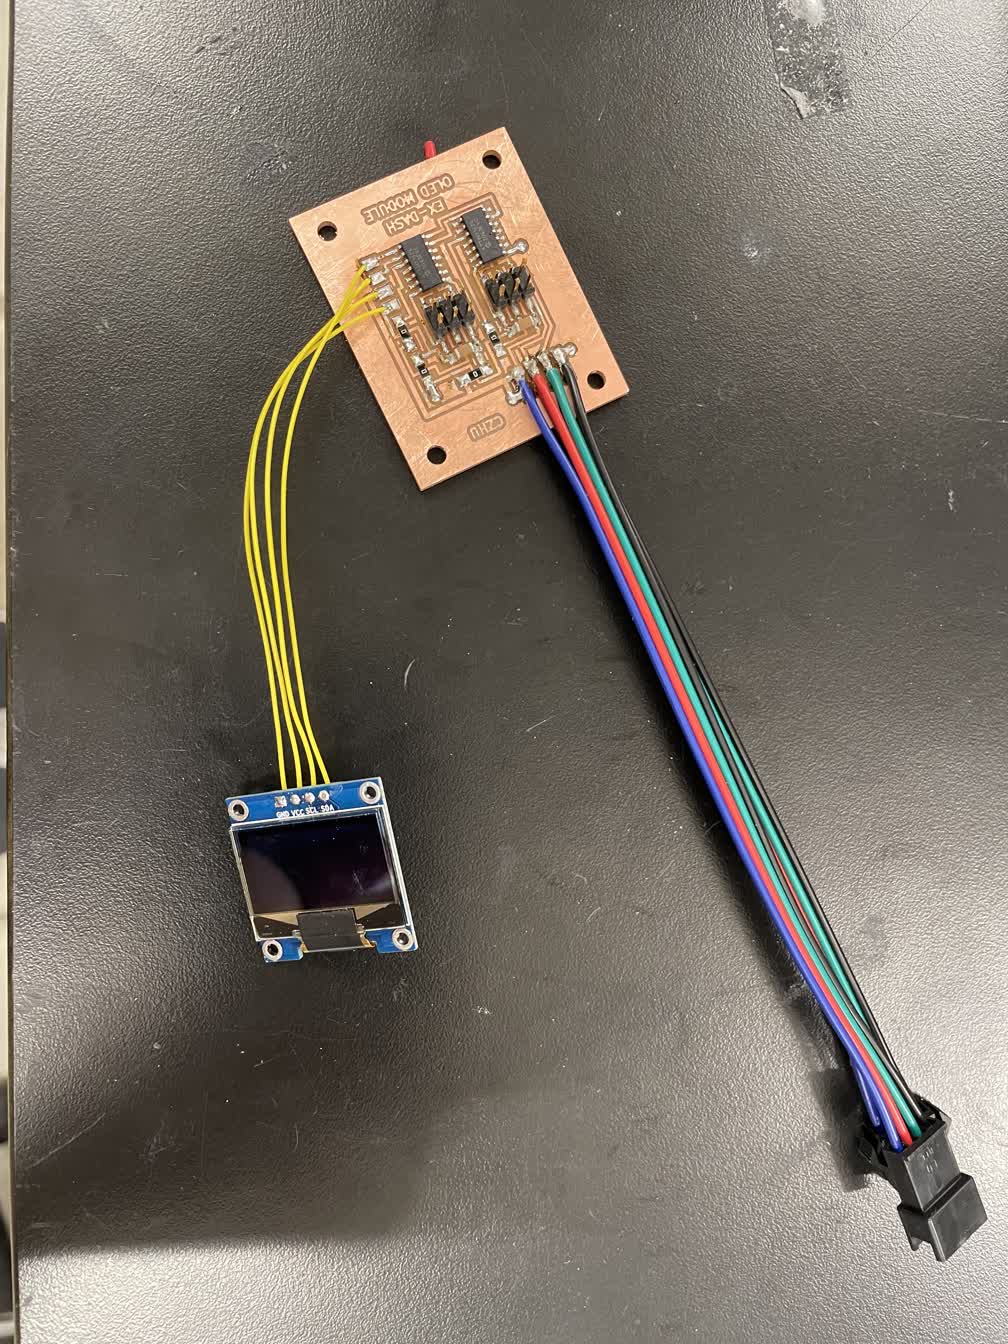
Above is the gauge module, and below is the OLED module:
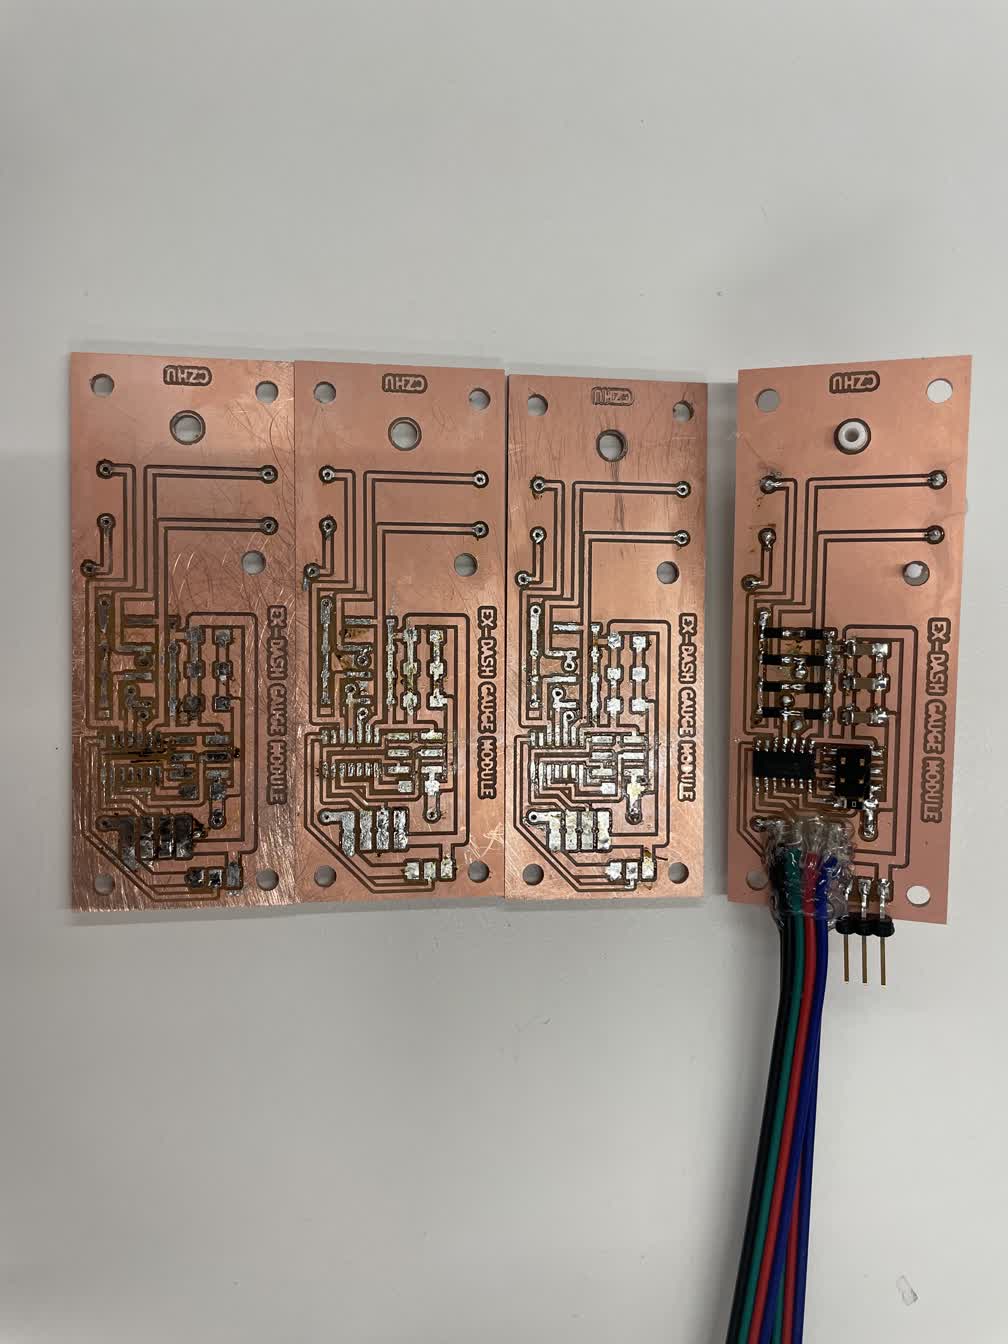
Now, some pictures of the boards being made:
[9] Preliminary Assembly
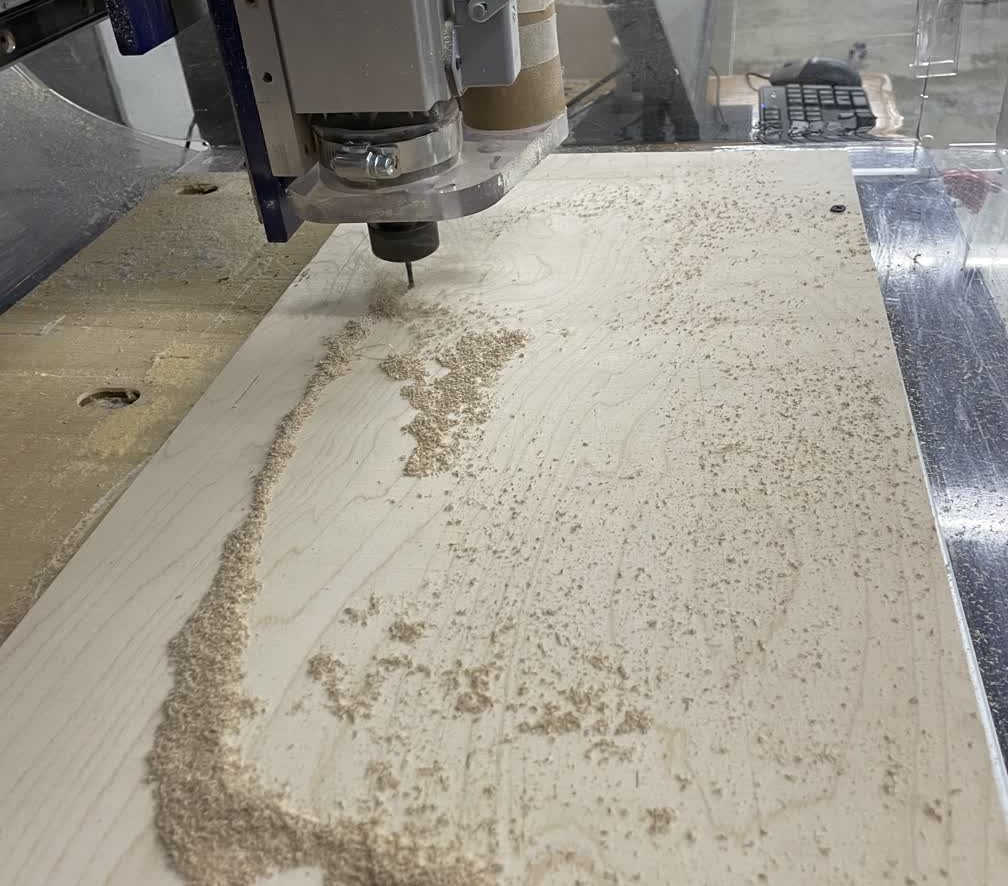
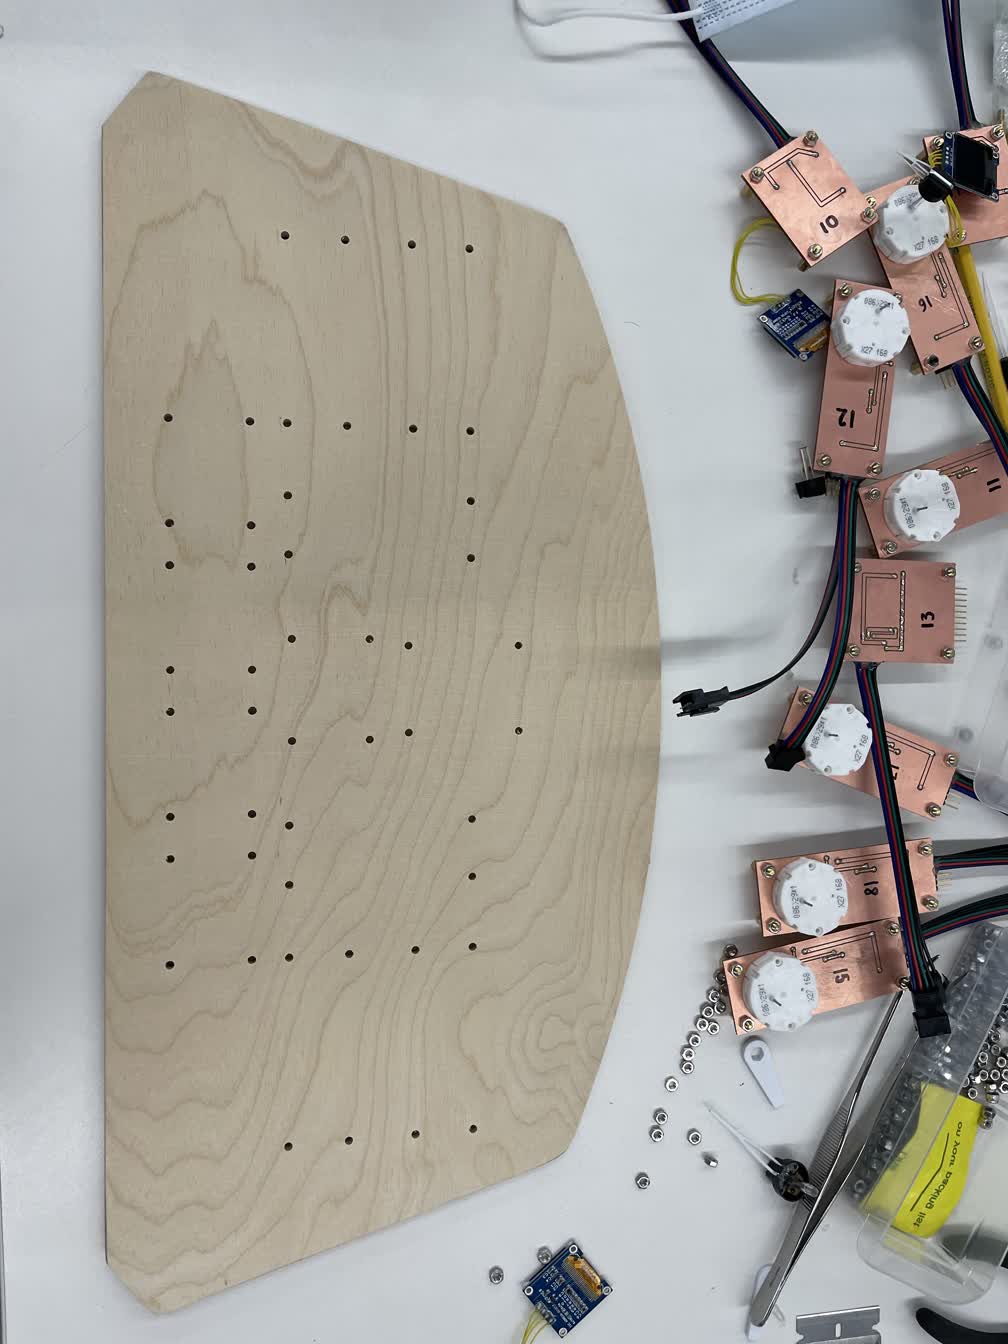
To combine everything, I CNC milled a back plate from plywood on which I could mount all of the modules:
Then I screwed the modules onto the back plate:
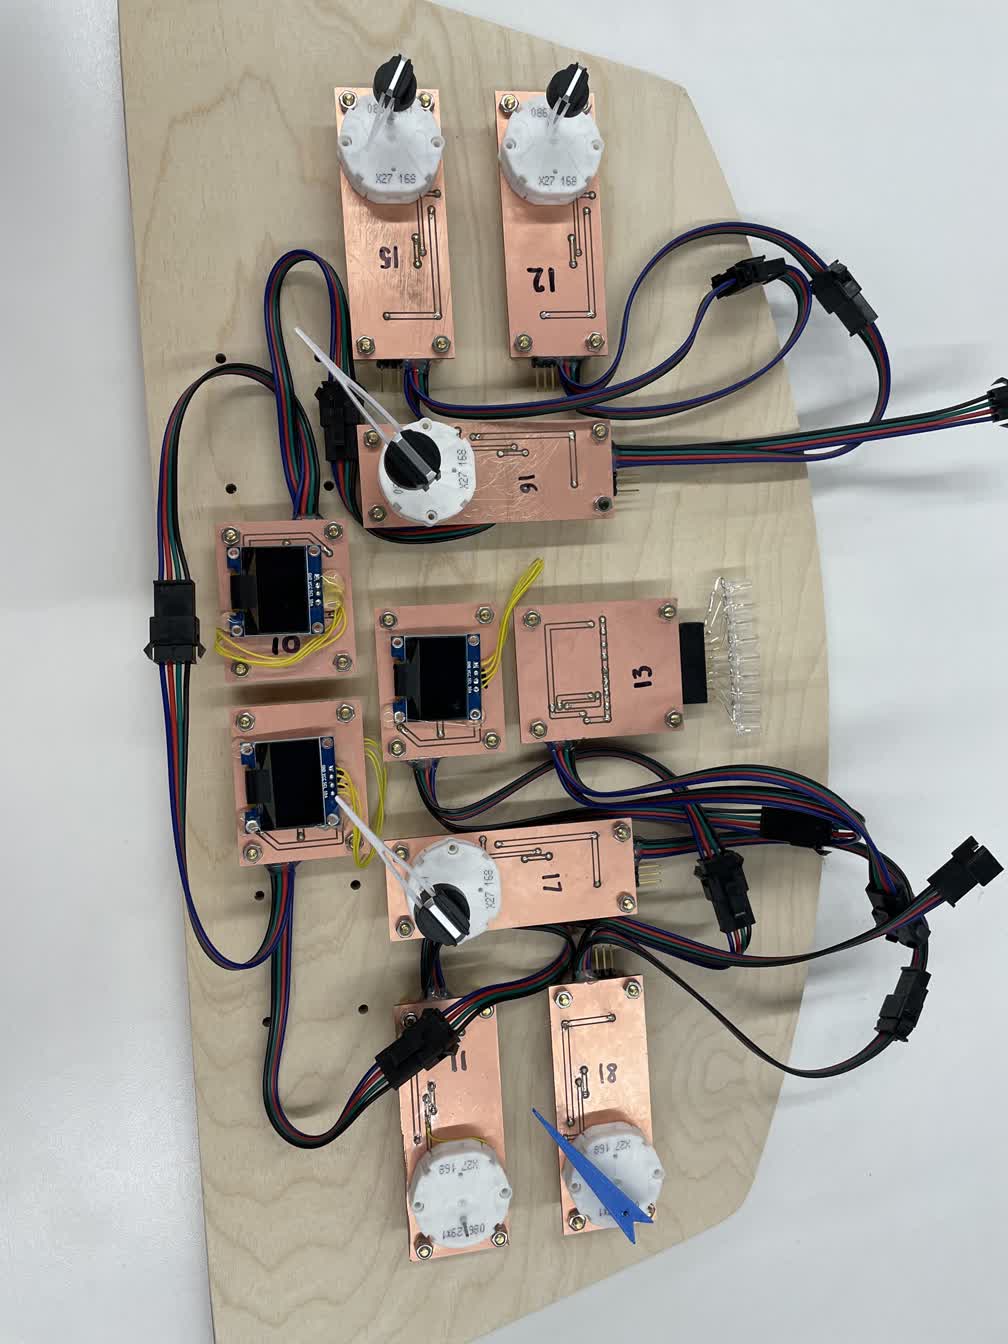
Here's a quick video of everything working on a simple test program where the master controller just sends each of the display modules a number:
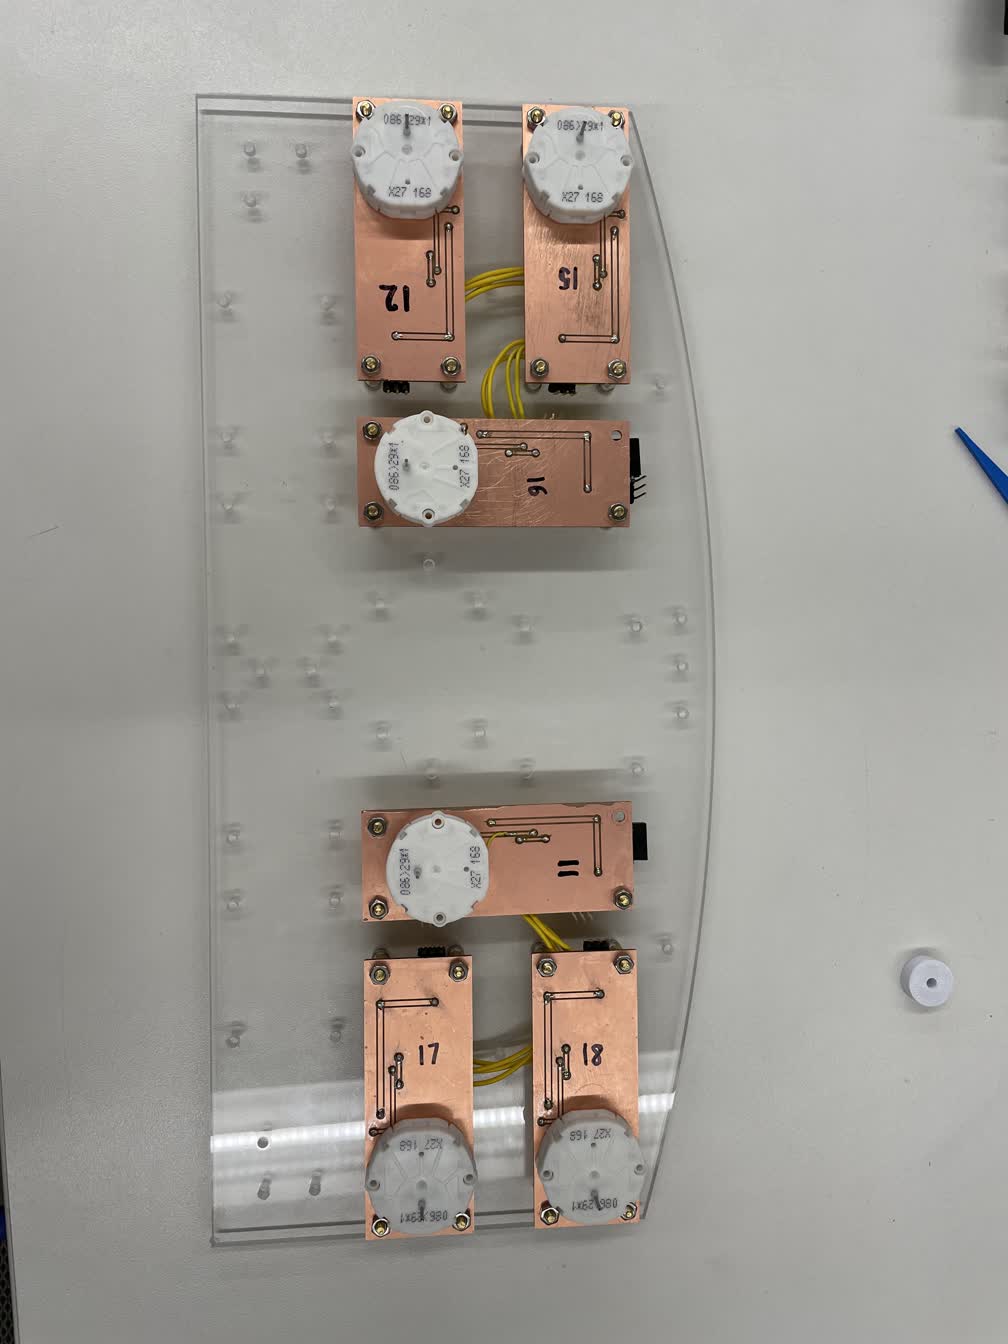
I decided that this didn't look particularly good, so I milled out a smaller back plate from clear acrylic and fitted everything:
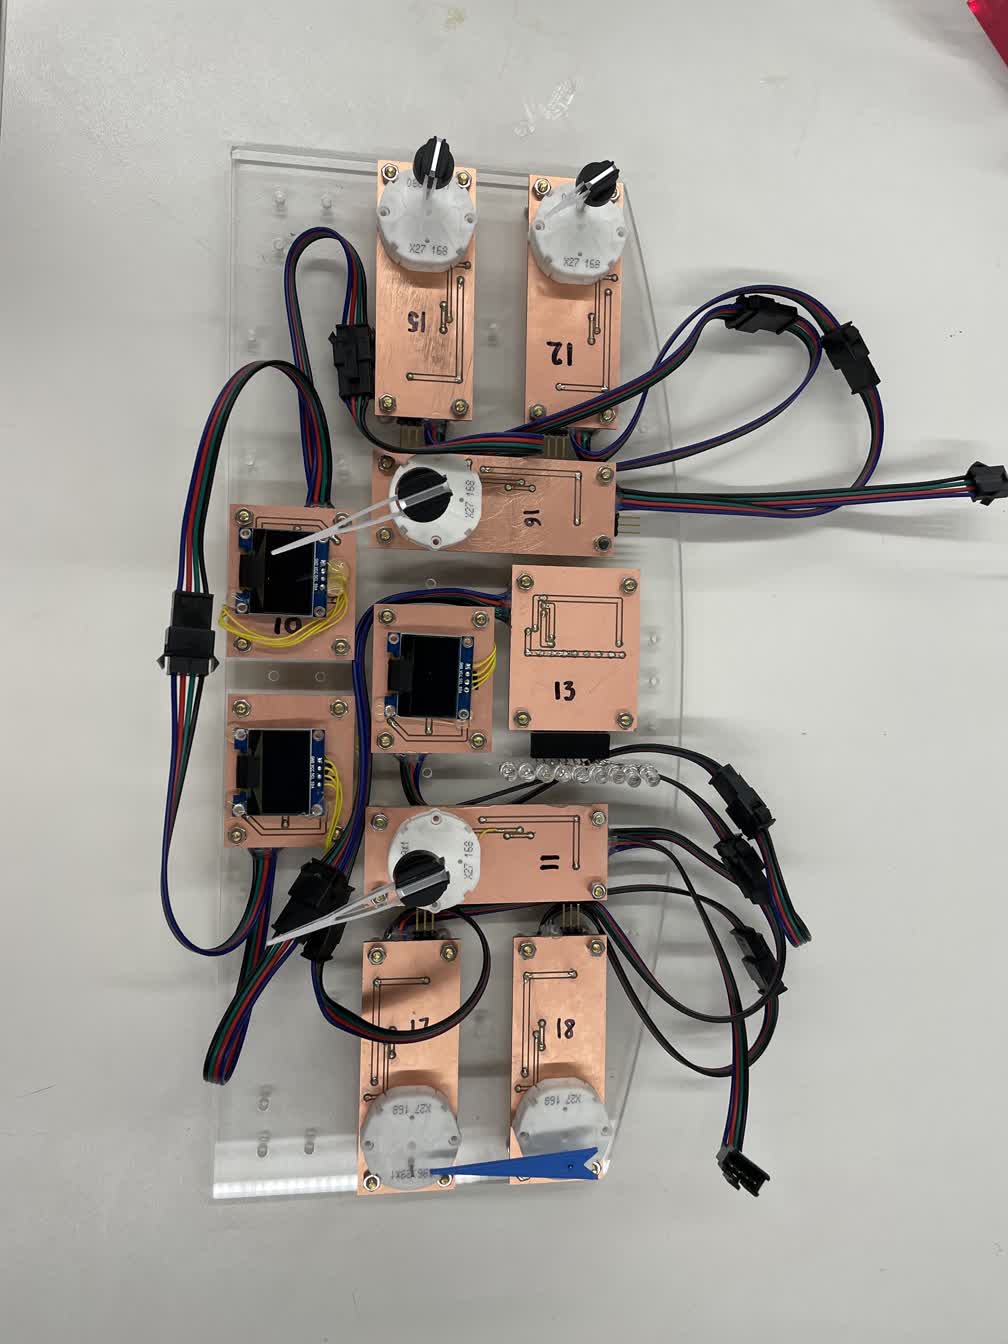
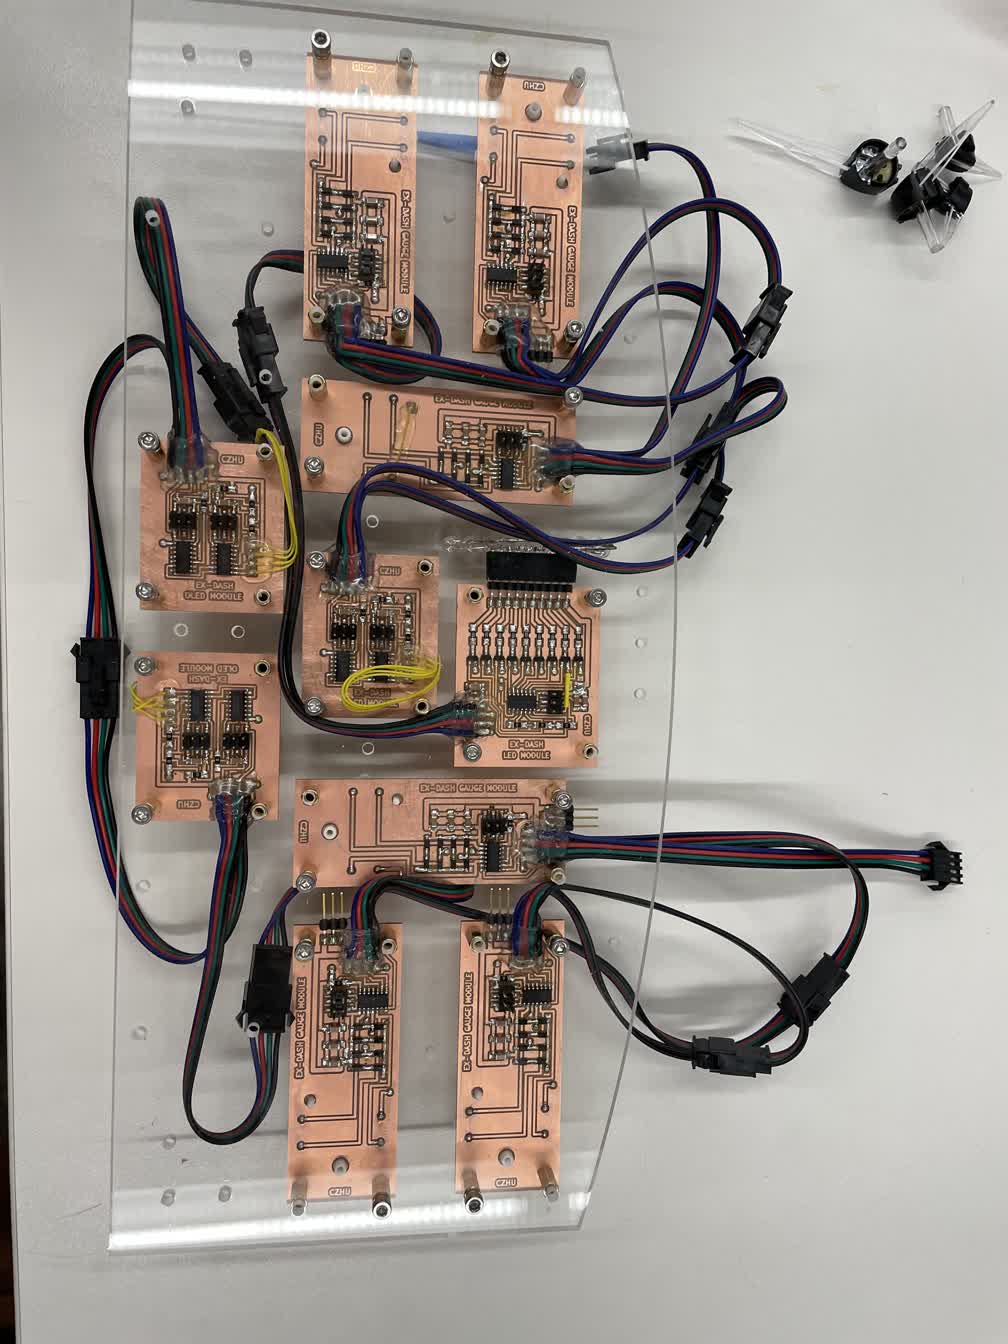
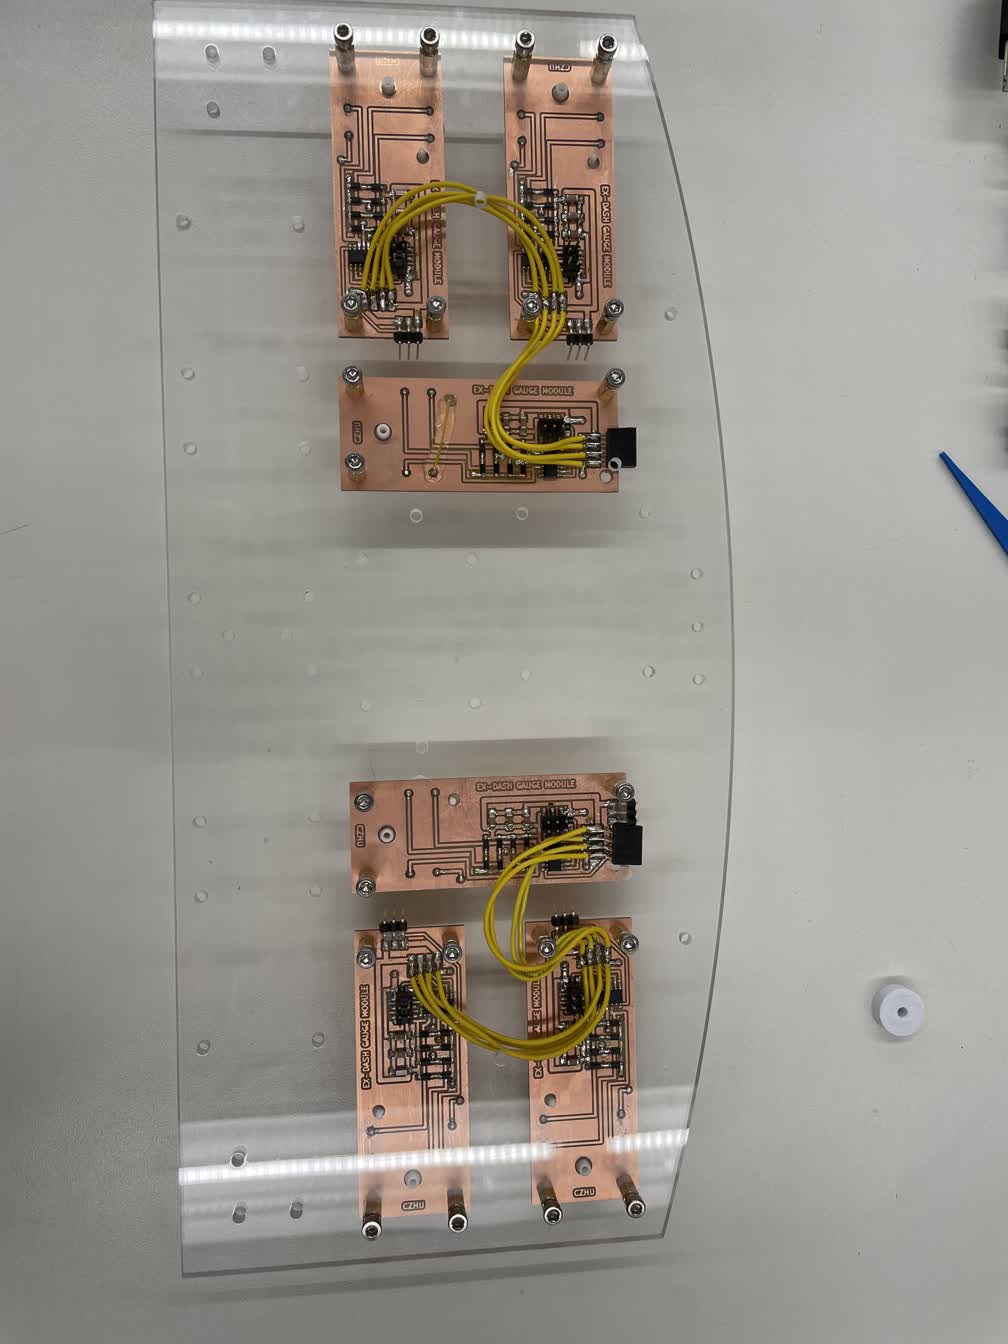
Having the cables strewn everywhere didn't look good either, so I desoldered all of the cables and instead connected all of the modules together by soldering on shorter wires:
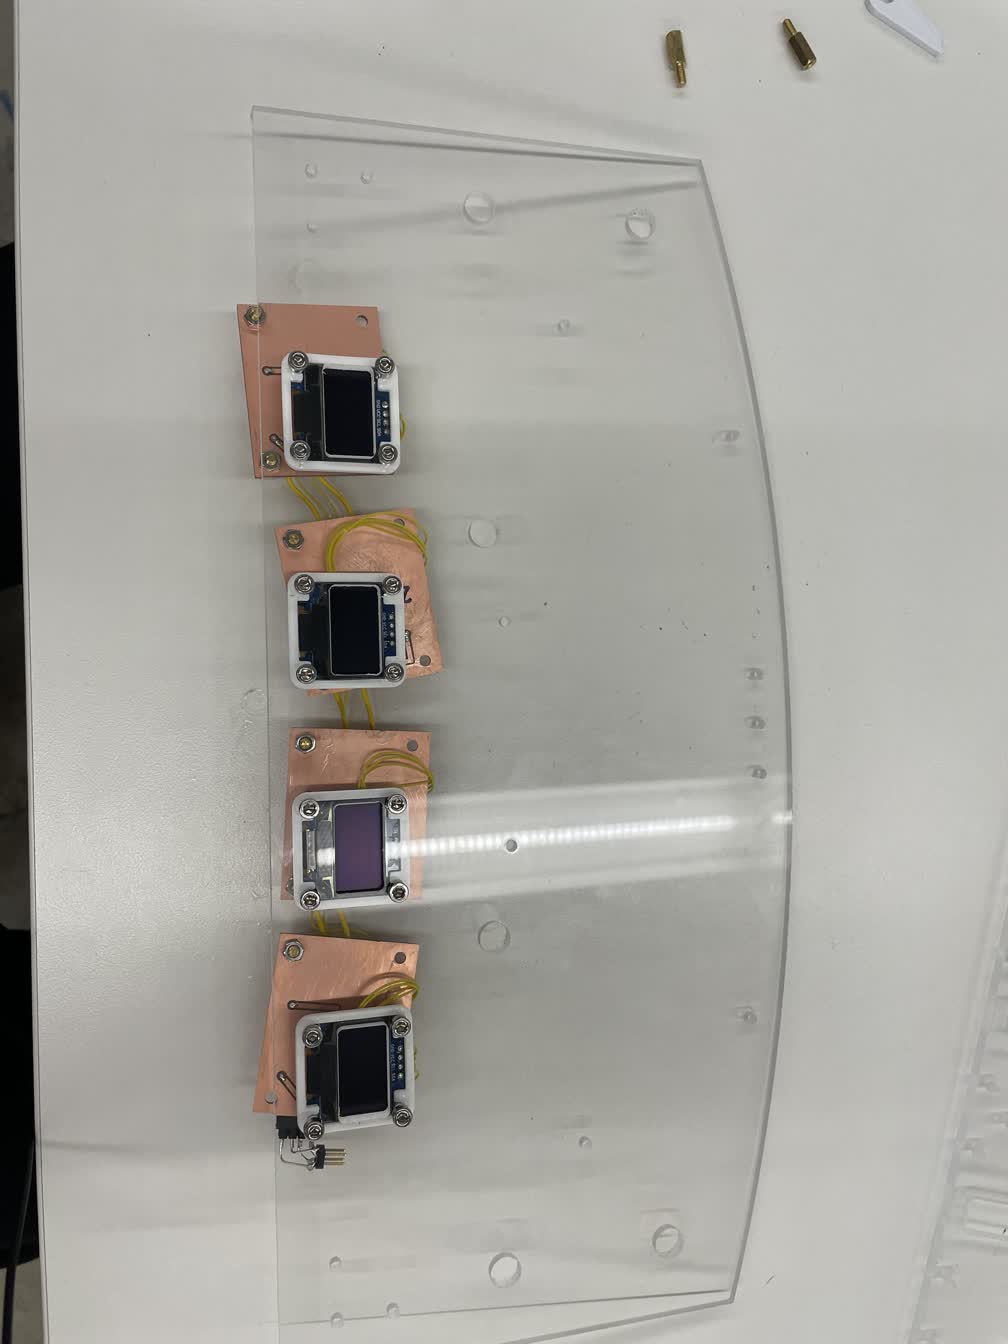
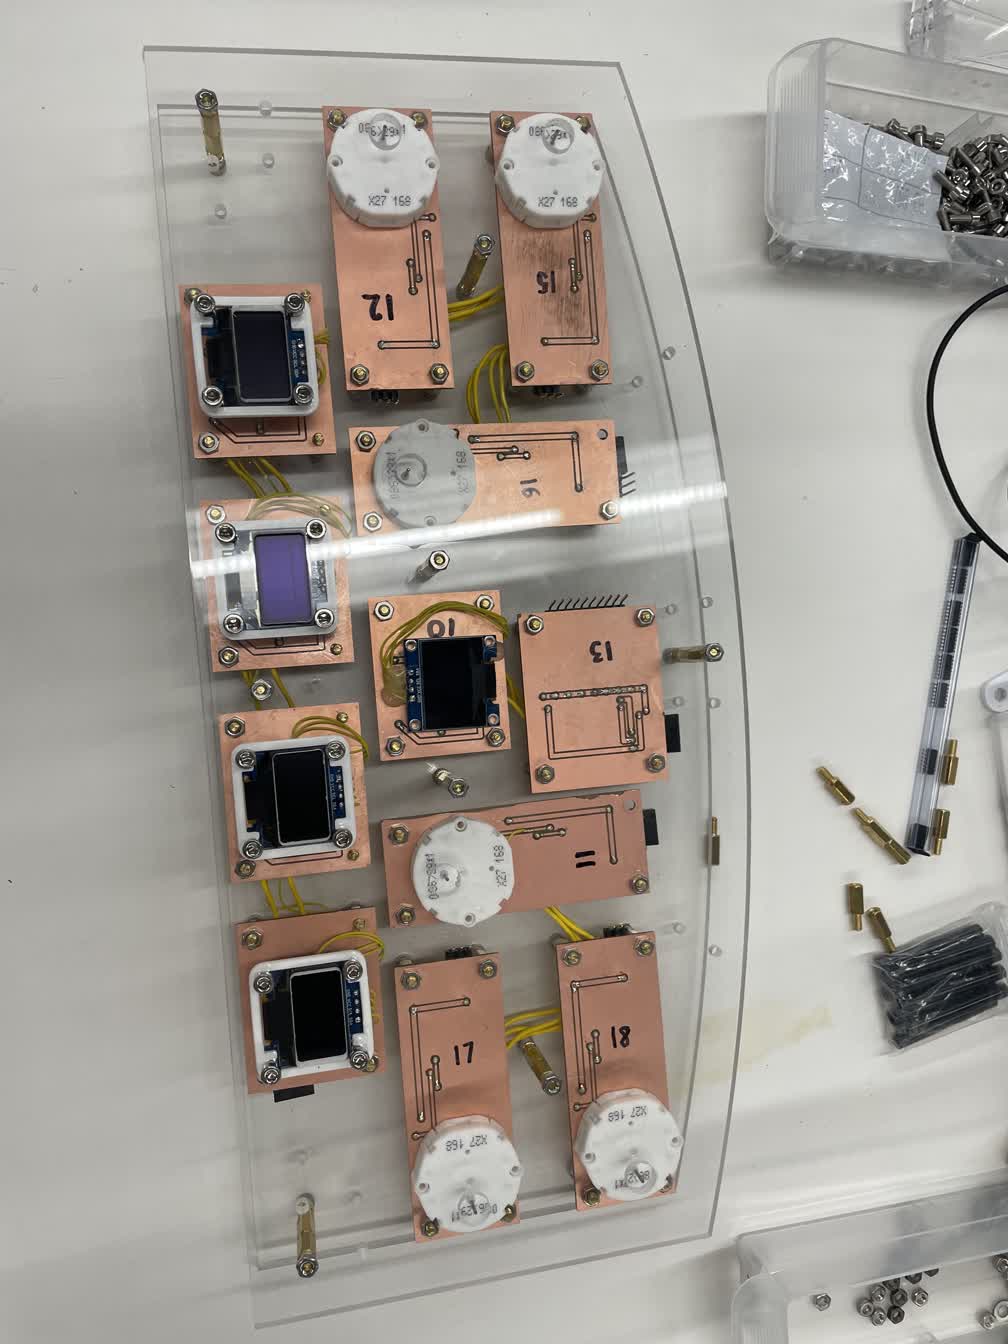
Most of the modules fitted onto the back plate and the OLED screens fitted onto the front plate:
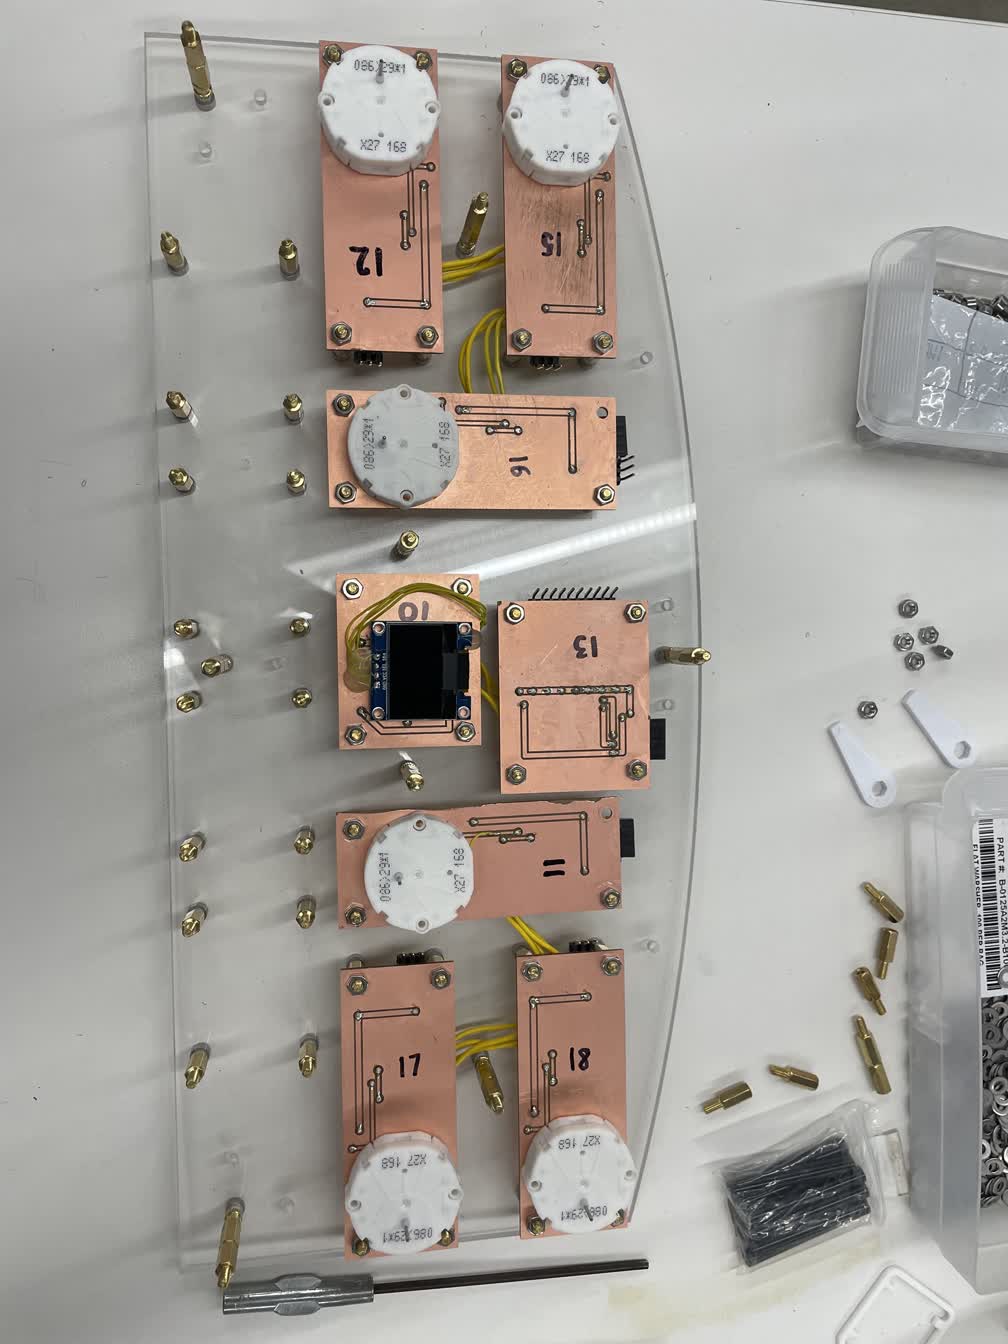
Nearing completion:
[10] Testing
With everything pretty much assembled and now looking much more presentable, I ran a basic test program which sweeps the gauges and displays random numbers on the OLED screens:
In order to select what data should be displayed on the OLED screens, I added a small 4-button D-pad which allows the user to select between different screens and what data is being displayed on a paticular selected screen. Here's a video showing a simple test program interfacing with the buttons and the middle OLED screen:
[11] Final Result
I 3D printed some gauge needles with red PLA and added them as the finishing touch:
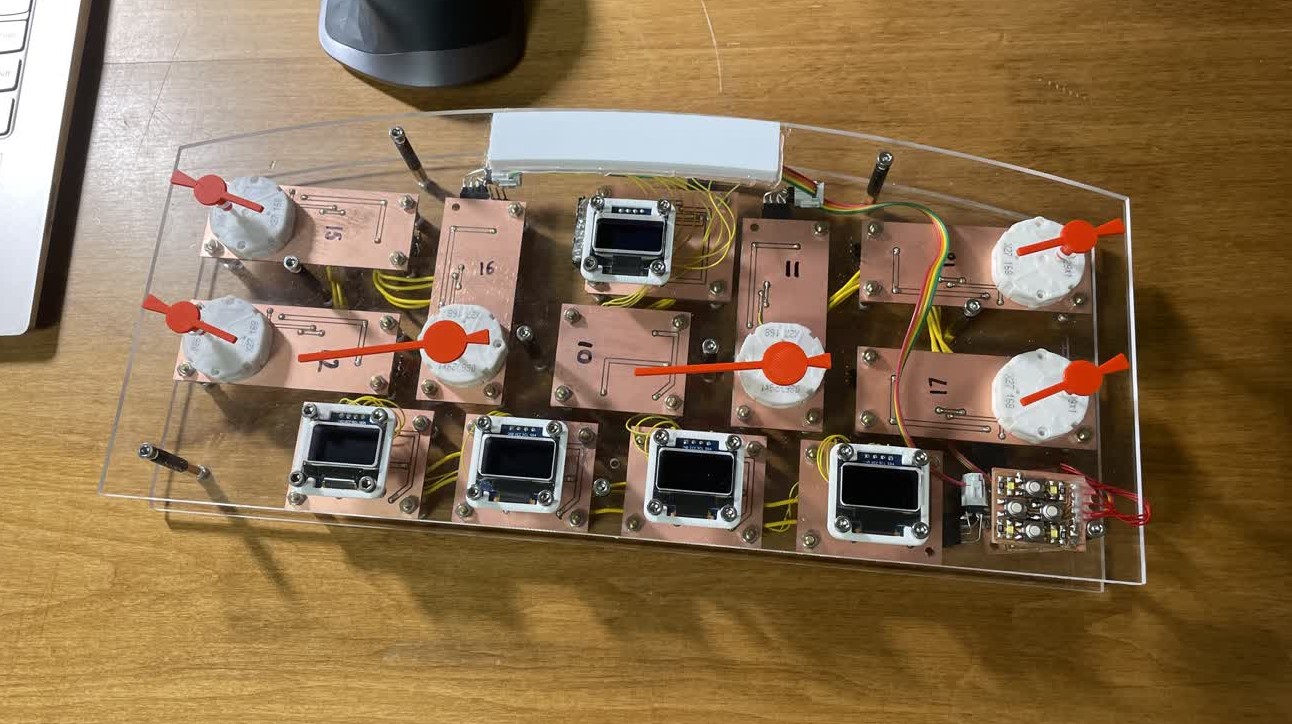
After integrating the button pad with all of the other modules and writing some more code to connect everything together, I finally finished the project. The button pad is used to select what data is being displayed on the bottom 4 screens: the left/right buttons choose which screen's data is being modified, and the up/down buttons choose the data to be displayed on the selected screen. Here is a video of everything working together:
[12] Project Questions & Video
The answers to the following questions are available in condensed form on my summary slide (linked at the top of this page), but here I elaborate some more:
What does it do? My final project is a modular dashboard for a car. It can be connected to an engine control unit via the OBD2 port (available on most modern cars) and display various engine and vehicle parameters.
Who's done what beforehand? As far as I can tell, nobody has designed a modular car dashboard before. Commerical 3rd party solutions usually consist of a single plug-and-play digital screen, and production dashboards have all the display interfaces integrated in a single module. Other people who have made dashboards also have not made them modular.
What did you design? I designed everything from the ground-up. PCBs for each of the modular display interfaces, CNC-milled mounting plates, 3D-printed needles and mounting brackets, and all of the software.
What materials and components were used? I used 4.5mm acrylic sheet, PLA filament, lots of M3 hardware, and various electronic components.
Where did they come from? Most of these materials were already available in the Harvard shop, but I needed to order the 6 small stepper motors for the analog gauges, a few extra OLED displays, and all of the standoffs -- everything I ordered came from Amazon.
How much did they cost? For the stuff I ordered: the stepper motors cost $20, the OLED displays cost $15, and the standoffs cost $20. Factoring in the hardware and electronics that I used from the lab, I estimate a total cost of around $100.
What parts and systems were made? I made every single part of this project down to the component level: the PCBs, mounting plates, 3D printed parts, and other miscellaneous things.
What processes were used? PCB/CNC milling, 3D printing.
What questions were answered? Can I design a modular plug-and-play electronics system? After completing this project, the answer is most definitely yes!
What worked? What didn't? Everything I designed worked, the only thing I have left to do is to integrate the system with a car. However, because I didn't have access to a car during the end of the semester, I wasn't able to complete this part, so technically this didn't work.
How was it evaluated? I evaluated my project based on how well it could display easily-readable data in a nice-looking way. From the video above, I would say the project works very well.
What are the implications? The modular display interface system I designed allows anyone to create a customizable display for any sort of data, not just displaying engine/vehicle data for a car dashboard.