
This week I got to work building the data interface for my “thought ball” final project, which will record the path of an accelerometer and bluetooth-enabled ball as a user tosses it around.
I have a background in data visualization and d3, so to get started this week I built some d3 line charts using faked sin data. D3 code sprawls so it’s all linked at the end of the file.
There was one tricky feature I included. My interface will need to accept an arbitrary amount of data – you should be able to record for a couple seconds or for an hour. This does not work well for a single chart: The two traditional ways to handle it are to just keep extending your x-axis forever or to keep moving the “window” of the chart, like the Arduino serial plotter does. One choice scrunches all your data up so it’s not legible, the other deletes most of the data.
I tried for a third option: Chart wrapping. After a hard-coded number of data points per chart, the page simply starts another chart, and auto-scrolls so it’s in view.
This has a big performance advantage. The lazy way of animating a d3 chart is to simply delete it and redraw it as new data comes in. But if you try to do that with thousands of data points, the page drags. In my version, only the most recent chart is redrawing, so the page is always crisp even if you’ve been recording forever.
The downside is that it will take up a ton of vertical space, people hate auto-scrolling, and the charts won’t share a common y-axis in the end. That last one is solvable though.
For the next step, I cleaned up the styles of the chart a bit and connected it to real data. I did this by using a beta Chrome serial API. Exactly the sort of thing Neil told us to avoid broke his heart because it was unlikely to be supported going forward but oh well. I plugged in my three-axis accelerometer from Week 10 and passed my “total movement” variable through serial.
Here’s the key part of the code to read it in. The API is opt-in: Users have to click on something to get it started, like Autoplay video with audio.
d3.select('button.connect').on('click', async () => {
	const port = await navigator.serial.requestPort();
	await port.open({ baudRate: 115200 });

	const textDecoder = new TextDecoderStream();
	const readableStreamClosed = port.readable.pipeTo(textDecoder.writable);
	const reader = textDecoder.readable.getReader();

	while (true) {
	  const { value } = await reader.read();
	  let dataPoint = parseFloat(value);

	  if(!isNaN(dataPoint)){
		  allData.push(dataPoint);
		  // this is a function that the d3 stuff
		  drawChart(allData);
	  }
	}
});
And here’s the whole setup in action.
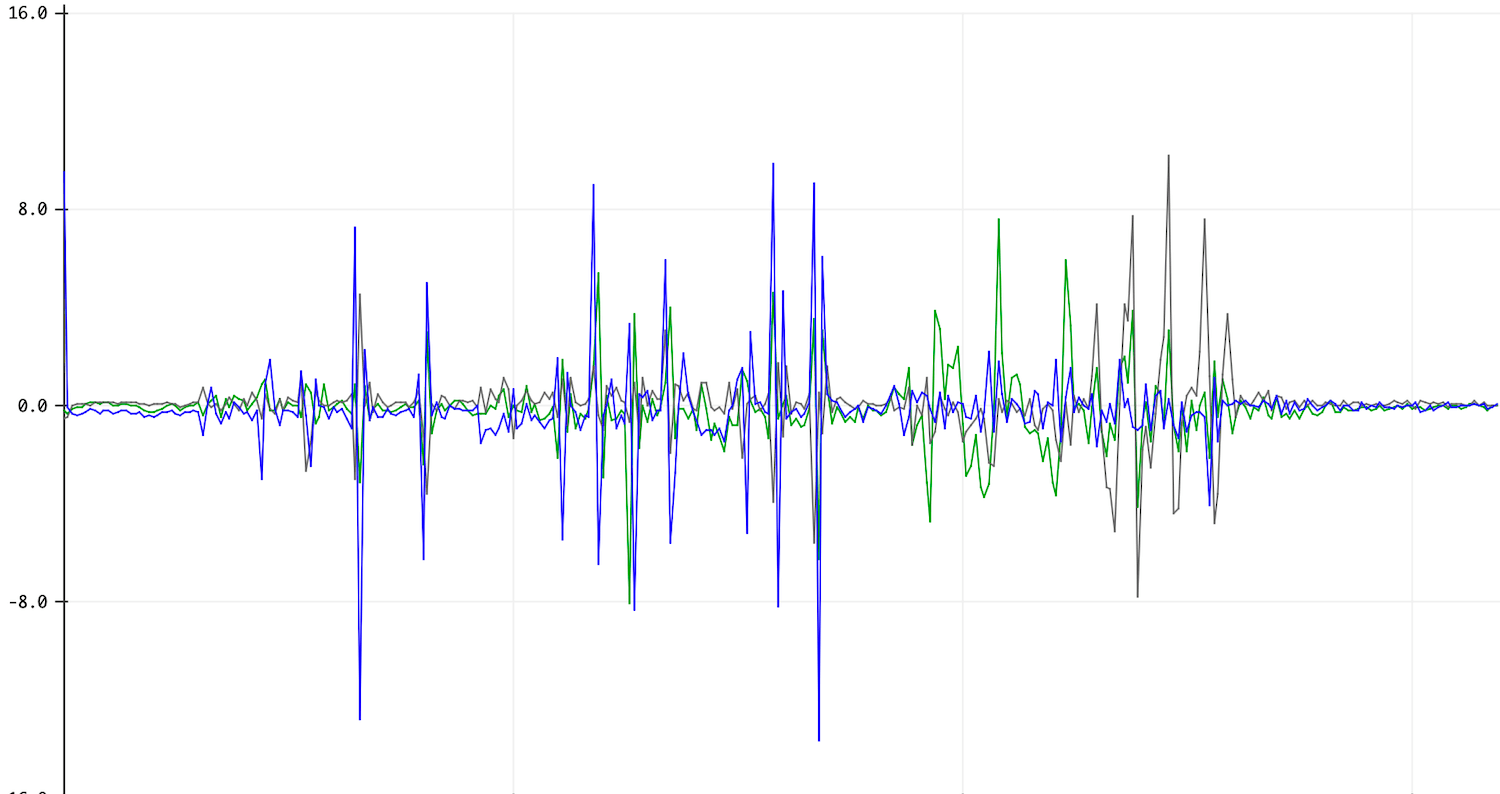
One small chart detail. Anyone who's spent time with the serial plotter knows that this sensor data is actually really noisy. I smoothed it out using d3.curveMonotoneX, which has a nice quality of making natural-looking lines that ensure that the visualized mins and maxes are real data points, not interpolated lines.
I had this very simple interface wrapped up by Sunday, which meant that it was time to tie up some loose ends.
Back in Week 10, I managed to get a three-axis accelerometer working, and I got my hands on a nine-axis accelerometer but didn’t have time to do much with it. This is what I’m going to need for my final project.
I’d soldered header pins on a couple weeks back, and was able to get the BNO055 “read all data” Arduino example up and running.
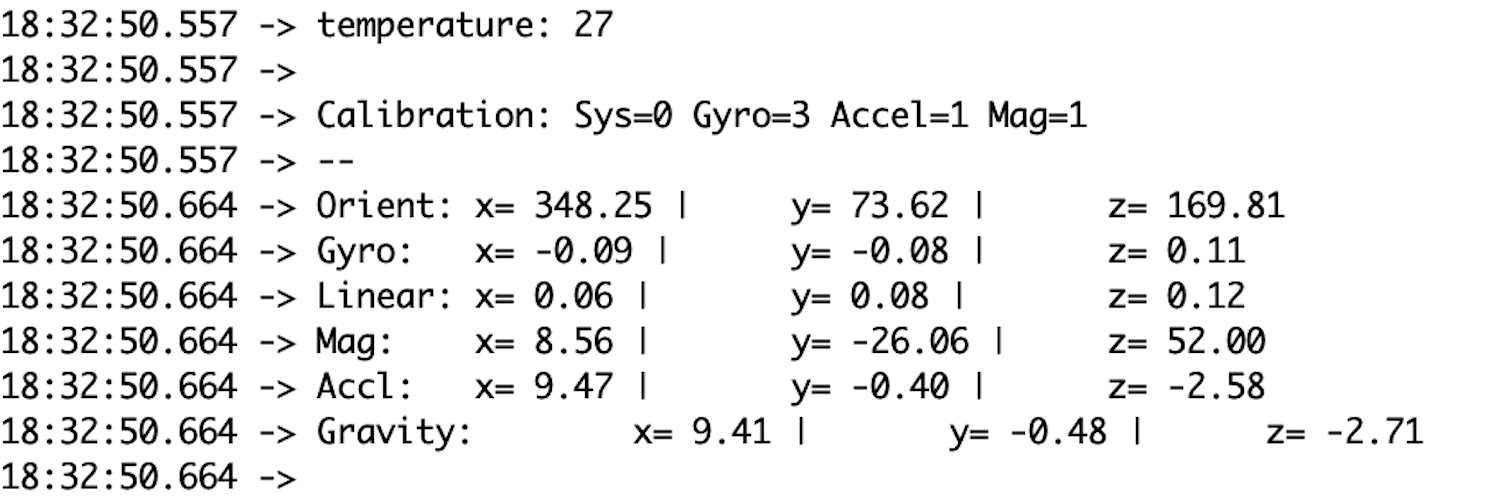
But I ran into a bit of a brick wall trying to figure out exactly what values I’m going to want to use. I can get linear acceleration on all three axes.
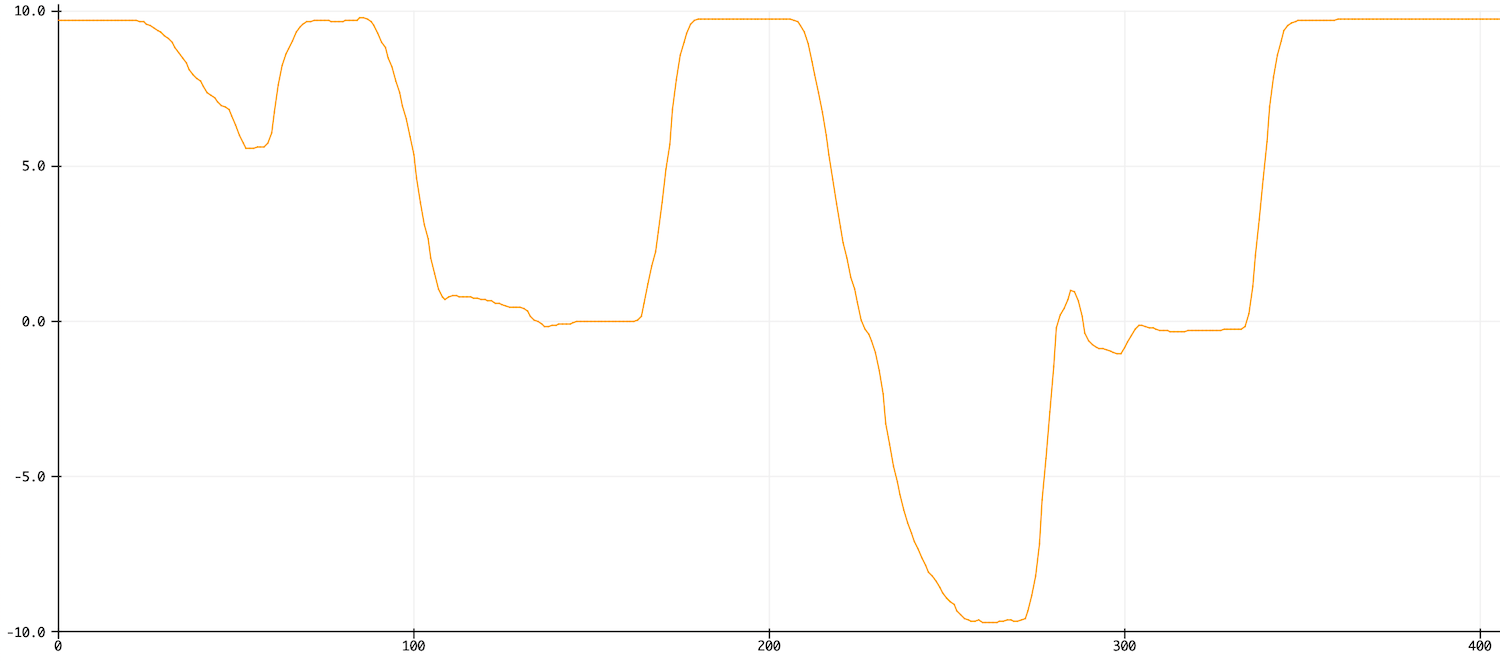
And I can get a gravity reading on these three axes as well. Here’s Z. when my device is flat it reads 9.8 (gravity pulling down), when I rotate it 90° it reads 0 and when it’s upside down it’s -9.8. pretty cool.
From these numbers, I think I can calculate acceleration perpendicular to earth at all times, even as my device rotates. But I don’t know how to do that math. I need someone who is better at physics than me. Doria has offered to help!
Here’s why I want that number. I know I’m not going to be able to get an accurate “z position” for my ball. Accelerometers can’t do that. But my hope is that when a ball is thrown into the air, it will have an intense acceleration that signals a “start.” And then the ball will deccelerate until it reaches its peak. If I know the timing of the start and the peak, I can fudge drawing a parabola.
Anyways, I temporarily give up on this one. Moving on.
During Week 11 I was, after much hardware difficulty, able to get an RN4871 bluetooth chip working. I could pass a message from my phone to the RN4871, and see it pop up in my serial monitor. It was neat!
But that was really just step one for what I wanted to accomplish with Bluetooth. I need a longer process that flows in the other direction: Accelerometer data → microcontroller → RN4871 → browser → visualization.
To get started, I had to reconfigure my RN4871 so it could write to a server instead of just reading. This meant I had to create a custom GATT service – I found these two sets of MicroChip datasheets super helpful for figuring this out. With my RN4871 plugged into my computer, here are the steps I ran to create a service that could be read, with a maximum message size of 20 bytes.
// no line ending, enter command mode
	$$$
// CR from now on, echo commands
	+
// add custom service with a BS UUID
	PS,010203040506070809000A0B0C0D0E0F
// add readable characterstic with another BS UUID
// 02 = readable property
// 14 = max byte size in hex (=20 in base)
	PC,11223344556677889900AABBCCDDEEFF,02,14
// reboot for the changes to take effect
	R,1
// enter command mode again, no line ending
	$$$
// echo again, restore carriage return
	+
// list services, which lets me know the characteristic "location" is 0072
	LS
// write the hex number 18 (24 in decimal) to 0072 to test
	SHW,0072,18
One small warning for those trying the same thing. One of the docs recommends that you start by running “SF,1” to restore the chip to factory settings. Don’t do that, it wipes the MAC address (called BTA in this case). I had to write a new one, using the code in this thread. A more useful command that I used a bunch was “PZ,” which just resets your custom services instead of the whole device.
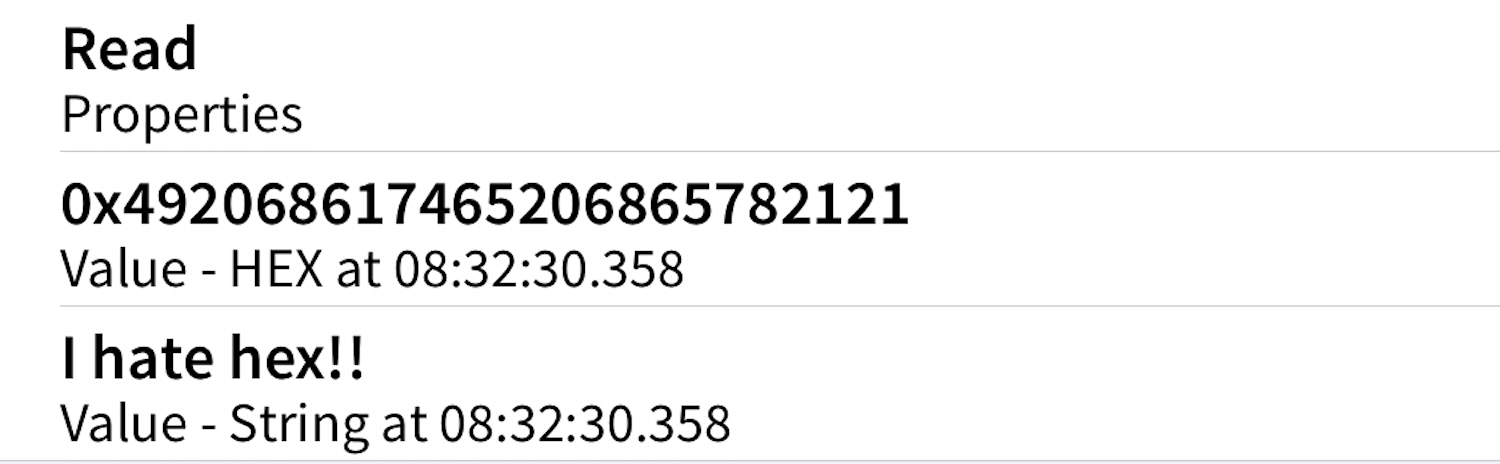
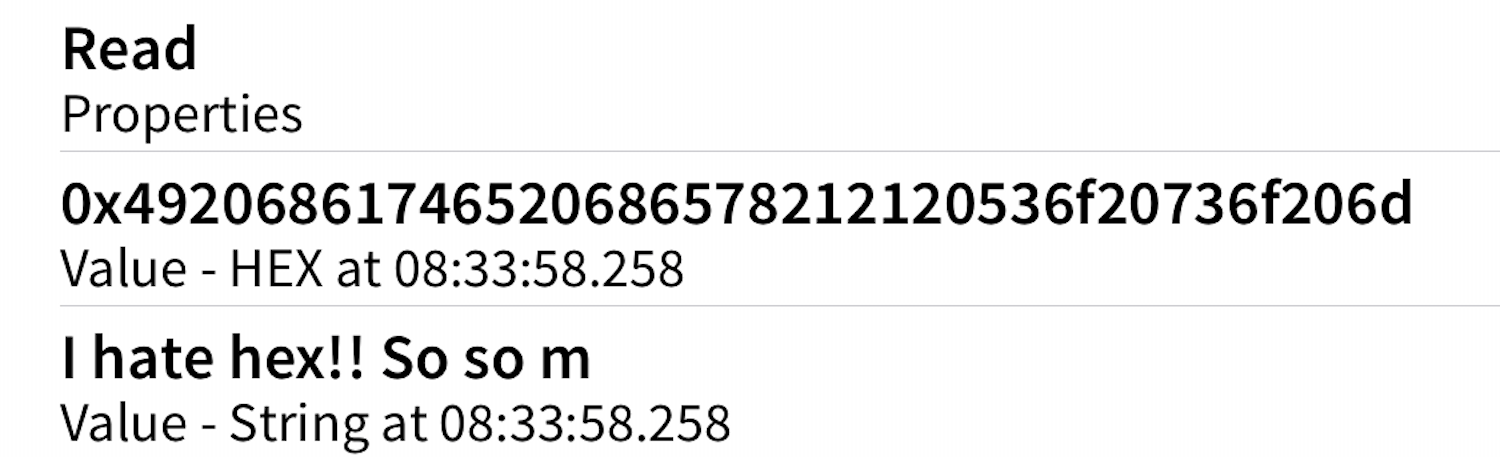
I’ll admit that it took me a long time to wrap my head around hexadecimal, which is how the RN4871 sends all of its data. I used a hex to decimal converter to mess around with numbers and a ASCII to hex converter to write strings. Here’s me writing a fun little string.
SHW,0072,492068617465206865782121
And here’s the BLE Scanner app on my phone translating it!
Here’s a longer message.
SHW,0072,49206861746520686578212120536f20736f206d756368
As expected, only the first 20 bytes actually get read.
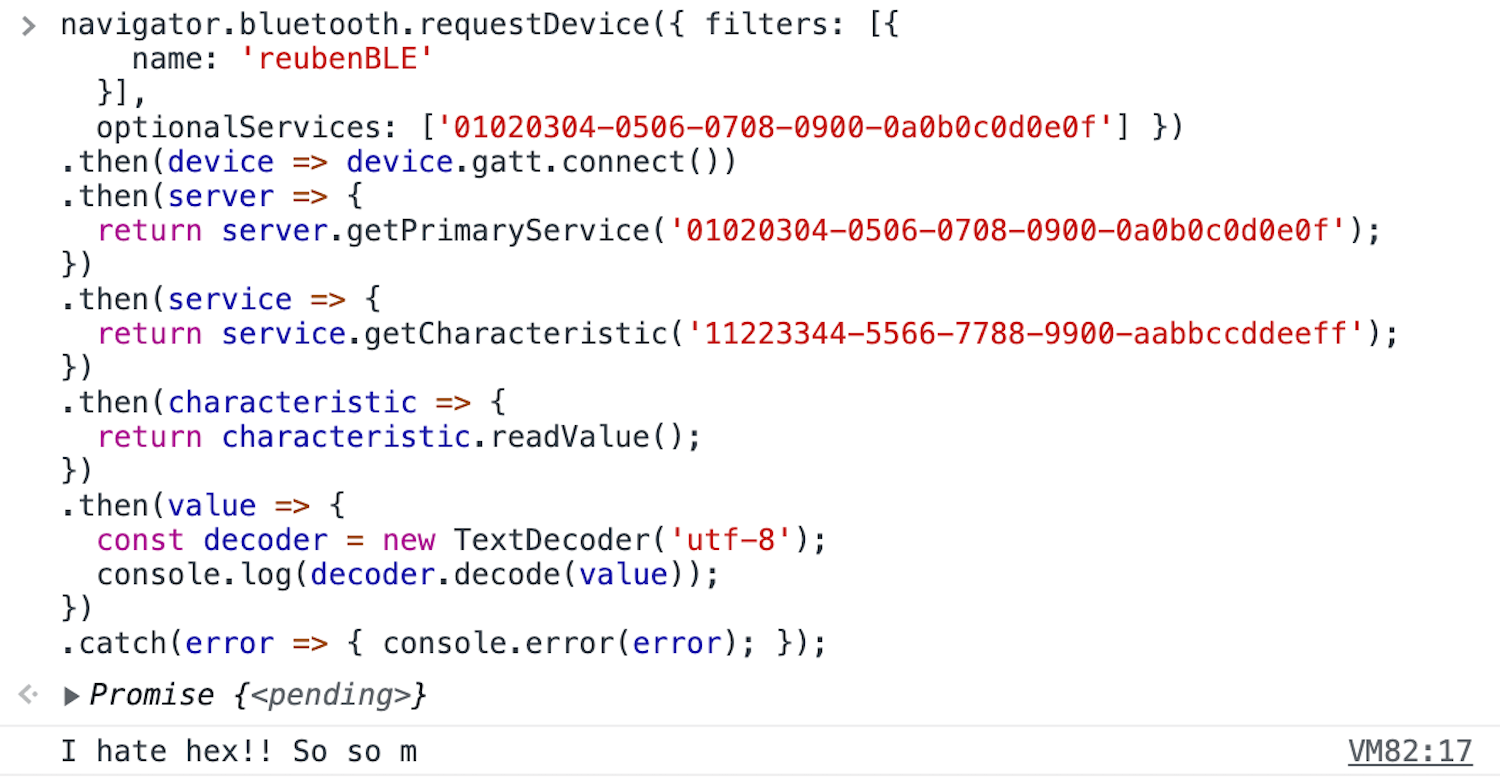
So now it was time to get it working in the browser, using the same sort of dangerous beta Chrome feature that I used to get serial working.
The initial setup of this wasn’t so bad, using code from this web.dev tutorial. You tell it what service/characteristic to look for, and then read the value. I pasted this into my browser console and got a response.
Getting it running on my interface page was more complicated. Like serial, you need to have the user “opt in” with a button. That was pretty easy. The bigger problem is that the JS promise structure of that request would only return a single value – you can’t really shove a setInterval() or while() loop in there to keep checking, and you don’t want to reconnect with the device over and over.
The solution was to take advantage of the “notify” feature in BLE, which lets you add an event listener to pull the value whenever it changes. These notifications also need to be opted into. Here’s the key code:
let characteristicBLE;
d3.select('button.connect').on('click', () => {

	// same setup as before, connecting to device
	.then(characteristic => {
		characteristicBLE = characteristic;
		characteristic
			.addEventListener('characteristicvaluechanged', dataChanged);
		return characteristic.readValue();
	});

	function dataChanged(event){
		let value = event.target.value.getUint8(0);
		if(!isNaN(value)){
			allData.push(value);
		}
	}

	let notifications = false;
	let notificationButton = d3.select('button.notify');

	notificationButton.on('click', () => {
		characteristicBLE.startNotifications();
		setInterval(() => {
				allData.push(allData[allData.length-1]);
				// all the d3 stuff happens in this function
				drawChart(allData);
		}, 100);
	});
});
(To make my data feel like it’s updating continuously, I’m just repeating the last value in my data array until I get a new value.)
However, this still didn’t work, because the custom GATT service I created only had the “read” feature, not the “notify” feature. So I had to wipe my services on my RN4871 and create a new one with this characteristic.
PC,11223344556677889900AABBCCDDEEFF,1A,14
But once I did all that, here’s my Bluetooth-enabled sensor visualization in action:
Woohoo! This interface page lives here, although it doesn’t do anything unless it pairs with my specific RN487.
Of course this is still just me passing fake data. The final step is to send real sensor data to the RN4871 through my microcontroller.
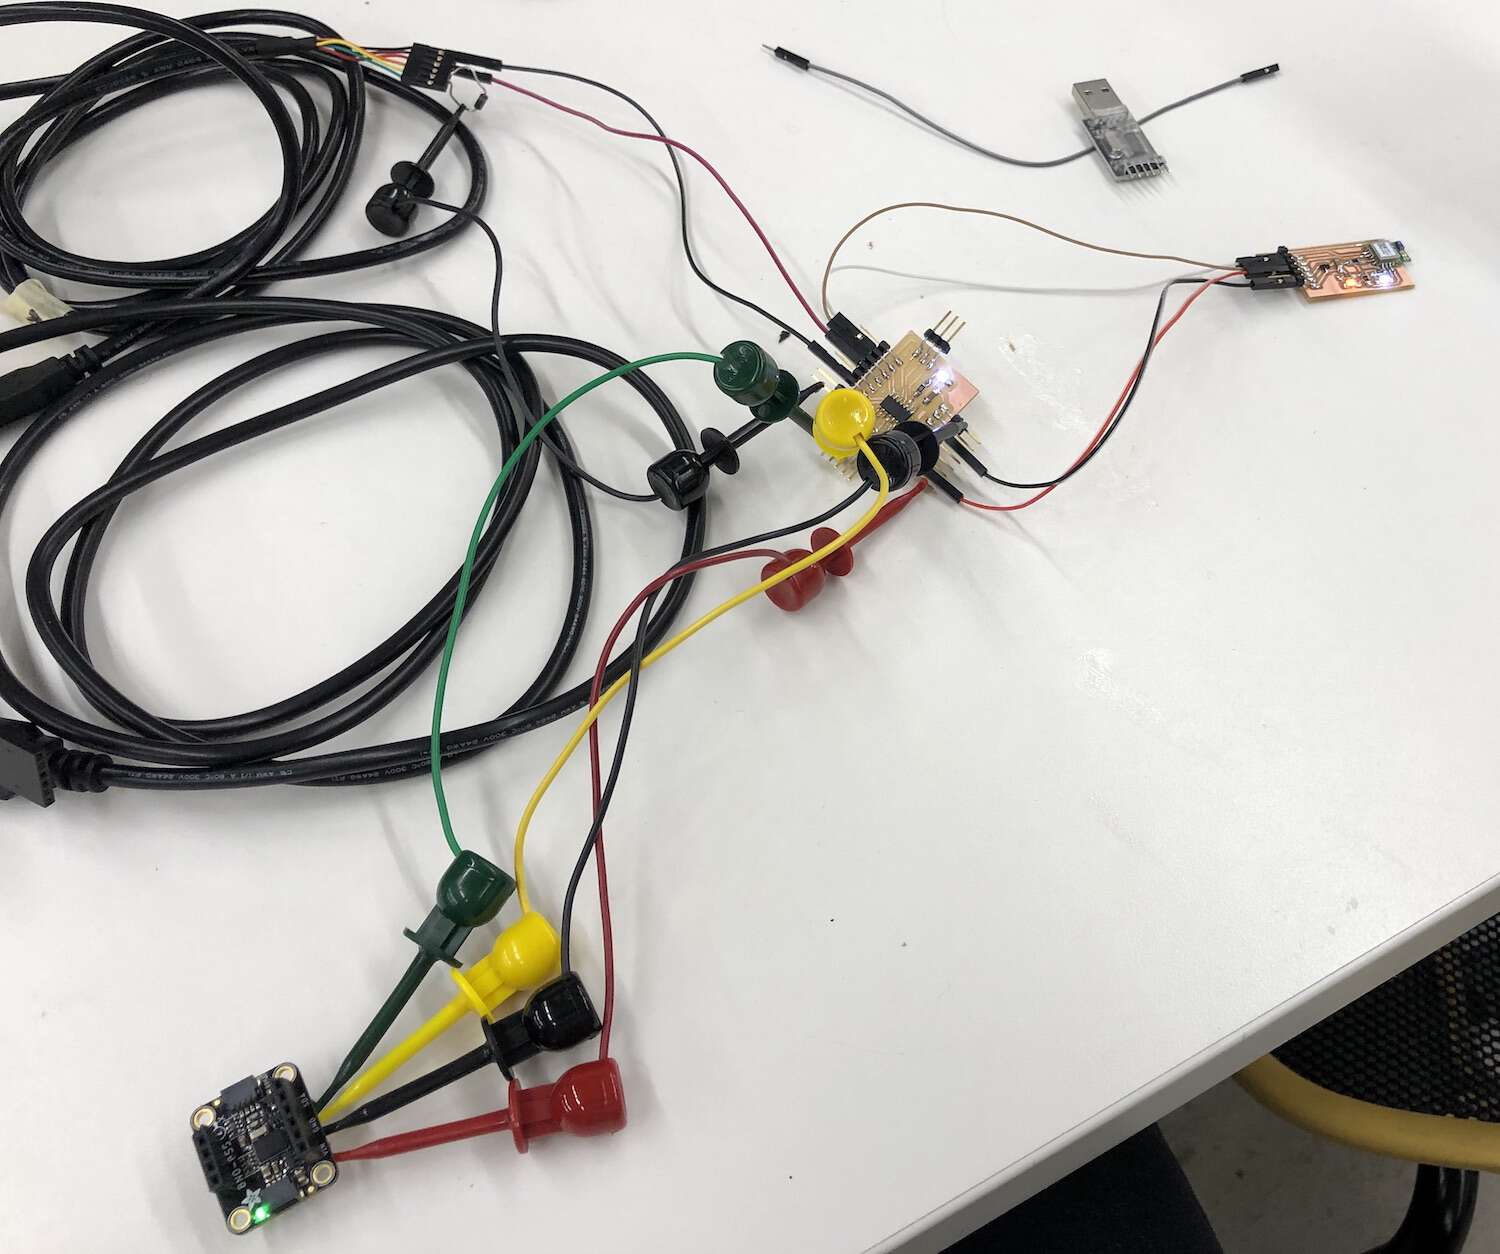
I started on this a little bit on Monday but couldn’t get it working. However it did let me get a nice pic of basically my entire electronics package (minus a battery) plugged in at once. Was nice to see that everything powered on smoothly.
On Tuesday I banged my head against this a little more. I was able to get a pass-through Serial script working, meaning that I could communicate with and program the RN4871 from my computer’s serial monitor when it was plugged in to my microcontroller. But I wasn’t able to get the RN4871 running directly from my .ino code by writing stuff like Serial.print("$$$") and Serial.println("SHW,0072,07").
There was a weird pattern that is making me nervous. When I’d upload new code, the RN4871 wouldn’t respond. When I unplugged the microcontroller from power and plugged it back in, the white connection light on the RN4871 would glow weakly. I’d have to unplug and replug a couple times before it worked again. I think this might mean I’m not using the RST button correctly but more to explore here. It’s also possible I need to update the firmware. This task remains unfinished!
Files: Here’s all my Javascript.
That’s it for weekly assignments, but I kept making progress! Check out the rest on my final project page. If you’re interested in seeing my interface evolve, in particular you should look at my final project entries for Dec. 8, Dec. 11 and Dec. 12.