
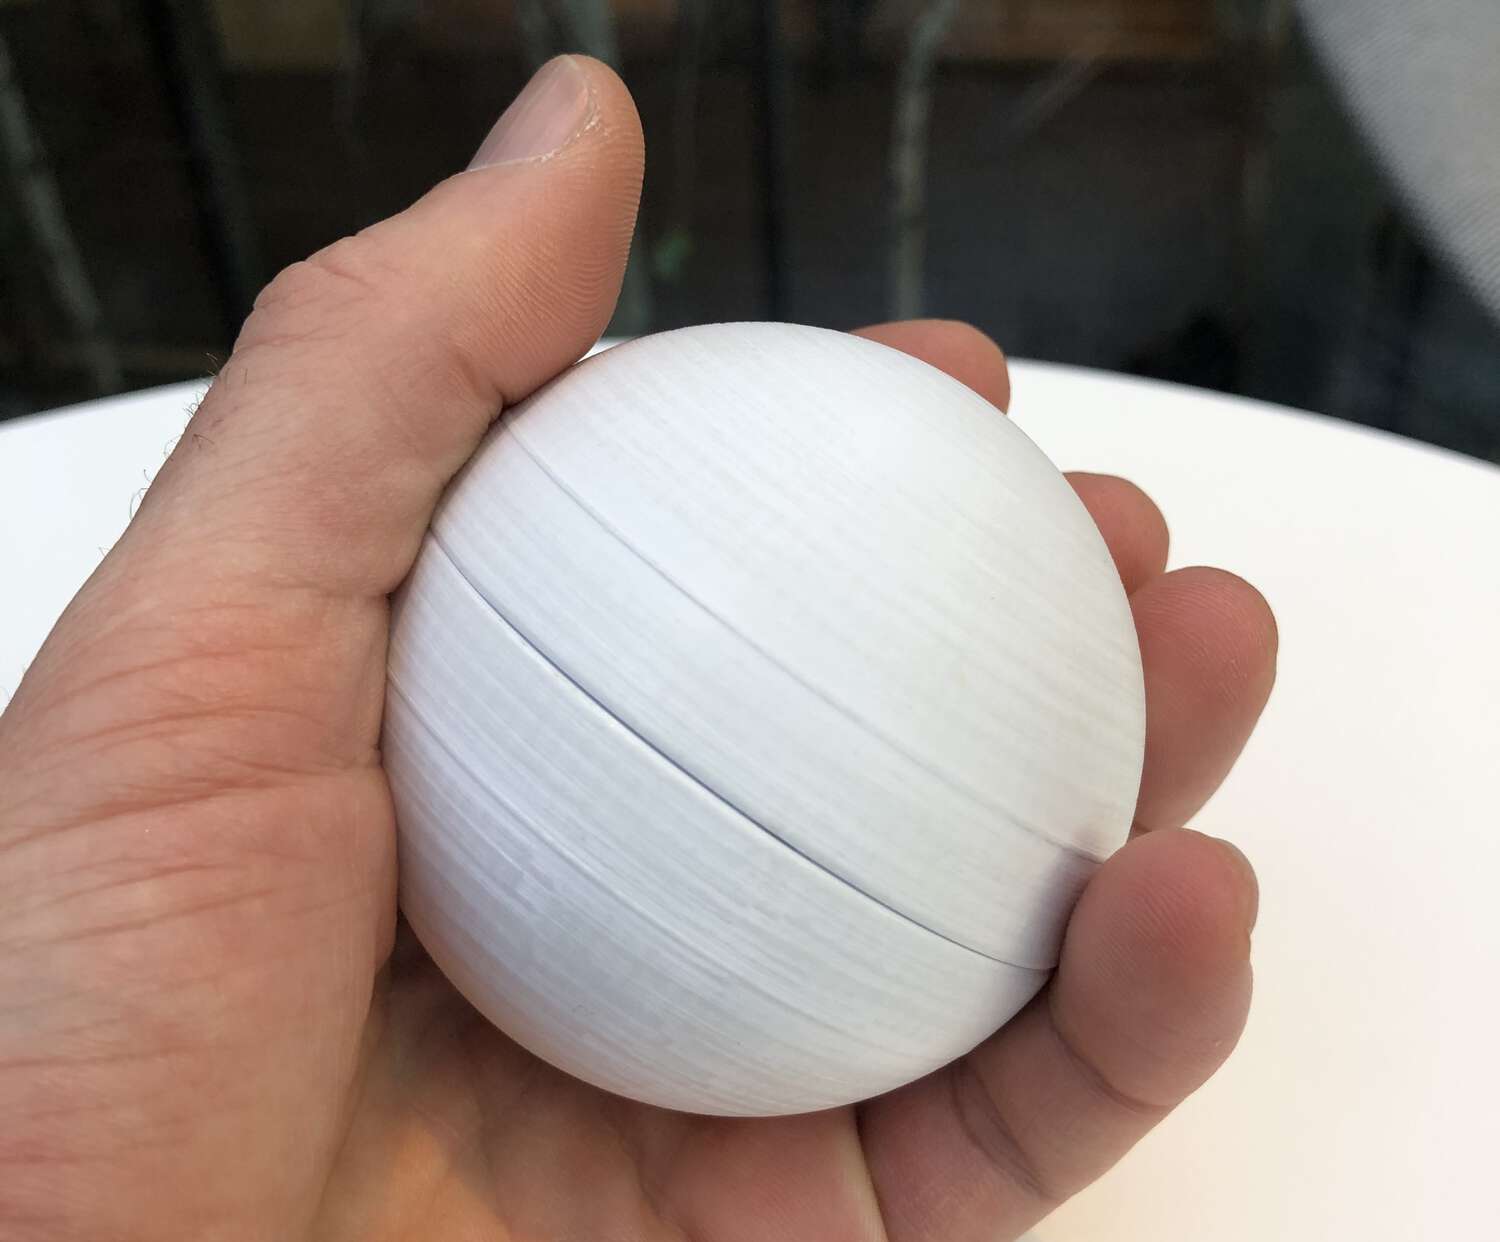
It’s a ball that records its own path as you toss it in the air. Honestly it’s easier if I just show you. Watch the video!
The whole project (on the hardware side) is basically an accelerometer + bluetooth inside of a physical device. That‘s a pretty common pattern nowadays, since it’s the basis for most VR peripherals. In fact, since my ball can record both acceleration, direction and spin it could make for a pretty awesome peripheral for a baseball pitching game.
I also found a cool study where rock scientists made “smartstones” by shoving the same general equipment inside of a pebble.
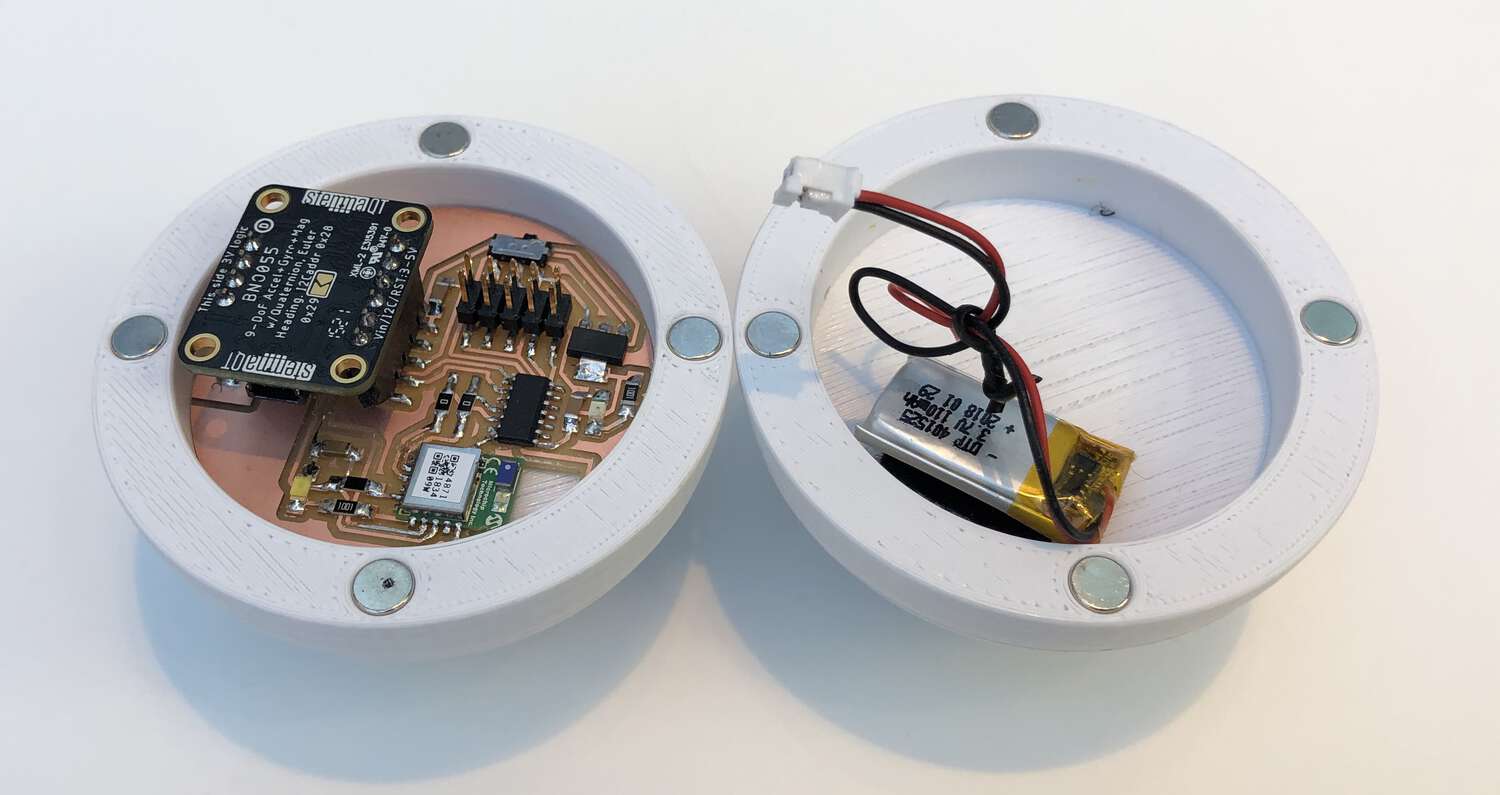
I designed two halves of a 3D-printed ball, which were sealed with press-fit magnets. Inside, I designed the battery-powered PCB that sent acceleration events over bluetooth to my computer, where they were visualized in a web interface that I created from scratch.
The core structure is PLA with press-fit magnets. The key components are an ATtiny 1624 microcontroller, a RN4871 Bluetooth chip, a BNO005 nine-axis accelerometer, and a 110 mAh LiPo battery. Plus some single-sided copper board and the usual array of small capacitors, resistors, switches and regulators.
Most of my electronic components came from Digi-Key, although I think the accelerometer may have been purchased directly from Adafruit.
The BNO005 nine-axis accelerometer was my expensive piece. Normally this would go for about $12, but because of the supply chain crunch it’s currently $35. The RN4871 is $7.71, the ATtiny 1624 is under a dollar, and the LiPo battery is $5. The other components and materials all together (including PLA) probably added up to a couple more dollars total.
I used 3D-printing, PCB milling, soldering, embedded programming, front-end programming, and, for purely superficial logo purposes, vinyl cutting.
My project was a success! I produced the result I set out to do. I was particularly pleased with my PCB design, web interface, the signal processing within the embedded code, and my press-fit magnet setup. All of these took a lot of iteration, and it paid off.
Things that didn’t go so well: I had intended to improve my final product by casting a rubber ball instead of 3D printing, but I didn’t get far during molding/casting week and I wasn’t able to return to that skill. I also had to use a simpler physics calculation than I was originally planning, because using an accelerometer to estimate position in space via integration is what they call “non-trivial,” meaning it’s very hard to do well.
I evaluated this project by feel. As I through a ball in the air, did the reaction on screen feel like a reasonable approximation of the force I put into the toss? I was happy with how this turned out in the end. Another metric that I was proud of: The project consistently works, although I haven’t dropped the ball yet. Ed note Dec. 13: During open house, someone dropped the ball. It’s not drop-proof.
This project demystified a lot about electronics for me. I had no background in fabrication, and it had been about 5 years since I’d engrossed myself in learning new stuff that was so technical. So the biggest takeaway for me was just that I can still learn new stuff!
On the technology side, I learned that it’s not so hard or expensive (with a three-axis accelerometer) to create custom peripherals that would work well in a VR environment. It’s pretty imagine to imagine these sorts of physical ”mods” being more popular in the future, if VR platforms open themselves up to them.
Like I mentioned in my Week 1 write-up, I wasn’t too crazy about my initial final project proposal. Now that we’ve starting playing around with electronics and I’ve gotten a feel how critical input/output is to this class, I think I have a better idea.
I went to the MAS class Recreating The Past for a bit and the teacher showed this incredible animation called “Curves”. Here’s a brief clip of it.
When I work/write, I often like to pace and toss a ball up and down. But I don’t do this consistently. If I’m at the beginning of a thought, I’m tossing a lot. When I’m really on to something, I stop tossing.
So my idea is this: I cast a hollow rubber ball and secure an accelerometer to the center of it. That sensor wirelessly passes accelerometer data to a computer interface, where the height of the ball is charted over time. This in a sense creates a visualization of my thought process as a series of parabolas and gaps. On my wife’s suggestion I tentatively call this project “Catch and Release.”
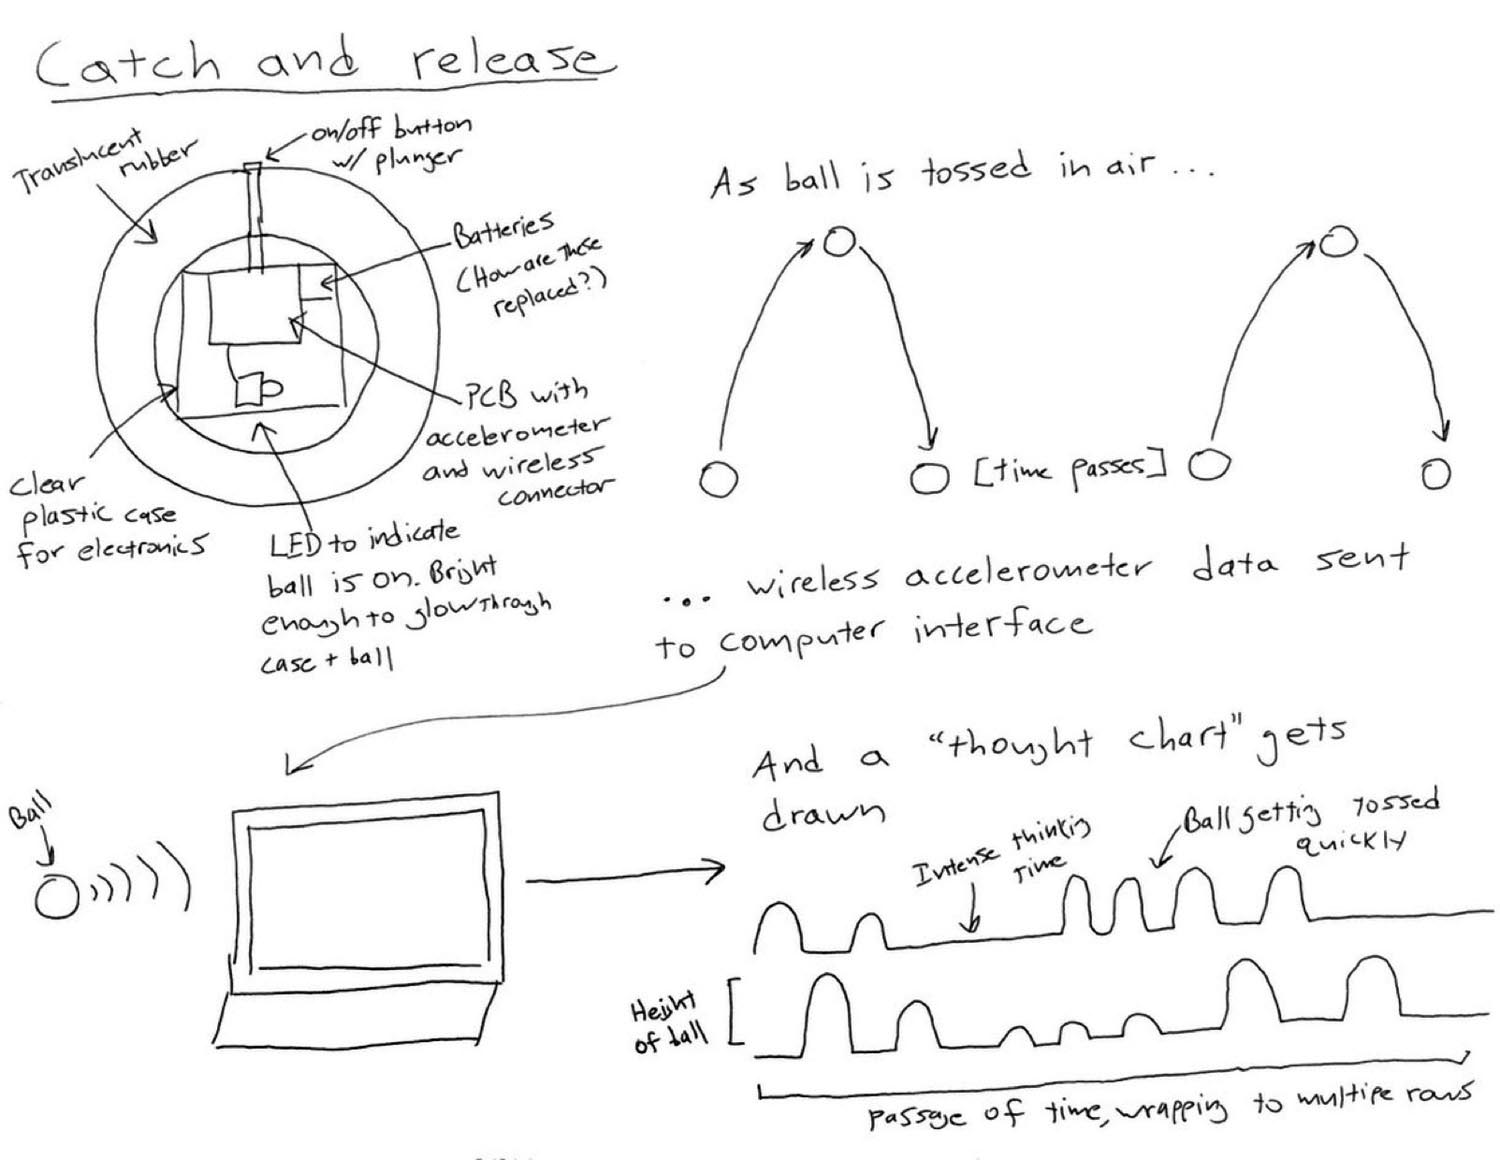
I’ve heard that accelerometers can be noisy, but I should be able to take advantage of the fact that a ball thrown in the air can only take one type of path. So if I know about how long it was in the air and about how long it took to switch from going up to going down, I should just be able to math my way to a smooth parabola.
I think this could work out for me for a few reasons:
One challenge is that I’ll need to make sure my electronic components are totally secure/durable, while still having an exposed on button. Because they’ll need to survive getting tossed around and dropped. Hopefully the rubber ball will help.
So let’s see how it goes! Credit to TA Julia Ebert for pointing me in the direction of IMUs.
Haven’t really worked on this at all, but had a realization that could solve one of my design problems. I need the inside of my rubber ball to be accessible, so I can stuff it but also so that (longer term) the battery can be changeable.
During 3D week, there was a cool example of a printed skull (Julia again!) that was openable because it was printed in two halves, held together by embedded magnets. I think I could try something similar, which would also maybe mean that I could place the on switch on the inside instead of exposing it on the outside.
For my Week 8 assignment, I designed a magnet-locked ball with an inner chamber. This is short summary but you can read more about the details on that page.
I tried to cast it in silicon rubber. This went very badly! But I 3D printed a prototype version and I was actually very pleased with that result.
And then I 3D printed an improved version (17 hour job!) and at first I was even happier with how that came out. There was basically zero gap between the two hemispheres and the bond was strong.
I glued these magnets in instead of press fitting them, and one of them got ripped out pretty quickly so I don’t think glue was the most effective. Alternatives would be going back to press-fitting, or doing a more complex 3D print that embedded the magnets right below the surface of each hemisphere.
So progress on the final project front, but that leaves me with two options going forward. I’ll probably try casting again. The first week I tried milling PCBs that went horribly too, so maybe my second casting will go better. But I also was pretty into the 3D printed ball, and I think I know what I have to do in order to make it work really well. Plus it would be a chance to try out some finishing techniques on 3d prints.
During Week 9 I tried to start working with a three-axis accelerometer, although my final project will end up needing a verison with a gyroscope if I want to accurately measure the arcs of a thrown ball.
I didn’t get all the way there though. But I know what steps I‘ll need to take to get one working in the future! (Answer: A microcontroller more powerful than the ATtiny 412.) So still progress.
In Week 10 I actually got that three-axis accelerometer working using an ATtiny 1624 microcontroller. I used it to trip a small vibration motor.
A three-axis accelerometer can’t really do what I intended for my final project (follow the path of a ball) – I‘ll need a gyroscope included for that. So I messed around with another potentially useful calculation I could get out of this simpler chip: Total accleration/deceleration. In other words, how much change in the motion does the ball have across X, Y and Z. I define that as follows, after a little bit of dumb calibration.
float movement =
	abs(event.acceleration.x) +
	abs(event.acceleration.y) +
	abs(event.acceleration.z) - 15;

if(movement < 0){
	movement = 0;
}
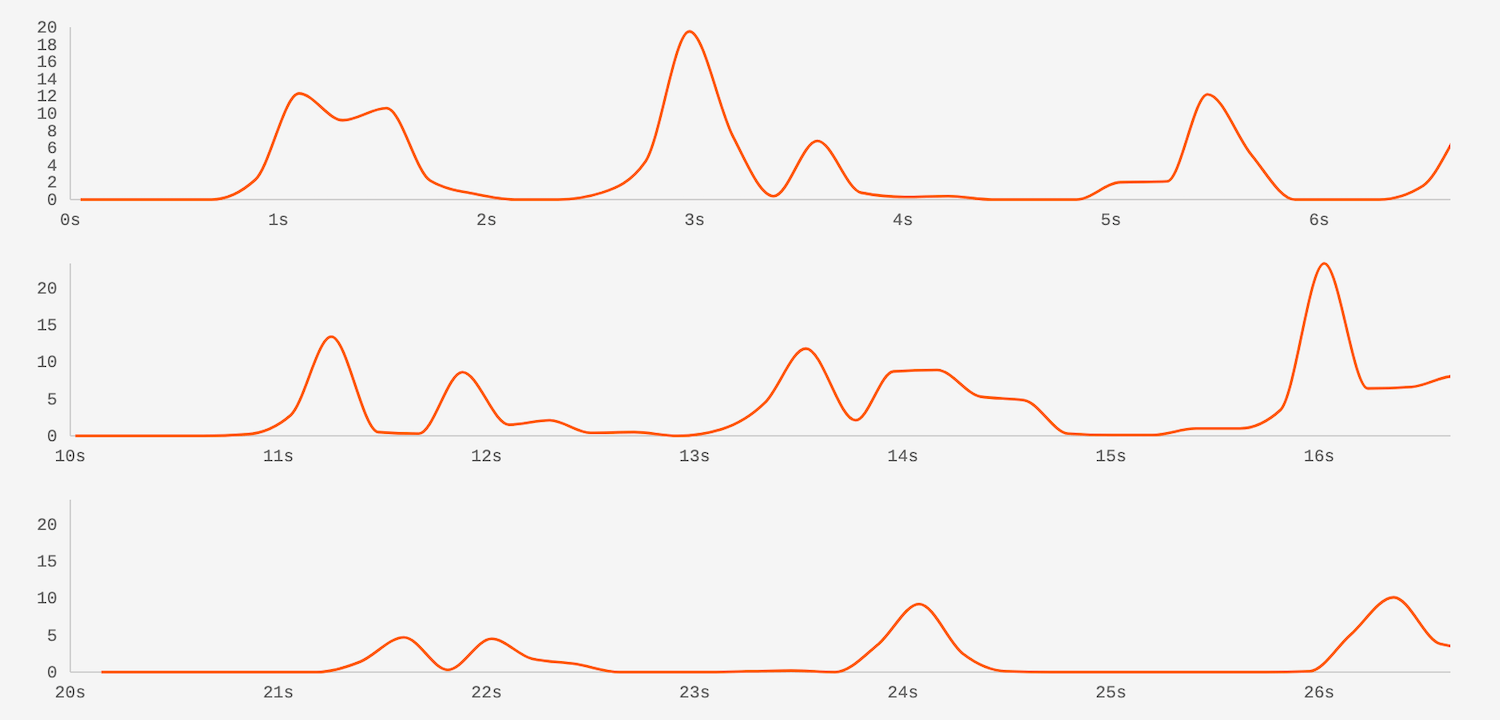
If it’s impossible to get a nine-axis accelerometer or it doesn’t work well, I think I could pivot to building a visualization around this figure. It should change as you toss a ball in the air, and it should be very sensitive to how quickly the ball is moving (rotating) during that toss. Just by wiggling my accelerometer, I get something like this.
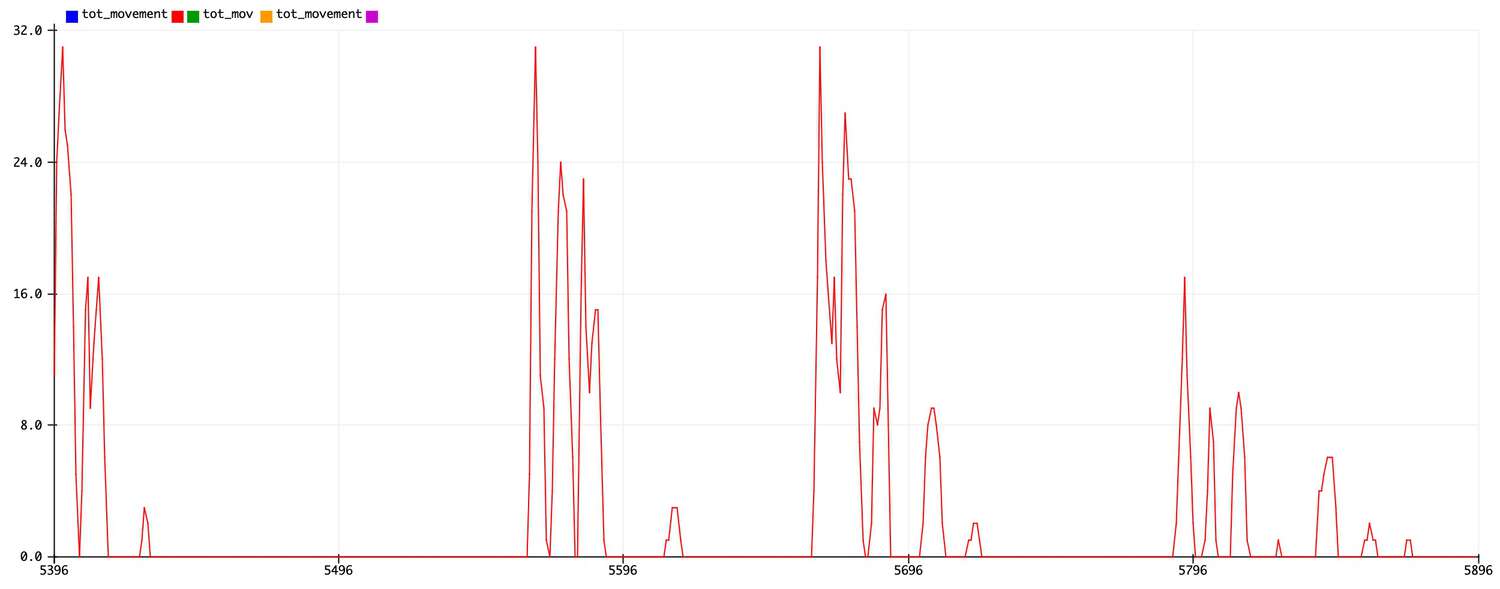
It’s also possible I could use it for a secondary encoding even with a nine-axis chip. Like if the line showed the arcs of the ball, this figure could map to line thickness so spinny tosses look different than “flat” tosses, visually.
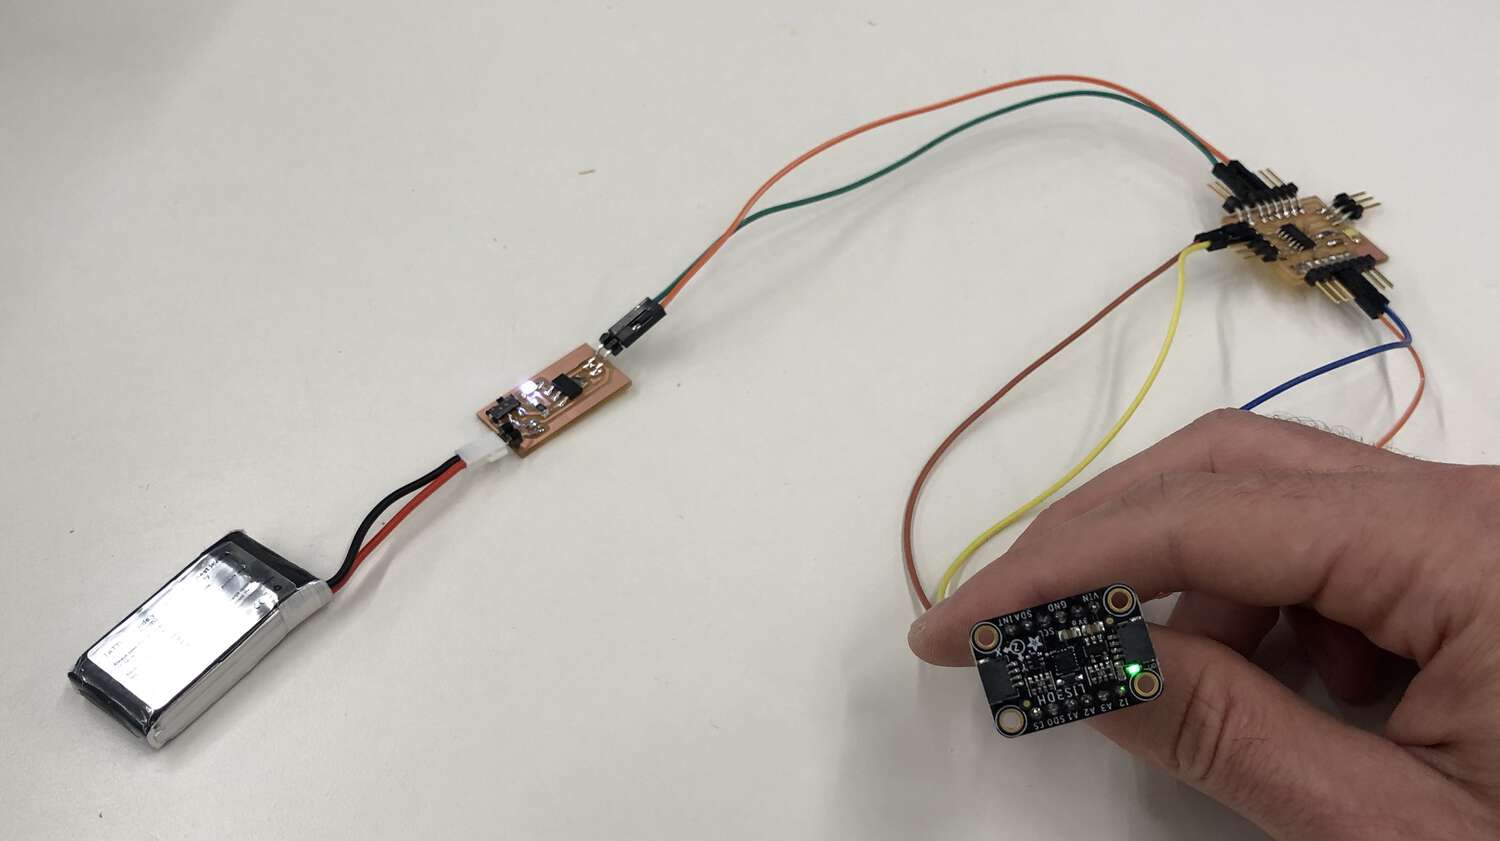
But that’s not all! This week I also started playing with batteries. I hooked up my breakout to a 3.7V LiPo battery, using a peripheral board that regulated the voltage down to 3.3V and included an on/off switch. As a nice to have in the future, I’d like to add a recharging board for this battery.
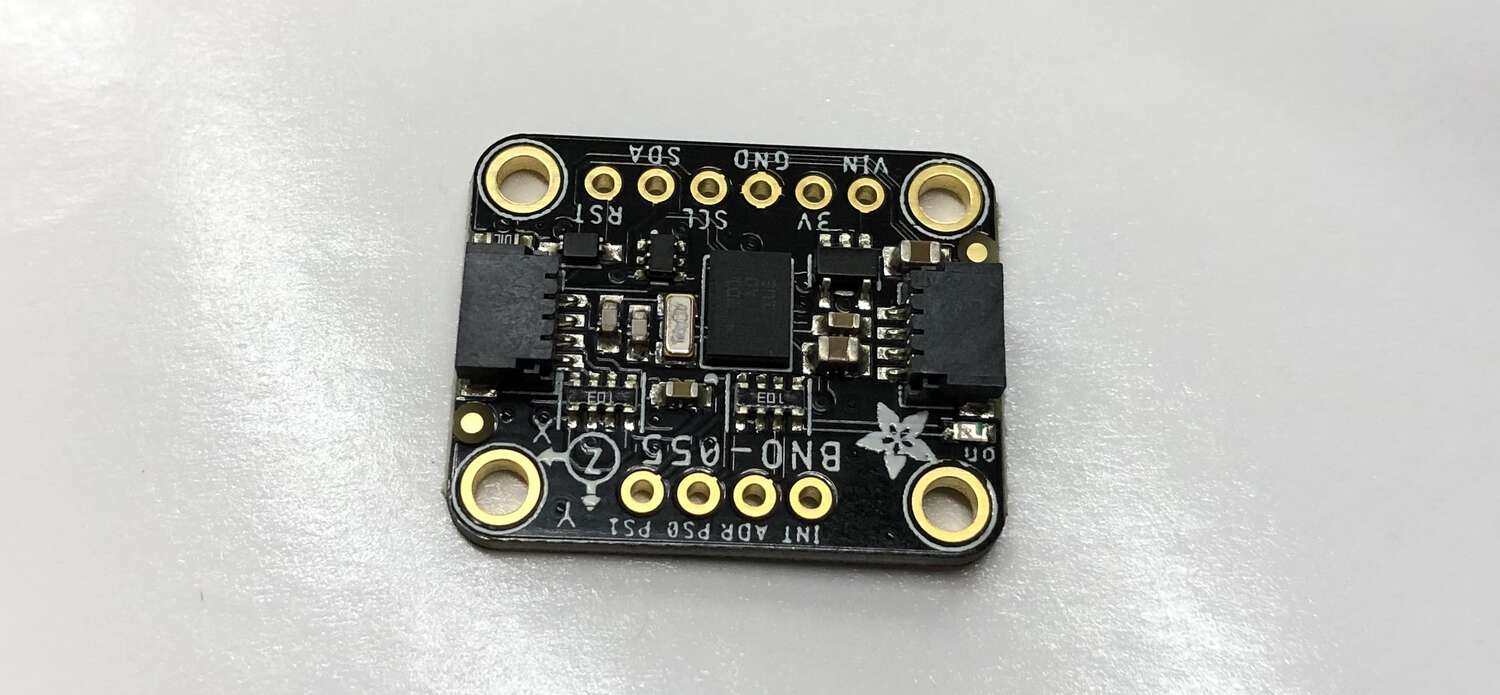
An important coda to output week, deserving of its own entry. I got my hands on a nine-axis acceleromater! The Adafruit BNO-055. I didn’t get a chance to start messing around with it yet, but it’s by far the most important (and expensive) component of my final project as designed. Yay!
The big goal in Week 11 was to pass data from my nine-axis accelerometer to my computer through an RN4871 Bluetoooth chip. This was too ambitius, but I was able to create a connectable, configurable Bluetooth chip.
I was able to pass a message from my phone to a Serial monitor on my computer, and also discover my bluetooth device in Chrome. Doesn’t sound like a lot but it means the ”hardware” part of networking is finished, and I think I’m going to configure my final board so I can just plug this same bluetooth board into it.
So this is another week where I made some but not all the progress I needed. We’ll see if this bites me in the ass over the last few weeks.
A good amount of progress, with a lot of detail on my Week 12 page.
First I was able to build a simple interface that could read sensor data from my microcontroller over serial and visualize it in the browser. Here it is in action.
I wrapped that up fast enough that I was able to turn to many of the loose ends in the electronics portion of my final project.
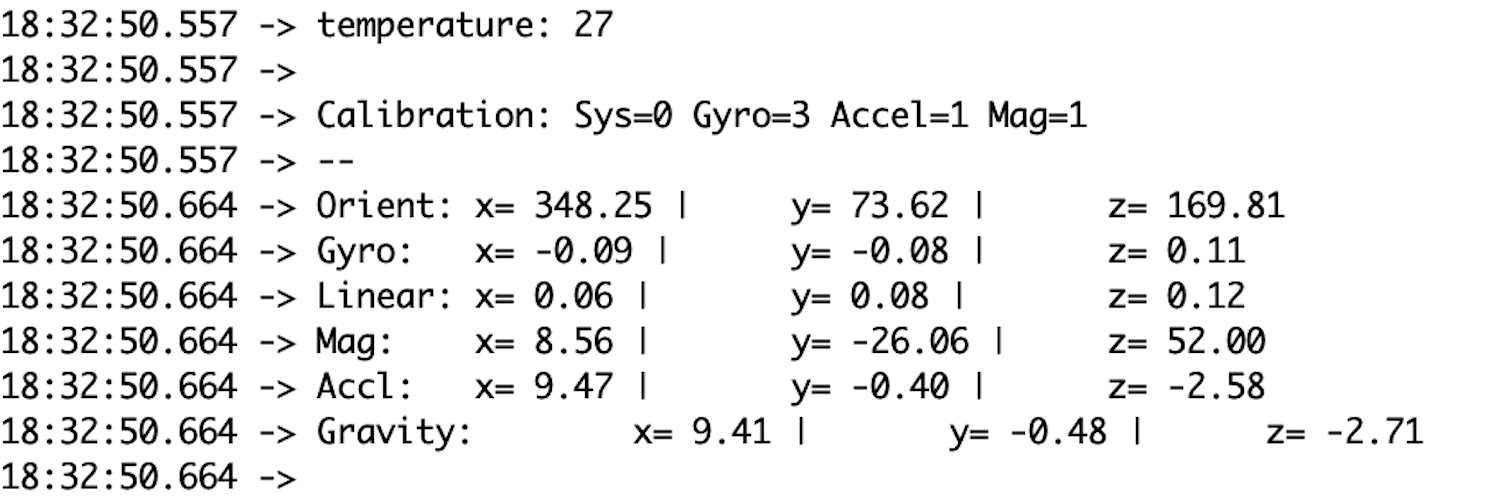
First I was able to get my nine-axis accelerometer working. Howevever, I still need some help doing the physics math to arrive at the value I want, which is basically ”acceleration perpindicular to Earth, regardless of device orientation.”
Then I spent the better part of two days trying to get my bluetooth working the whole way. First I figured out how to send data over my RN4871 by creating a custom GATT service with read/notify that could pass up to 20 bytes. For example this encoded hex message ...
SHW,0072,492068617465206865782121
... shows up on the scanner app on my phone as:
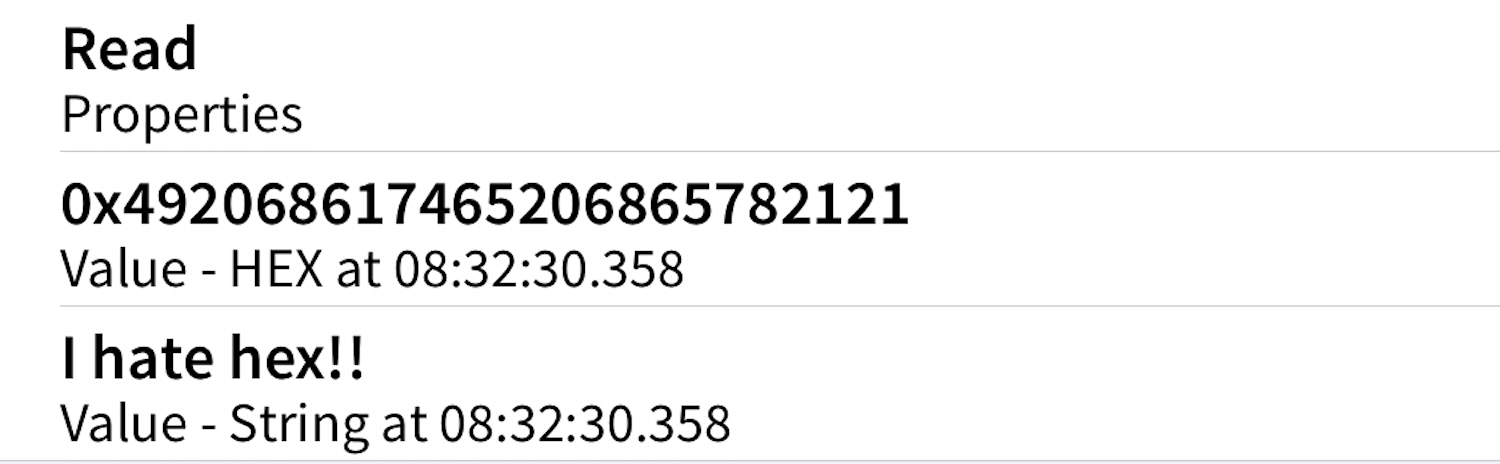
Then I was able to build a browser interface that could access BLE values that I typed in over serial. Check it out!
The final step was to hook up my BLE chip to my microcontroller so it could broadcast sensor data instead of random numbers I was tying in. But I ran into a brick wall here. I wasn’t able to get the RN4871 to respond to commands send directly from embedded microcontroller code, although I was (sometimes) able to ”pass through” my serial connection, so writing to Serial from my computer would let me program the chip over Serial1.
Sometimes the RN4871 would go into a weird ”weak light” mode when I cycled power. This freaks me out: I think I’m doing some wrong with reset pins or voltage – stuff I really don’t know that well. Or I need to update the firmware. So I still have to tackle this final step, probably with the assistance of someone else in the class.
I have two weeks left. I’m close to wrapping up the electronics portion of my project, but in the end I just got like 75% of the way there with my two big (non-interface) goals this week. Within the next week, I need to get this wrapped up so I can spend the final week packaging everything up and remaking my ball.
Tragedy struck today. The previous afternoon, I’d finally gotten my bluetooth chip mostly working. I was able to write a .ino script that told the RN4871 to update its data value, and then I was able to read that updated data value on my phone’s scanner app. This all happened right before class and I was super excited.
The next step was to also connect my accelerometer, so I could pass real numbers from that sensor to the RN4871 through my ATtiny1624. I got to the lab on Thursday and started setting this up, but I needed two USB converters – one for serial and one for UPDI – and I couldn’t find a second (I’d bought one myself). So I used one of the programmers from the bin.
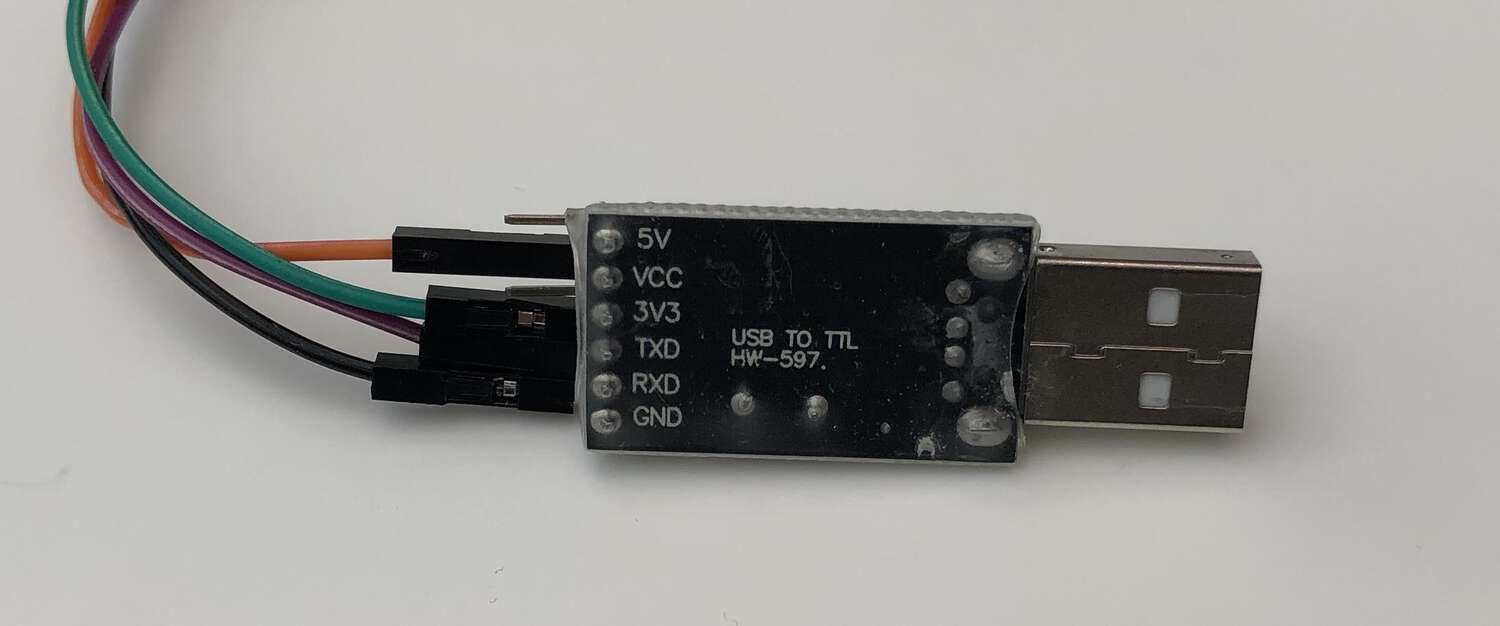
I started using this programmer as a UPDI connector, but it wasn’t working. So I switched to connecting it to FTDI.
Here’s the problem. This programmer hypothetically had different pins for 3.3V and 5V power. But I think that is a lie. Because when I plugged everything in, my RN4871 stopped working. The white light that shows it’s connectable stopped turning on, and the power light started glowing much more weakly. I think I fried the innards. The before/after:
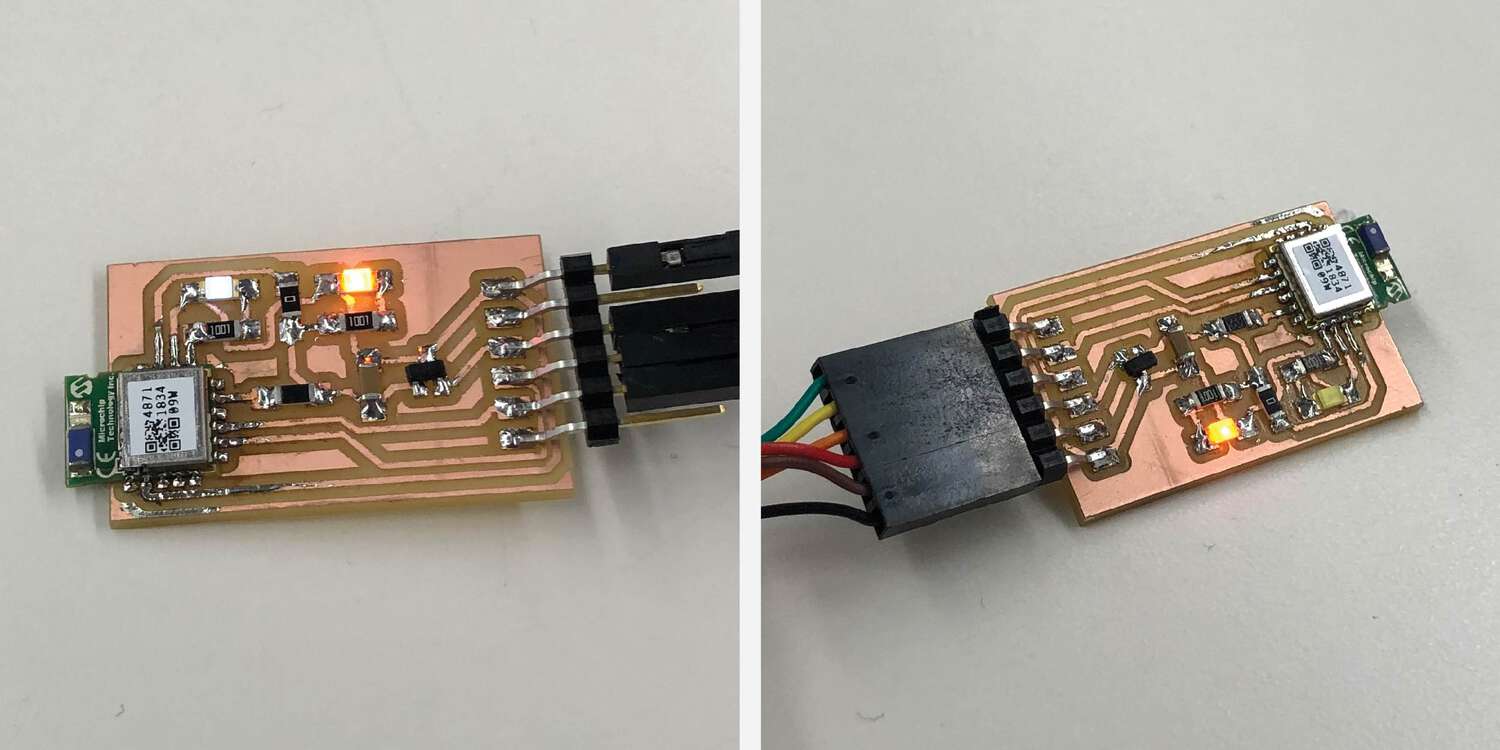
My RN4871 breakout board does have a regulator for power, but the RX and TX pins do not. So I’m pretty sure I was passing 5V to my ATtiny (fine) and accelerometer (fine), but the ATtiny RX pin was passing 5V to the RN4871 TX (not fine.)
This was maybe my low point for the entire class. I thought I’d been about 15 min away from having my complete electronics circuit working.
To clear my mind, I decided to press ahead with another part of my project: The actual ball design. I’d already made two prototypes, a 3D-printed version where the magnets were (unintentionally, but effectively) press fit, and a larger 3D-printed version where I tried without success to glue magnets in. I also tried to make an Oomoo version during molding and casting week, which was a total disaster.
In the spirit of spiraling, I decided to tackle my ball in the following order:
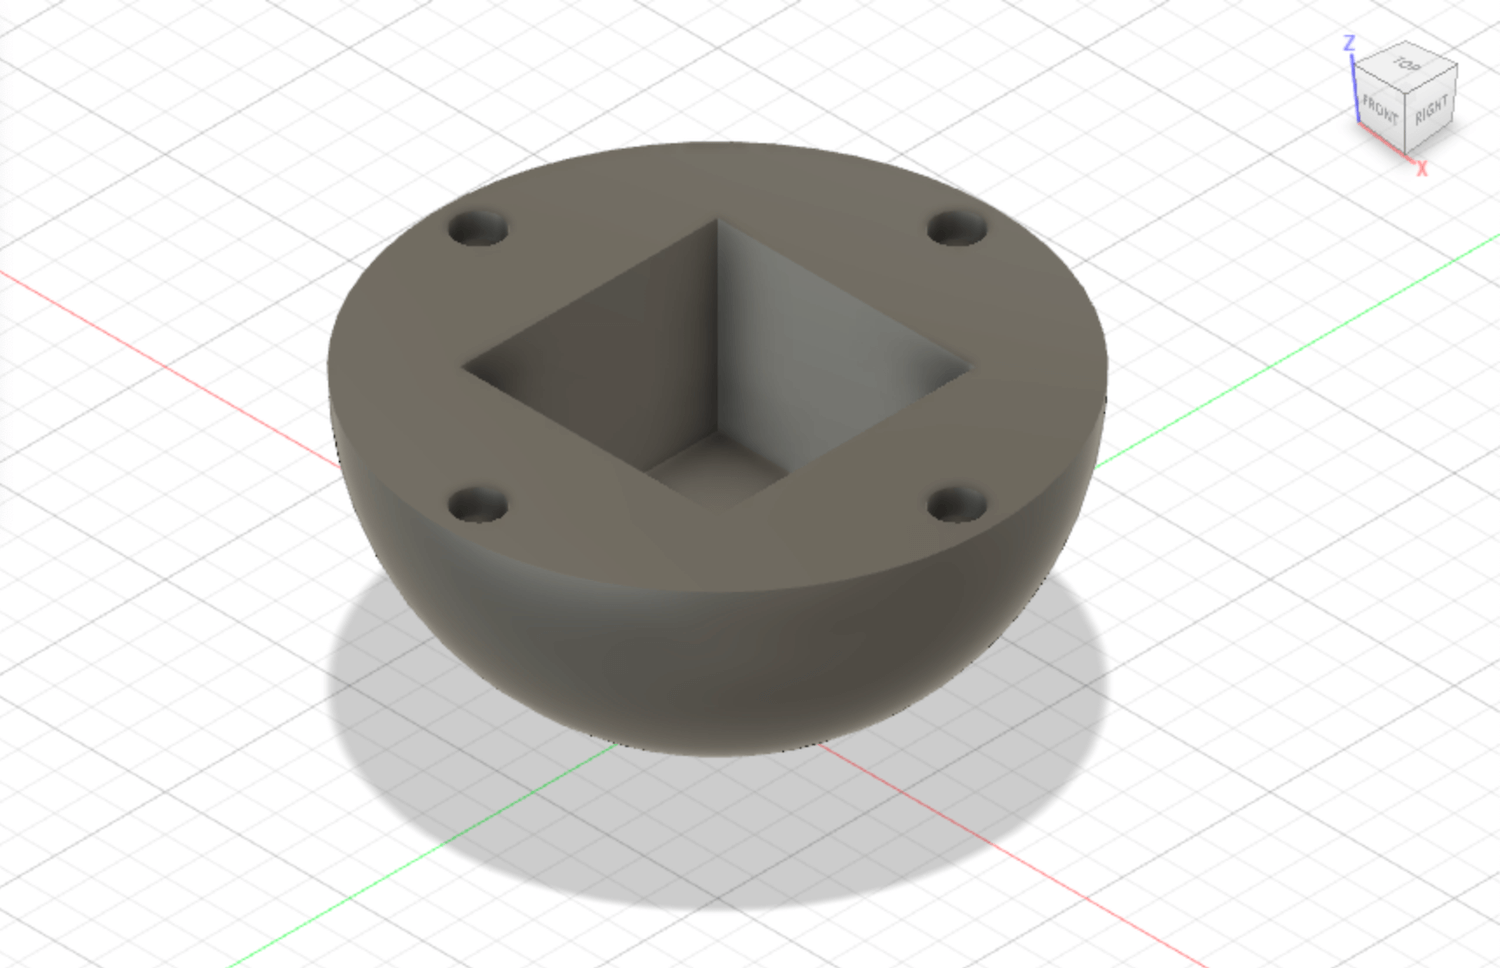
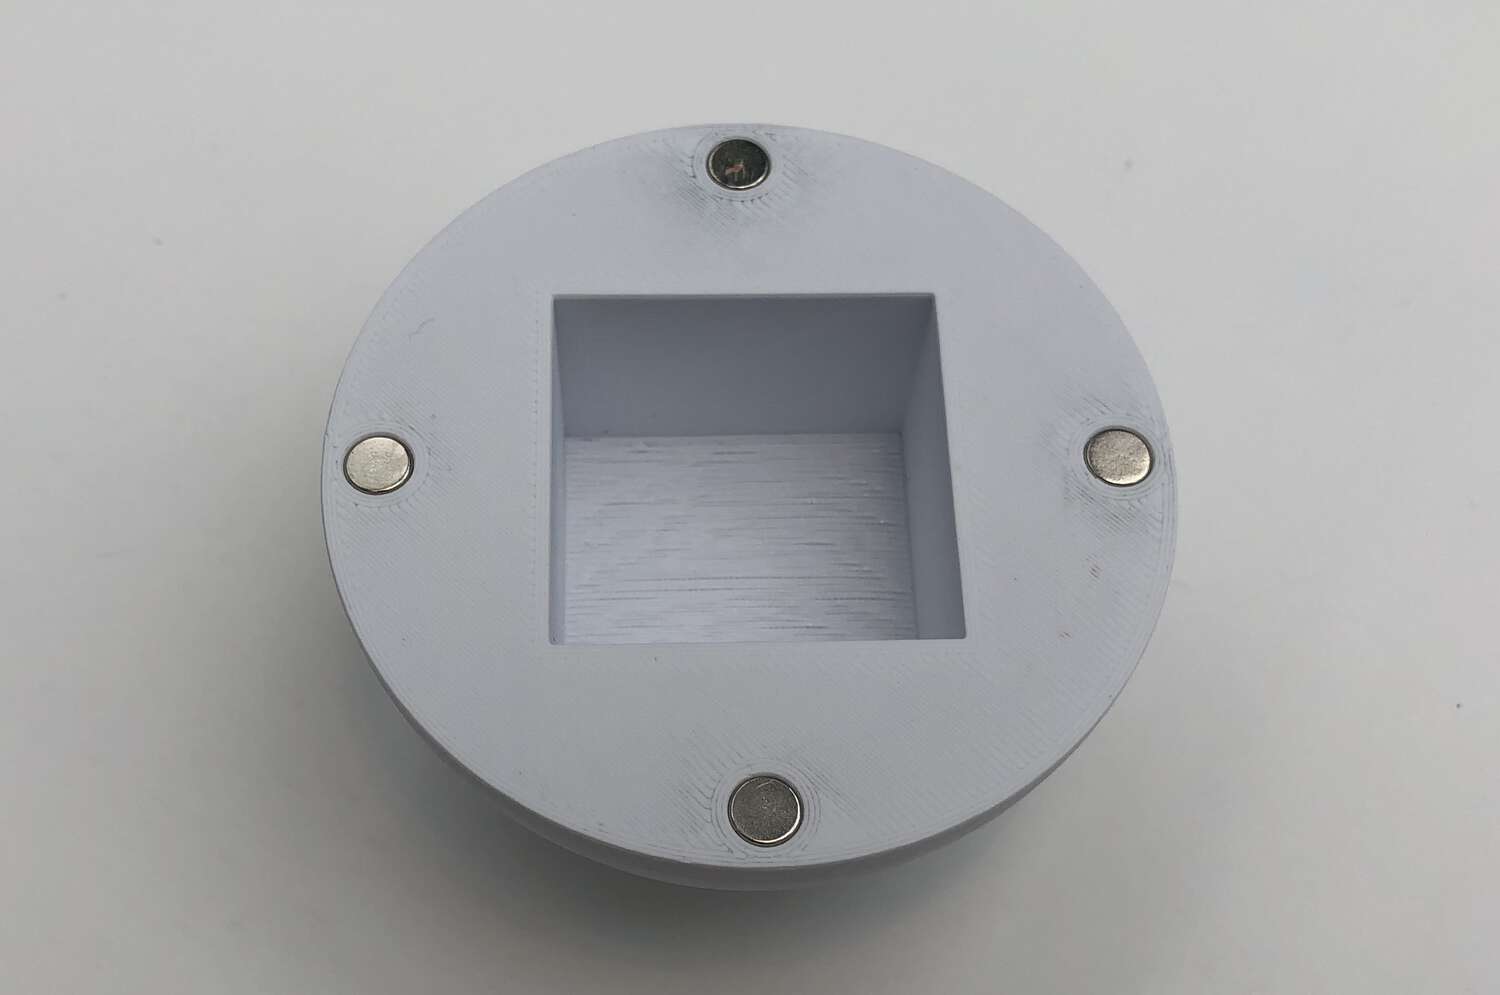
I also continued to experiment with the design of the interior, and what sort of setup I wanted for my interior electronics to fit best. I thought a square shape might be the way to go, constrained to the dimensions of one of the larger LiPo batteries. This would let me affix broken-out electronic components to the edges:
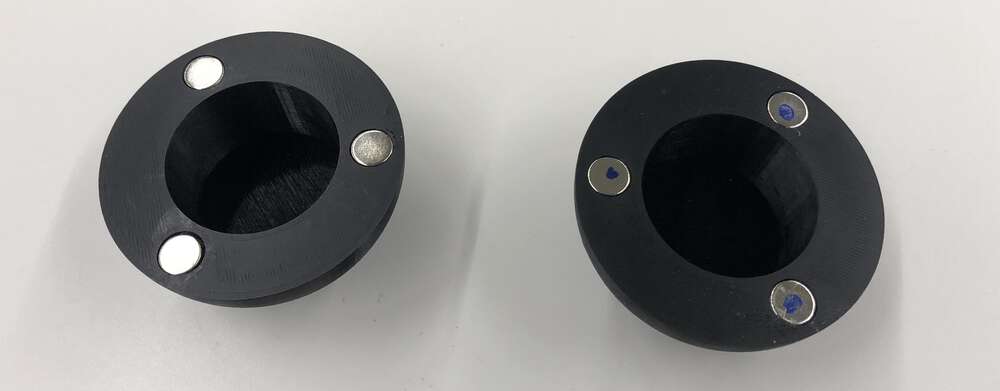
I switched back to the smaller magnets, which gave me more interior space to work with. I increased the number from 3 to 4 to make sure I kept a strong enough bond. I printed half a ball with this setup, setting the magnet width to exactly 6mm (which would hopefully ensure a tight press fit) and the depth to 3.3mm, so that the magnets would be flush or slightly sunk. Before I left the lab, I started a one hemisphere print of this design.
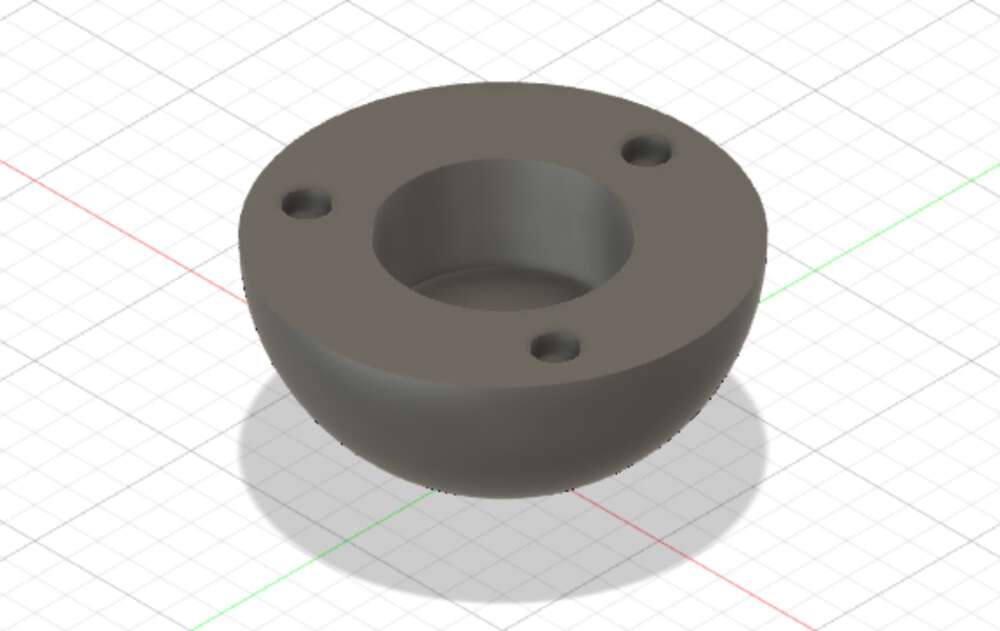
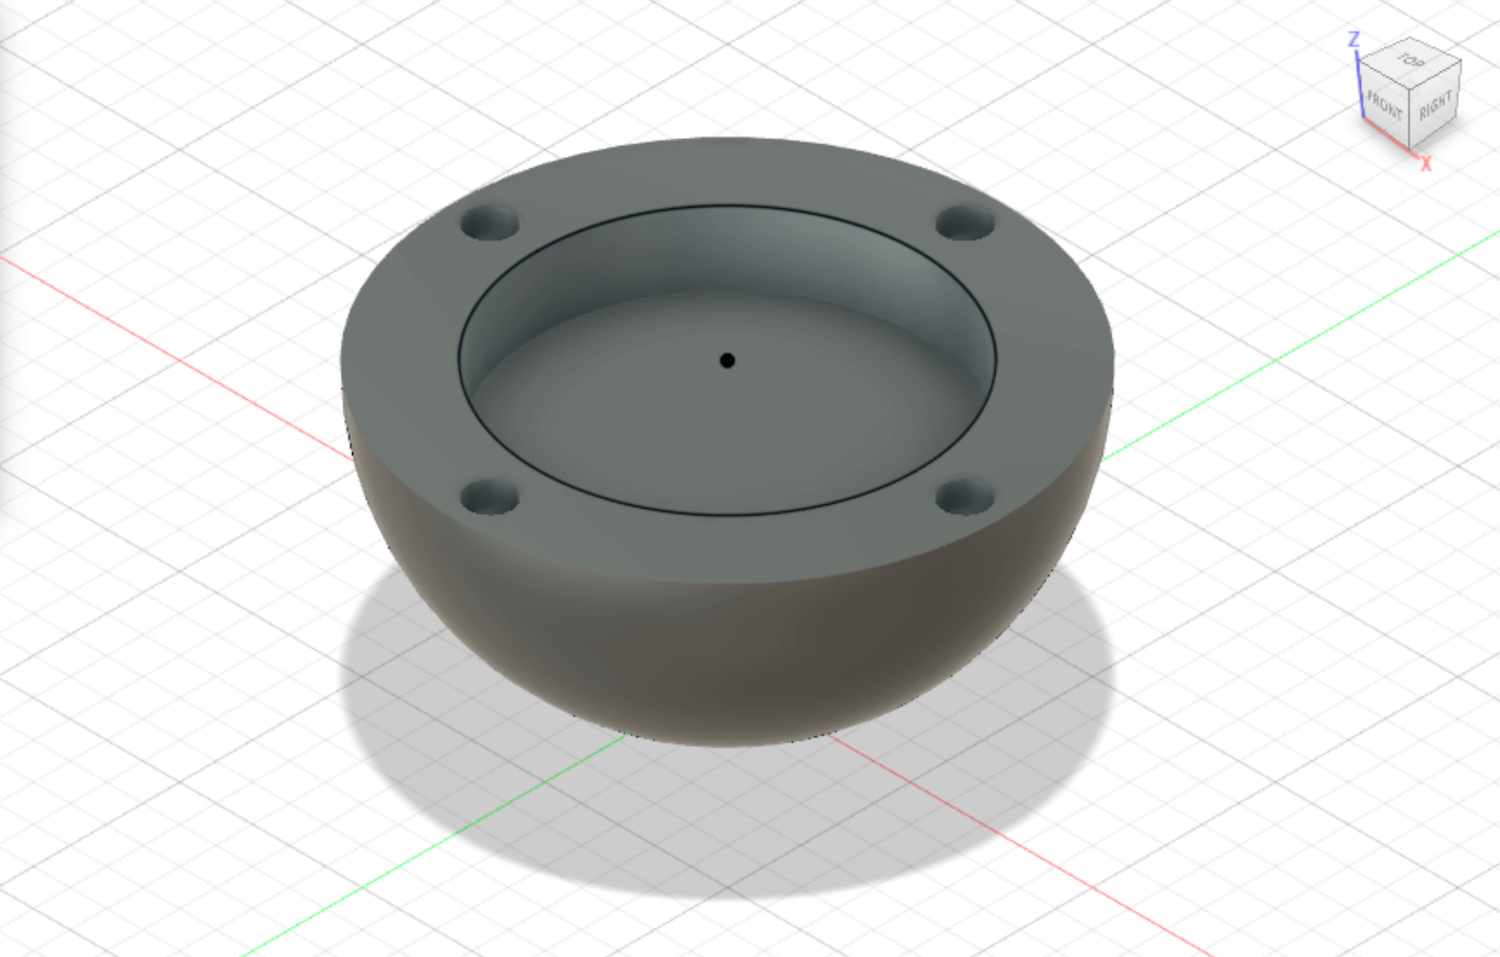
I’d gotten my booster shot on Wednesday night and was feeling pretty out of it. During a feverish shower I had a better idea for how to package my electronics in my ball. If I placed the microcontroller and RN4871 in the same PCB instead of breaking them out, I could mount my accelerometer on top of that and fit the entire package into a relatively shallow disc. Here’s how that design looked:
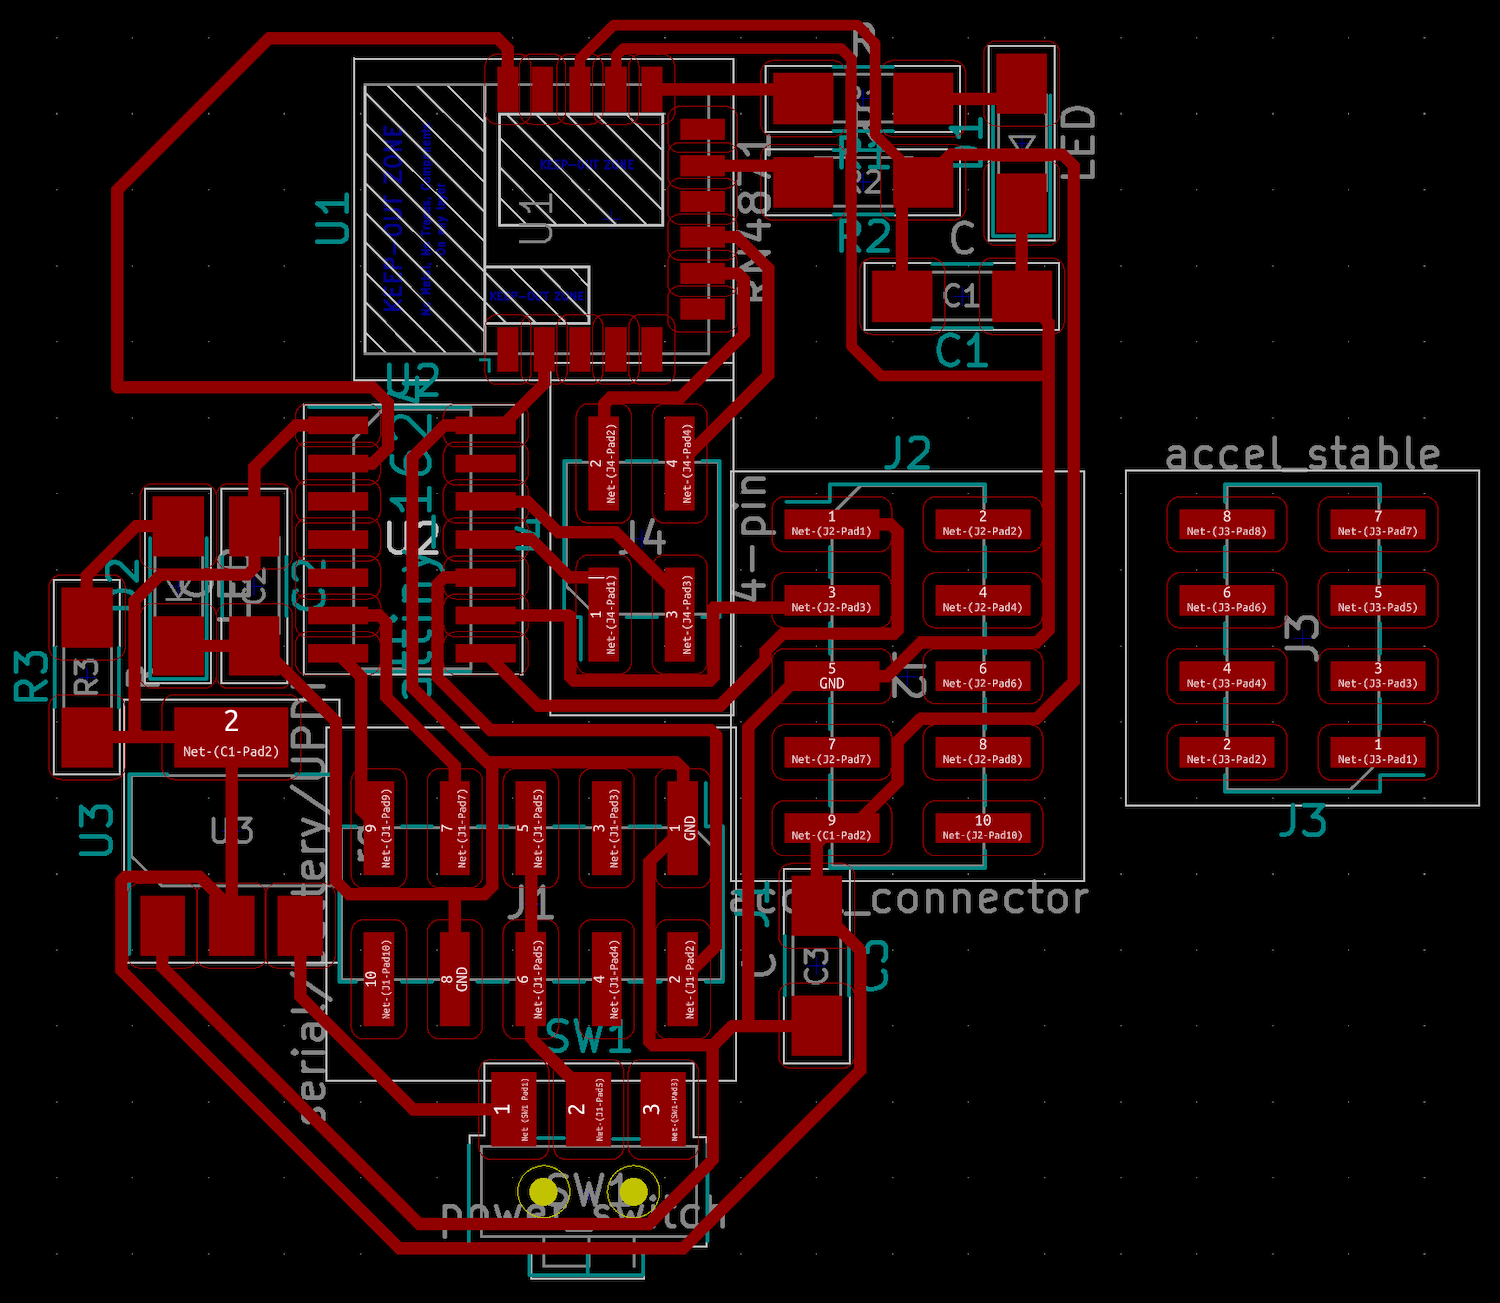
Finally, I broke open KiCad and did a first pass at designing my final board. This ended up going through some iteration, so I’m not going to link this very first layout right here. And with all that, I called it a night.
My 3D print test – with the square design – was done when I got to the lab. I pressed in the magnets, and they fit very nicely horizontally, although vertically one of them was slightly non-flush. So I started my “shallow disc” test print, and changed the magnet depth from 3.3mm to 3.4mm. But overall the square result was very promising.
It was time to mill what was hopefully my final major board. I went through a very careful checklist to ensure that everything was properly routed. But when I milled it, there must have been some bounce in my board because it came out crappy.
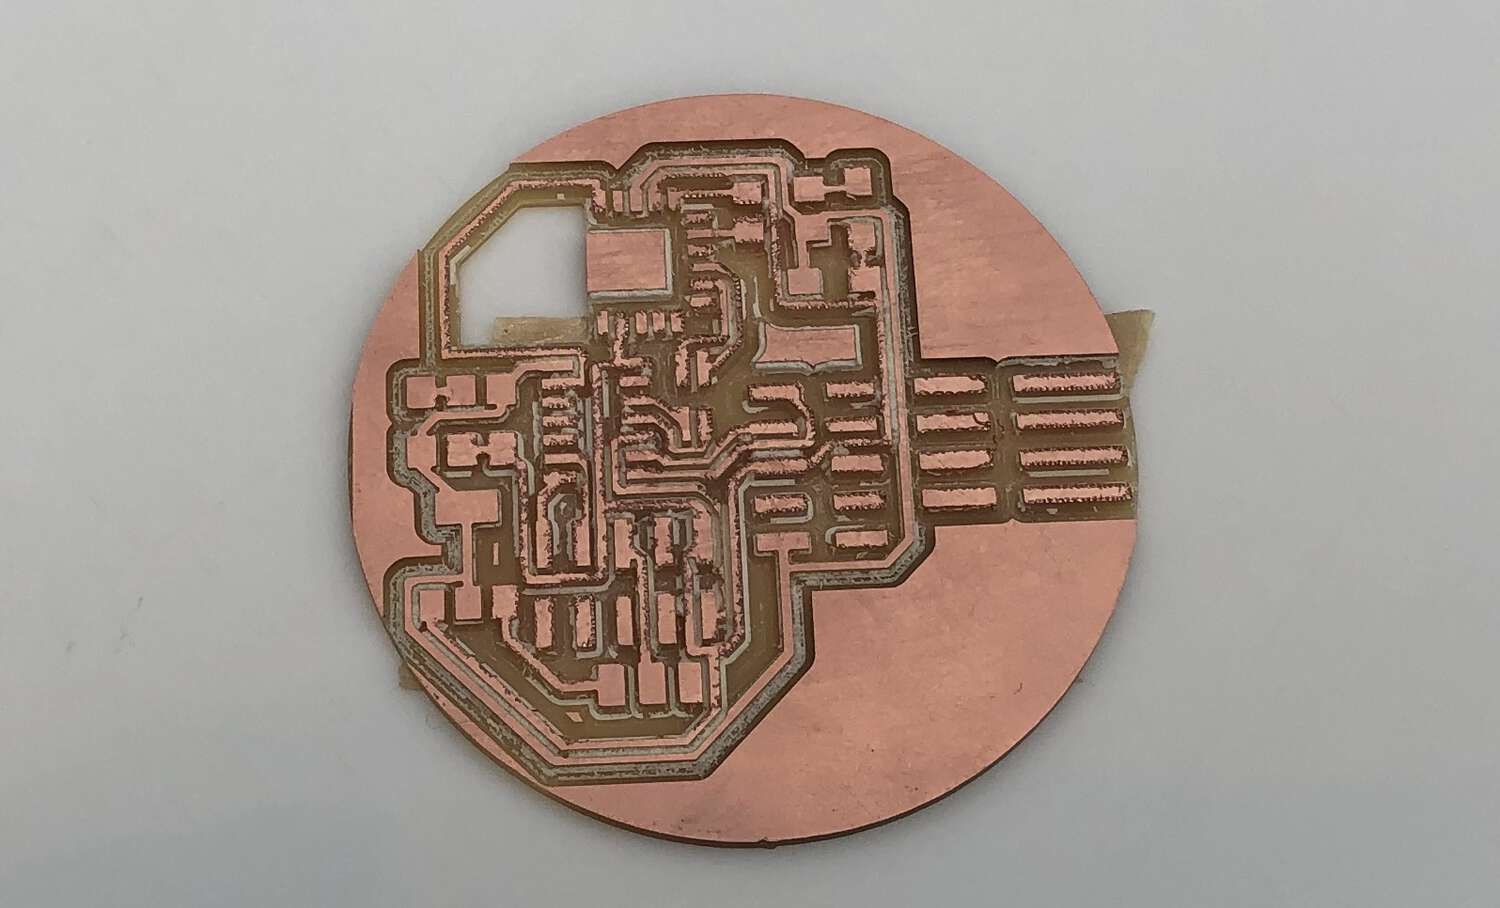
It was probably a good thing though, because the crappier version made it easy for me to give the whole thing a very close pass. I noticed one mistake and a few small areas for improvement:
With those edits, here was my final, final schematic. I hope.
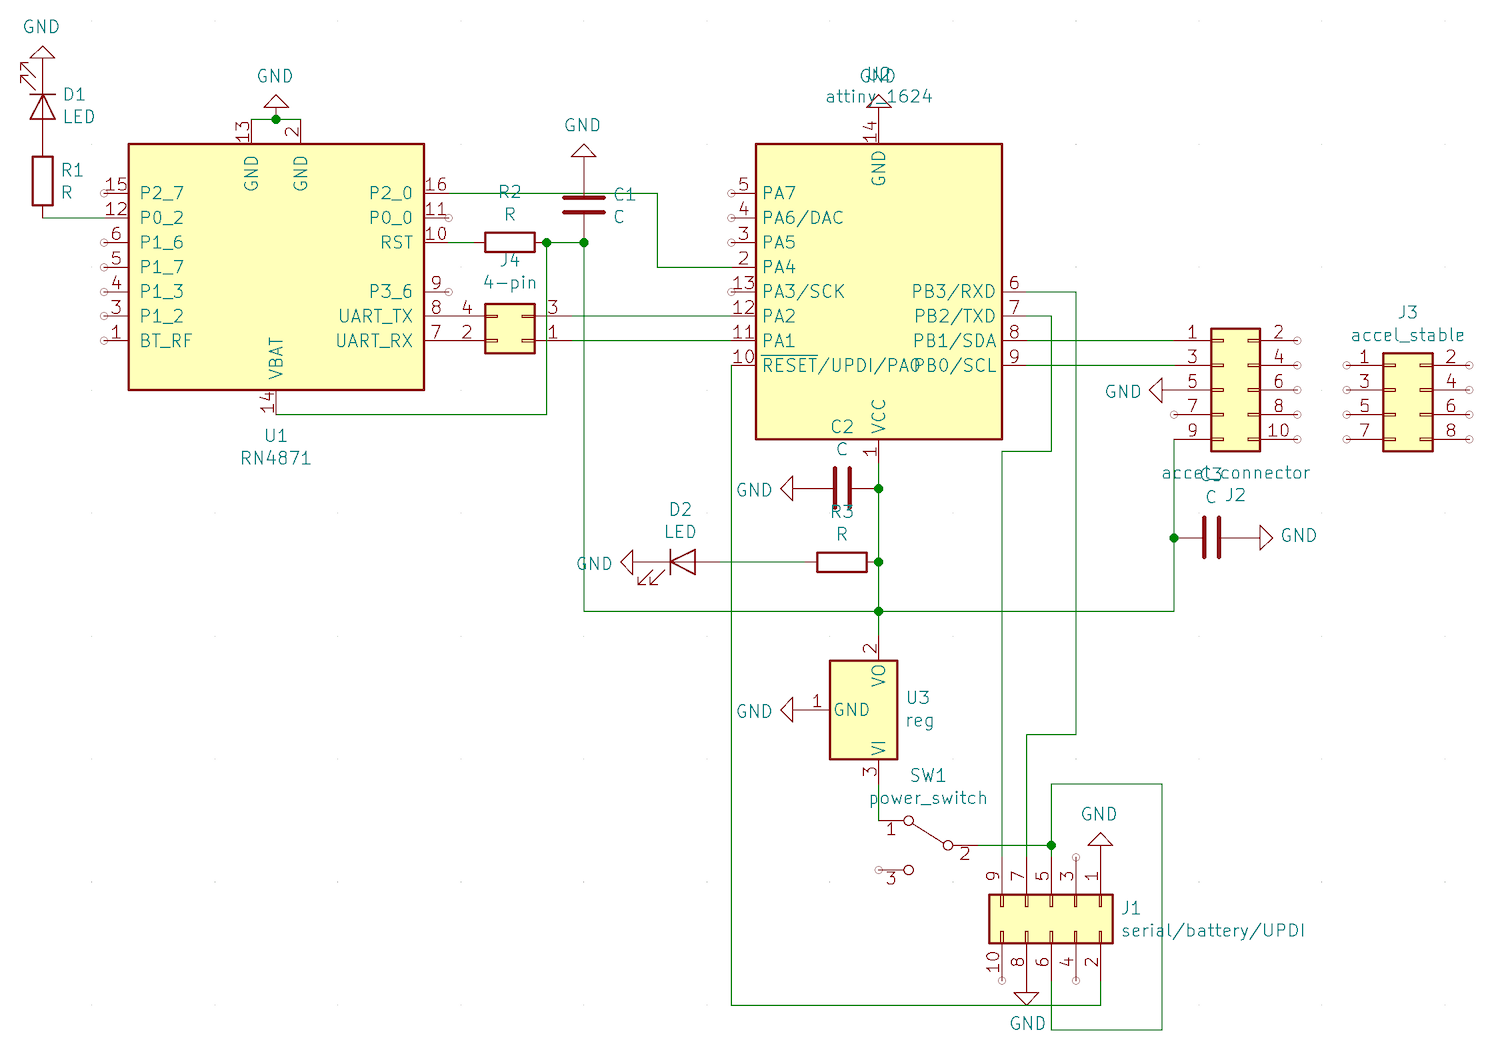
And the final traces.
Meanwhile, I got my “shallow disc” 3D ball prototype printing and called it a night. Just a half a ball, aligned so it would connect to the square-well prototype.
Huge day. “I’m actually going to finish this project”-quality day.
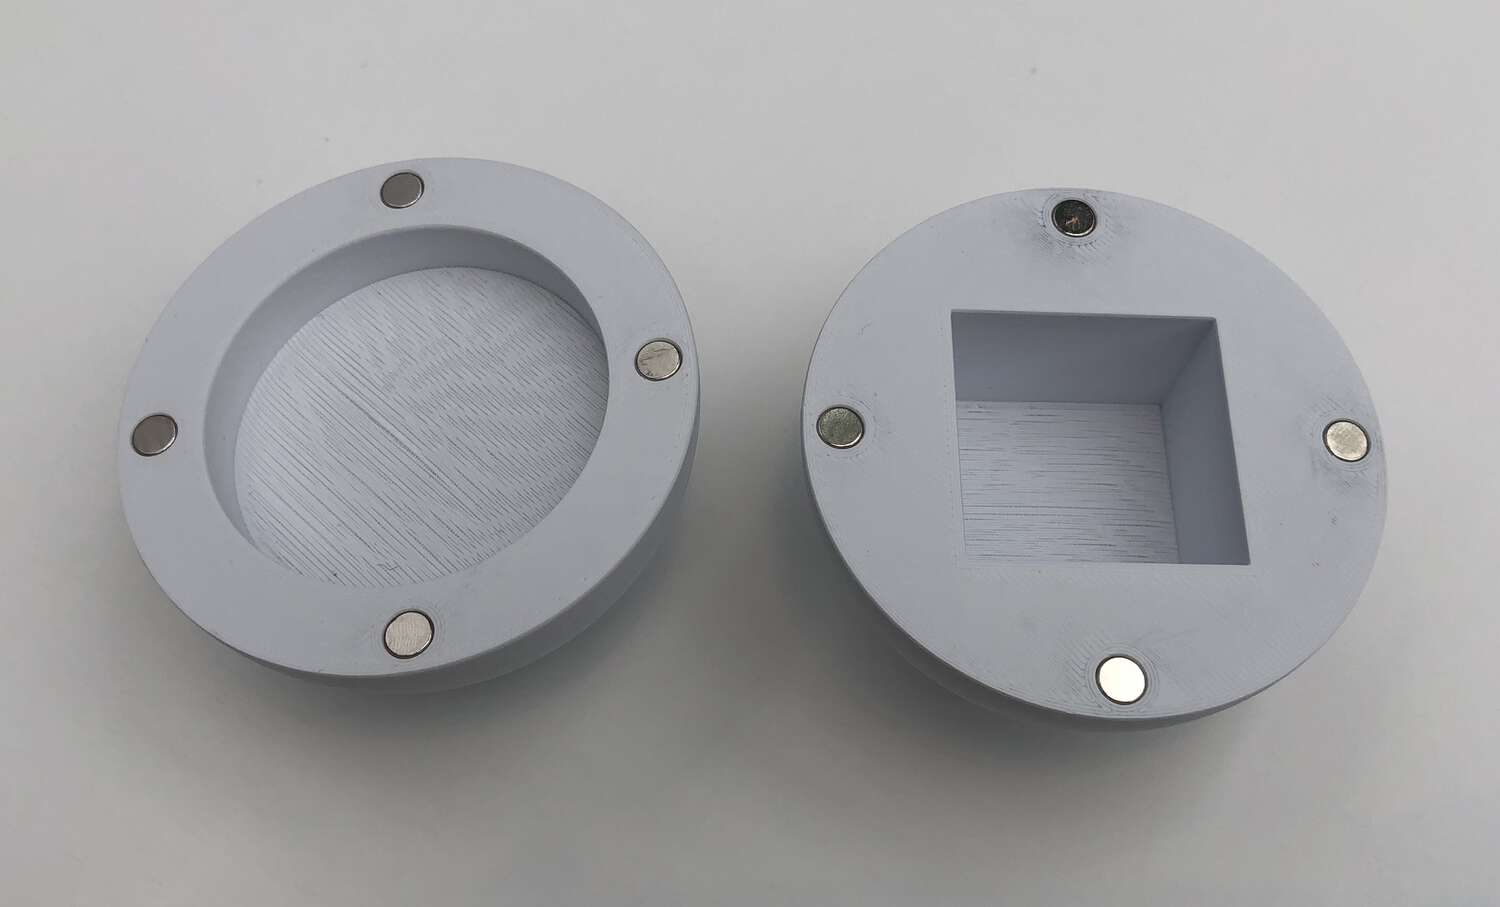
First, my shallow disc ball printed great. The center circle had a diameter of 52mm and I printed it without supports, which means there’s actually a pretty large bridge in the middle I had been anxious about. There was some strand separation in the end but it was really just visual. All that mattered to me was that the surface stayed relatively flat, so I could place my PCB there. I could.
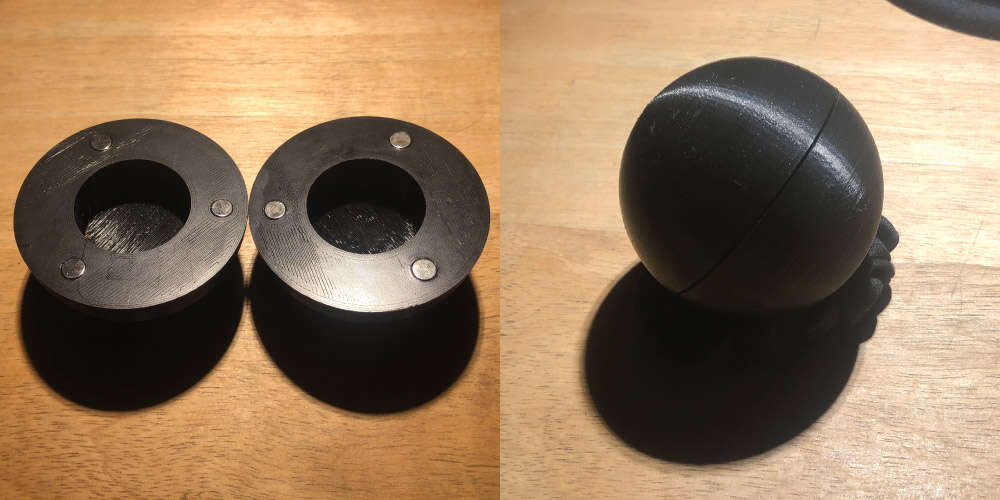
I also figured out a way to press my magnets in slightly more. If you just stack another magnet on top they (obviously) bind really nicely, and that gives you some leverage to push harder when it’s near-but-not-quite flush. With this technique, I was able to push in my magnets far enough that they were slightly depressed on the disc version, and perfectly flush on the square version. So in the end 3.3mm was the way to go for depth, not 3.4mm.
Here’s the pair together:
More importantly, I got a clean mill on my new board, and spent several hours stuffing it. I felt like I was finally getting the hang of soldering, and I’m actually going to miss it! I treated myself to a fresh tip, got my hands on the thin solder, and for the first time ever made heavy use of the microscope during the actual solder.
The RN4871 was tricky as always with those tiny semicircles, but the other parts felt really good. The microscope made it a lot easier to make sure my tip was actually on the joint instead of just near it. I often could see the little shimmer as the surface heated that let me know it was ready for solder, and it was really easy (and satisfying) to see the lead wick its way up the pins.
On one of the sides of my ATtiny 1624, I got the alignment and timing so good that I was able to bang out the pins back-to-back-to-back. I felt like Rob! Here’s the complete package, with and without the mounted accelerometer.
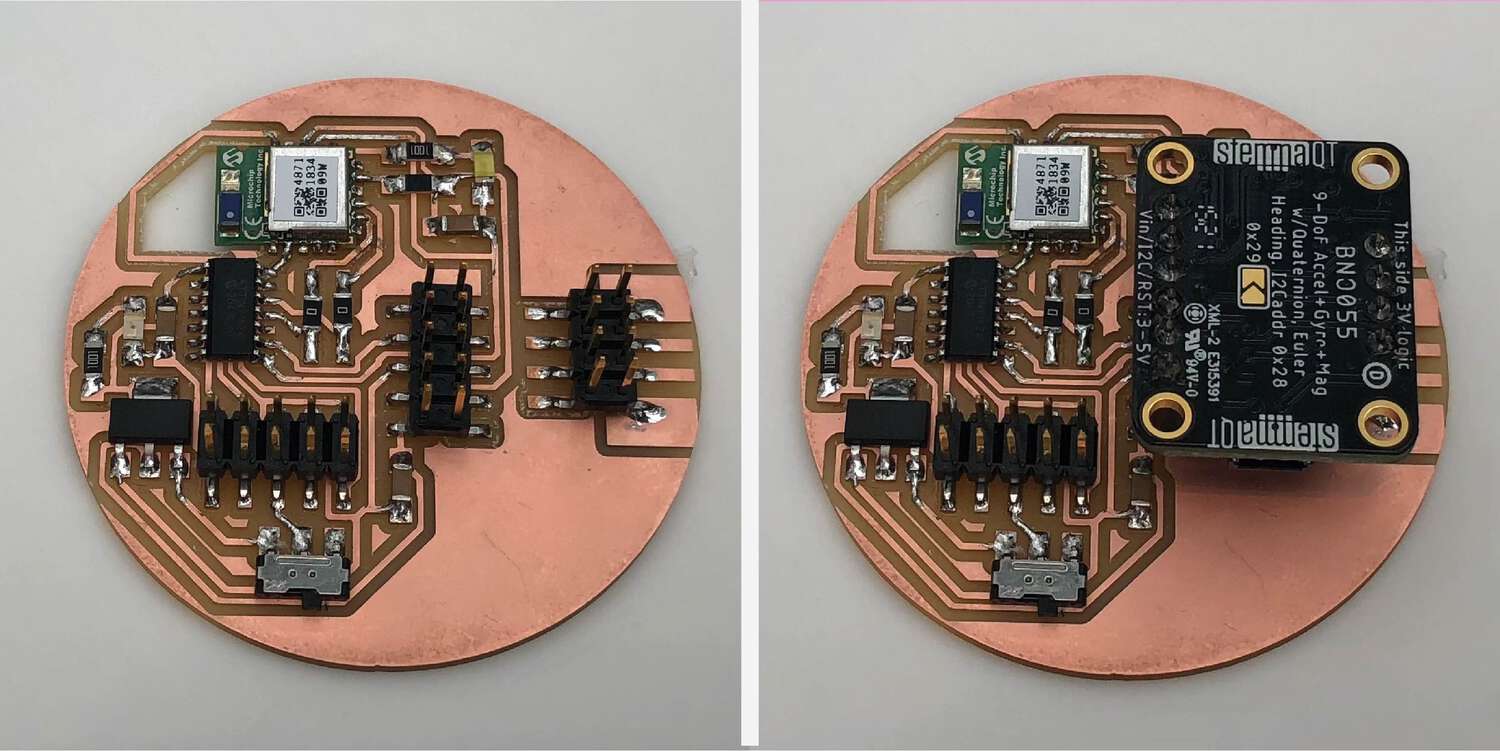
[Ed note: I took these pictures a little after the fact. There are two jump resistors in the middle there. Those were originally four vertical surface pins. This exposed the RX and TX pins of the RN4871, so I could configure and debug it by connecting it directly to my computer. But once I was confident that the component was working consistently I connected it directly to microcontroller Serial1 instead. FWIW, if I’d done that from the start this entire board would have only needed one jump resistor, not two.]
I plugged the whole thing into my computer over FTDI, and was pleased to see that all three lights that were supposed to turn on turned on: Yellow/orange LED for board power (after regulation), white LED for bluetooth broadcasting, and green LED (upside down) for power to the accelerometer board.
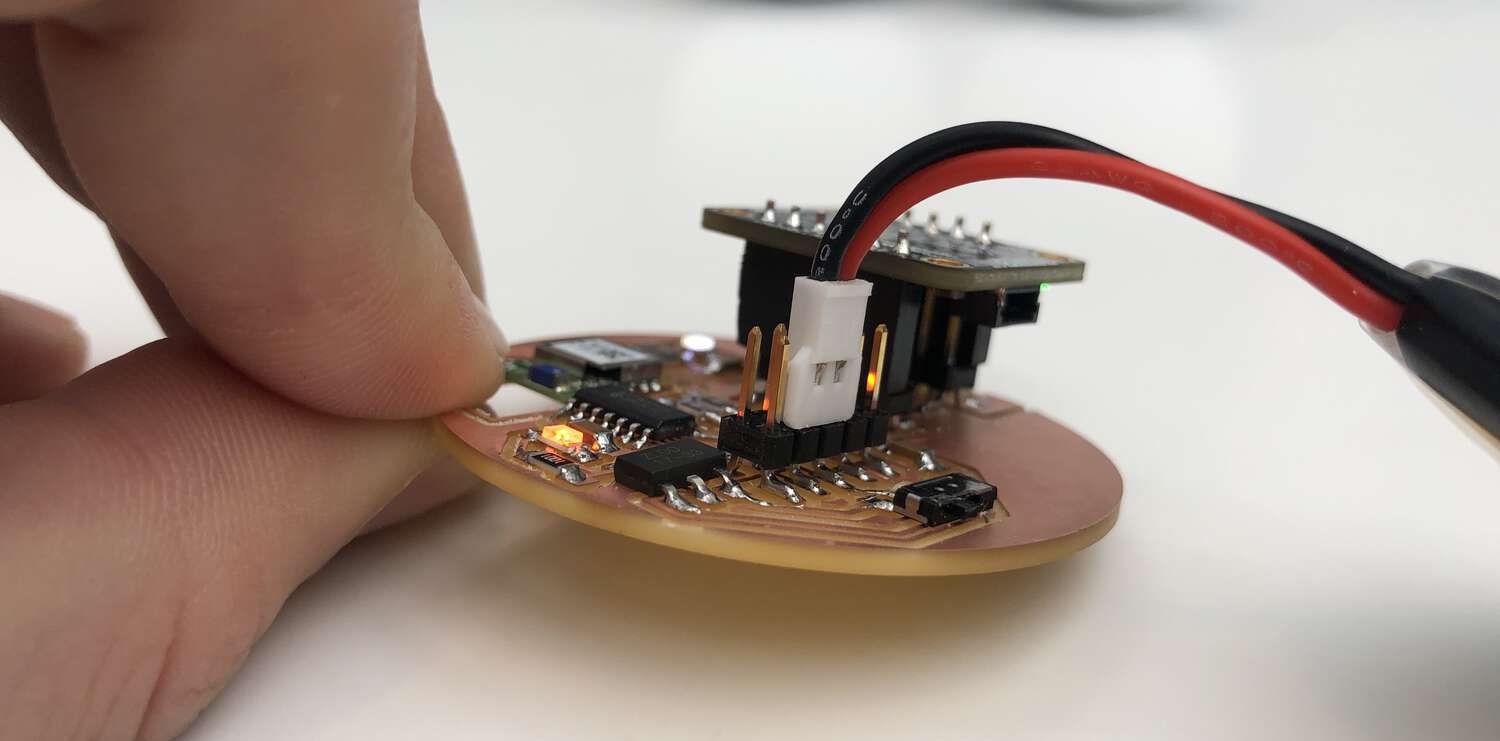
I only made one silly mistake, and it’s not a very important one. The placement of my switch means that it is quite annoying to use, as there is very little space between the board and the bottom of the switch. It’s better if it hangs off the edge. Luckily it’s just as easy to turn the board on and off by connecting and disconnecting it from power.
Finally, I uploaded my code from Week 12 that let me read values from the nine-axis accelerometer. I was happy to see that data was flowing in as expected.
Now was time for the part I was more scared about: Bluetooth. Even though I’d gotten a microcontroller → BLE flow working before, it was literally just to pass one data value before it broke. And there were all sorts of inconsistencies with booting up the BLE chip that were giving me fits.
To start, I plugged my RN4871 directly into my computer over FTDI. I’d intentionally exposed the RN4871 RX/TX pins to make this easier, so I didn’t have to do everything over serial passthrough. Using the configuration commands I worked out in Week 12, I added a custom service with a characteristic that could read/write/notify. The two differences from Week 12 are that I didn’t run that disastrous “SF,1” command that wipes the MAC address, and I actually generated real UUIDs instead of using BS ones.
Once I was happy with the configuration, I plugged the RN4871 into the Serial1 ports of the AtTiny1624, and had the microcontroller pass updating data values that I was able to read on the phone’s BLE scanning app. This is as far as I’d ever gotten with Bluetooth before, but it was working much more consistently. Progress!
But I wasn’t out of the woods yet. My ATtiny 1624 only has 16kb of flash memory. The standalone RN4871 code took up 36% of that. The standalone BNO055 code took up 52% of that. So I was pretty sure that everything was going to fit, but there was always a chance that the compile wouldn’t work quite like I was expecting and it would end up overflowing.
Luckily, it didn’t overflow. It was pretty simple to merge the two scripts, and they compiled to 78% of my flash. I tweaked the value I was pulling to “total spin,” defined as the summed absolute values of the rotational acceleration on the X, Y and Z axes. This was my backup idea I’d come up with during output week, in case I couldn’t get the more complicated parabola calculation working.
if (event->type == SENSOR_TYPE_ROTATION_VECTOR) {
	x = event->gyro.x;
	y = event->gyro.y;
	z = event->gyro.z;
}

double totalSpin = abs(x) + abs(y) + abs(z);
debugSerial.println(totalSpin);
I added a little bit of weirdness towards the very end of my code. I find the sort of hex numbers that BLE passes to be really confusing to parse, while it’s relatively simple to encode and encode hex strings. So I converted the total spin double into a char array, and then used a loop to pack my BLE “payload” with that char array.
// top of code
char payload[20*2 + 1];
const uint16_t handle = 0x72;

// within the loop
String num2String = " ";
num2String += totalSpin;
char outputData[20];
num2String.toCharArray(outputData, 20);

for (int i = 0, j = 0; i < strlen(outputData); ++i, j += 2) {
	sprintf(payload + j, "%02x", outputData[i] & 0xff);
}

rn487xBle.writeLocalCharacteristic(handle,payload);  // top of code
char payload[20*2 + 1];
const uint16_t handle = 0x72;

// in the loop
String num2String = " ";
num2String += totalSpin;
char outputData[20];
num2String.toCharArray(outputData, 20);

for (int i = 0, j = 0; i < strlen(outputData); ++i, j += 2) {
	sprintf(payload + j, "%02x", outputData[i] & 0xff);
}

rn487xBle.writeLocalCharacteristic(handle,payload);
This added a surprising amount to my compile, and I was now up to 90% of my flash. I’m sure there’s a way to handle this much more efficiently, and pass an actual double through BLE instead of strings.
I think I’m going to have to add some sort of physics calculation into my microcontroller code, in order to get the real value that I want. So I might need to simplify my existing code and rely less on libraries to make some space, or just find a clever way of passing the absolute minimum of what I need for the calculation through BLE and let the browser handle the math.
Anyways, that’s all just details. What’s important right now is that it all worked. I was able to passing real accelerometer data to my browser over bluetooth, and my PCB wasn’t plugged into my computer anywhere. This three-partner dance had been such a pain in the ass the previous week, and worked so smoothly on my final board. Which means that (as Neil suspected) my issues were probably in hardware.
So if I had to give advice to future students of HTM(A)A it would be this: Breakout boards are great, but as soon as you know what you want your final board to do, make the final board. You just can’t beat the consistency of the connections within a single PCB vs. all the jenky wiring I’d been doing.
One more electronics challenge to tackle, although not a must-have exactly. My device is going to need to run off a battery. I’d confirmed that a medium-sized (2000 MaH) worked great and was charged, but that’s a larger, heavier battery than what I ideally want, and it barely fits into my design. We had some much smaller LiPos (110 MaH) but these appeared to be totally drained.
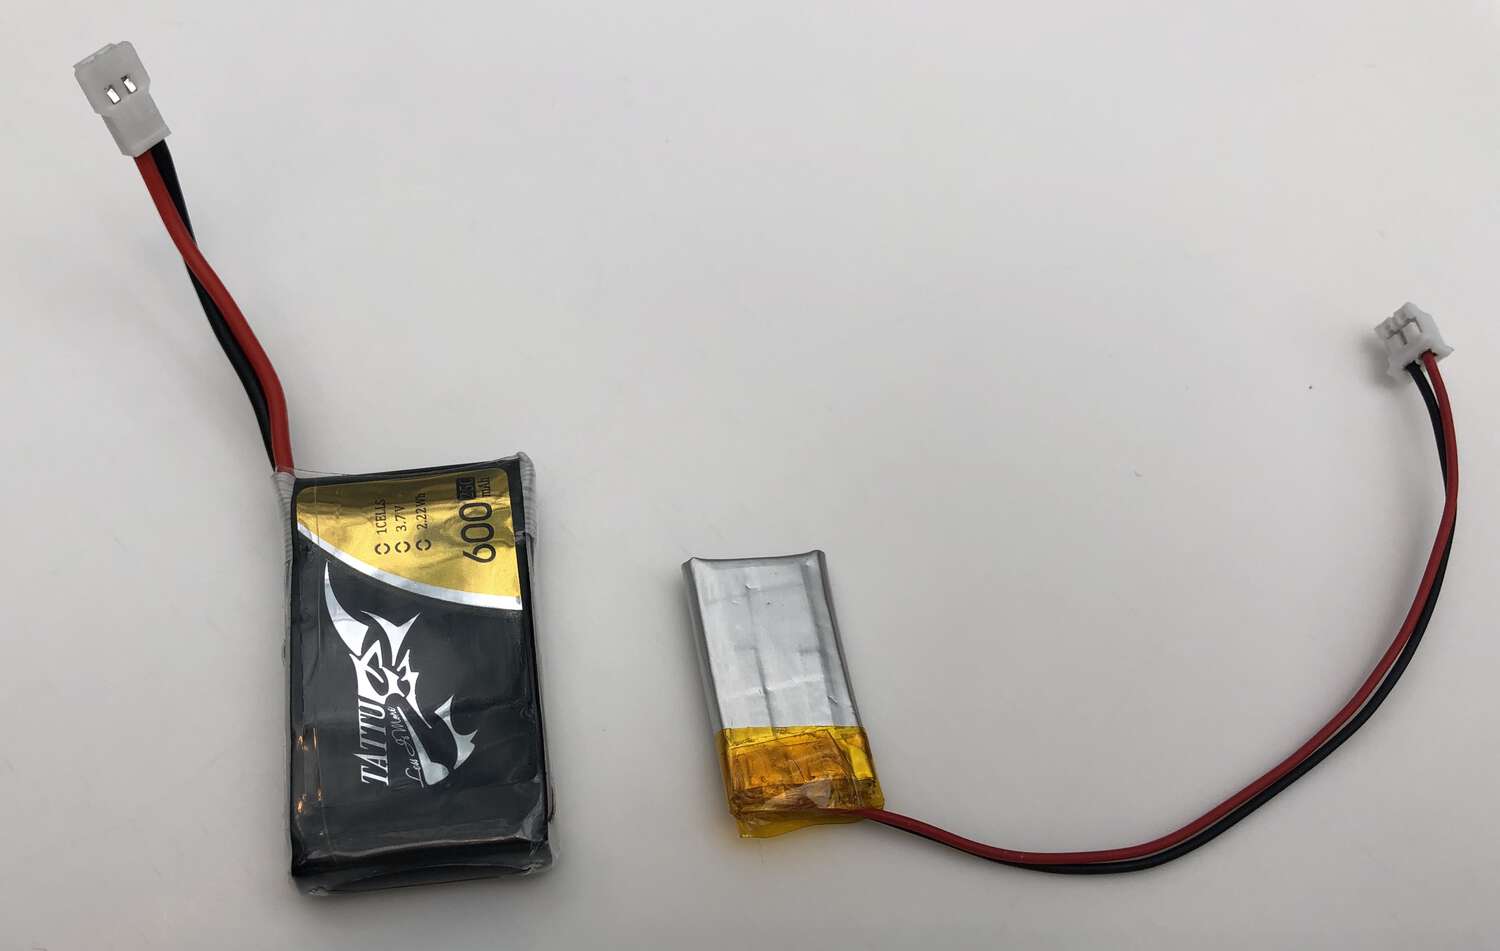
So I built a charger for them. Nathan showed me one of the charging boards, and I built a very simple circuit that connected that board to a micro-usb port and two pins for the battery connector. Here’s the design:
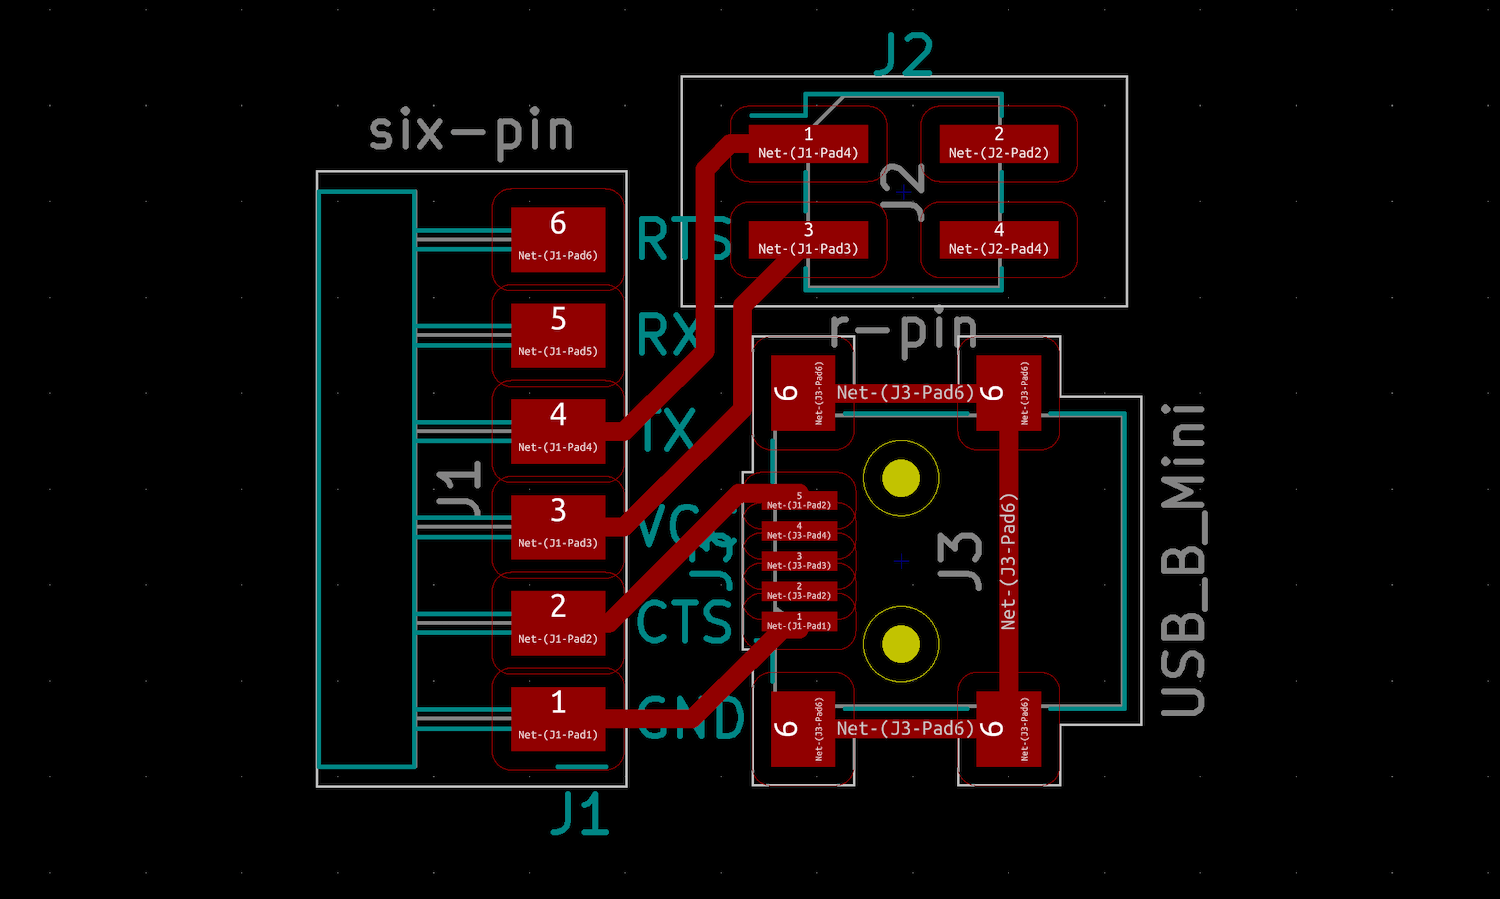
And here it is working. It was fun to get to use the “fill the solder holes” technique for connecting a breakout board to another board.
I gave it 30 min, and then tried my small LiPo again. It had a charge!
Now that the small battery was working, I had all the constraints I needed to print my “final” 3D ball. I knew that the interior of my ball would need to fit the distance from the bottom of my PCB to the top of my accelerometer, which was a little over 17mm. It wasn’t that important for me to have it be super precise in this dimension, so to be on the safe side I created a new ball design with a center depth of 9.5mm per half.
I also dropped the center diameter slightly, and moved the magnets closer to the edge. That left me with a sphere with a diameter of 68 mm instead of 75 mm. Doesn’t sound like a lot, but that’s a 25% reduction in volume.
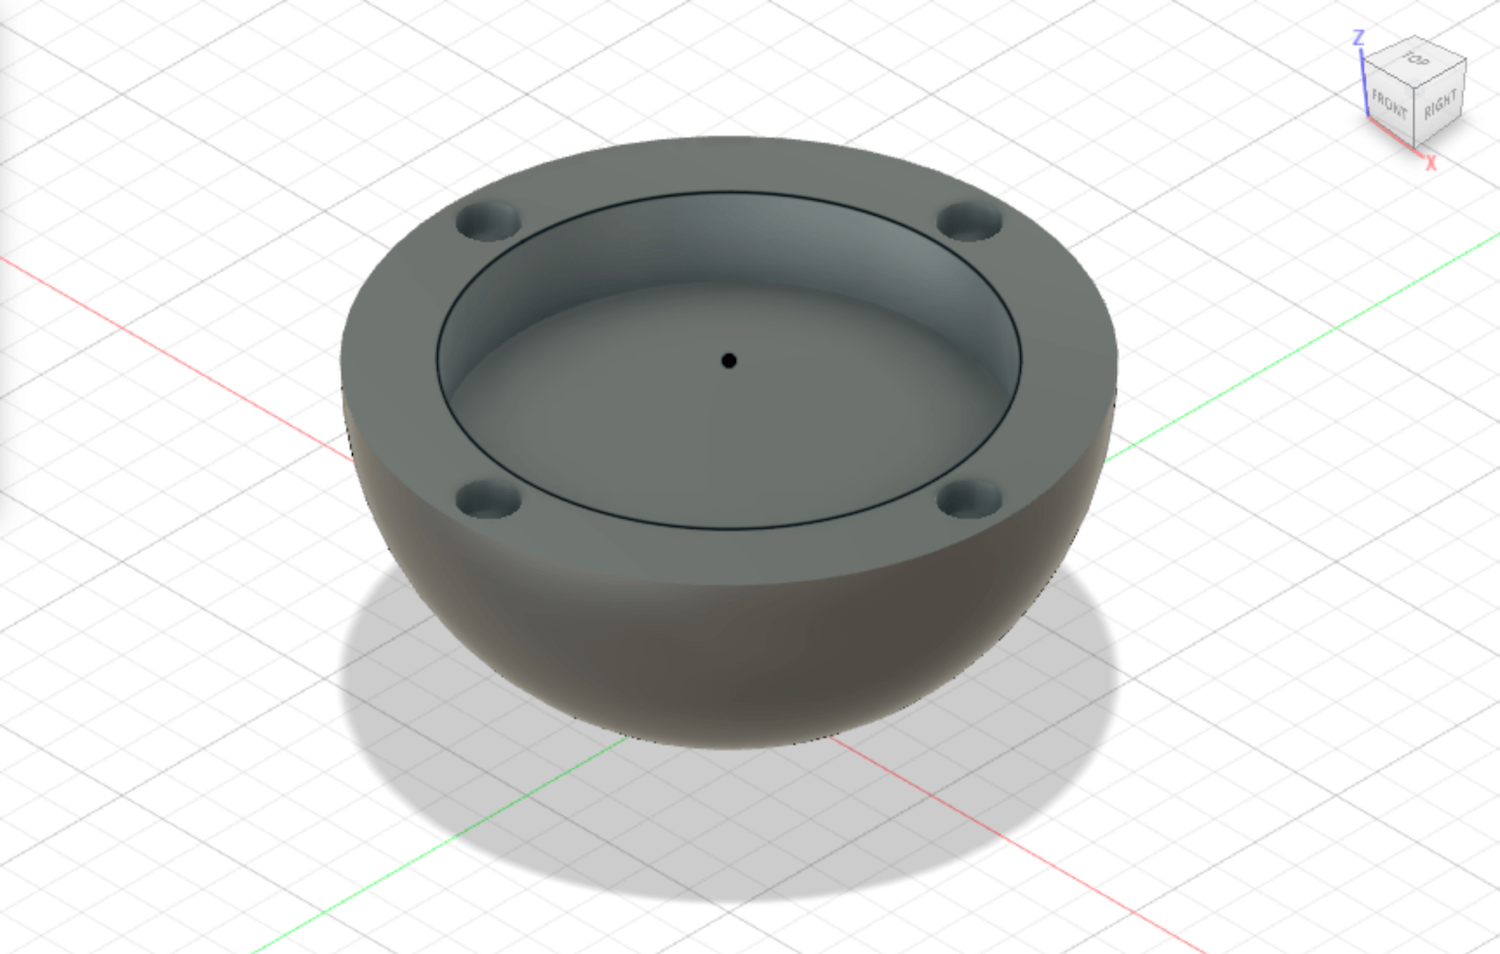
Finally, on Joon’s advice I kept the infill at 10% instead of trying to reduce it further. He thought that <10% would be pushing it, and put me at risk of breaking the ball if I drop it. Which I probably will. So I got two halves of the ball printing – just an eight hour job – and called it a night.
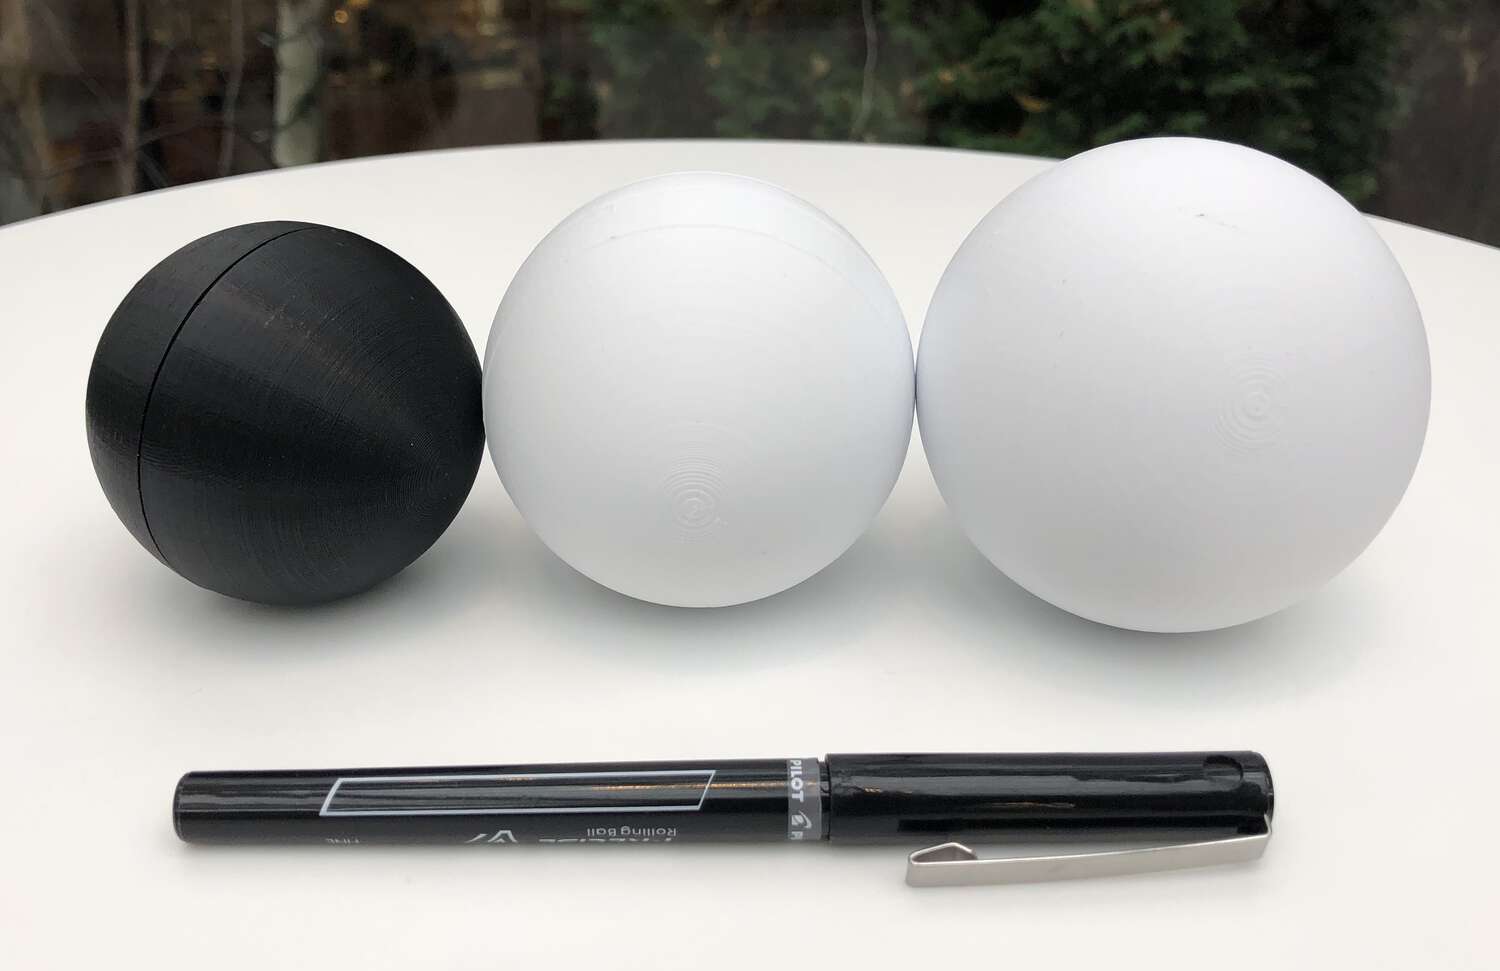
Today I brought it all together. I got to the lab, retrieved my new ball, and pressed in my magnets. It printed pretty well, although there is an artifact “ring” around the outside of the sphere. Not totally sure what caused that. Here’s the size comparison of my very first ball (60mm diam), my current ball (68mm), and my largest design (75mm).
This was the point where heat-gunned out the four-pin connector for exposing RX/TX in the RN487. In its place, I put two jump resistors to directly connect the chip to the microcontroller. This was potentially my final soldering of the entire class. 😔
I placed my PCB (with a little tape on the bottom) in the center of the ball, and it fit quite snugly, maybe more so than I was expecting. I added the charged 110 MaH LiPo battery, and snapped the top on. My complete package.
I’d never actually placed my PCB inside of a ball before, and I was nervous that the embedded magnets would mess with either the bluetooth or the accelerometer. And I also wasn’t sure if the bluetooth would still perform when enclosed entirely by plastic.
Neither turned out to be a problem. Here’s me using the whole thing.
That’s a complete project! Or at least it fulfills the minimal requirements of what I set out to do.
My first thought was that maybe I could have been a little more ambitious, and had something with a more serious motor output. But my second thought was, no, actually. I’m really proud I was able to pull this off, especially in a way that had somewhat thoughtful packaging. If you told me back in Week 2, when I was still struggling with the laser cutter, that I’d been able to make this object myself, I would not have believed you.
Anyways, there are still many ways to incrementally improve it. I spent the rest of the day documenting and plotting my next steps. I’d made a Trello board to help sort of my last week of work, and here’s where it now stood.
To celebrate getting to v1, here are the files I’m using at this point.
Didn’t have much time today, and I wasn’t able to get to the lab. So I decided to spend part of my evening improving the front-end interface of my project. There were four main areas that I covered, plus a bunch of small style tweaks.
Meaningful x-axes
In my original interface design the x-axis was kind of fake. It’s just the index, so the hundredth data point will be in position 100. It would be better for that axis to represent time, i.e. how many seconds have elapsed since you started recording. The function to get the time in Javascript (which we have to call each time the chart draws) comes with some cost, so switching to this “real” axis actually causes my data to be a bit bumpier than before.
I’ll have to decide if it’s actually worth it. It’s possible I’ll switch back to the indexed version. Since the chart draws in real time both versions mostly end up looking the same.
Improved UI
Using Bluetooth in the browser is a little messy. You need to opt-in twice: Once to connect to the device, and a second time to enable the “notifications” mode that will allow me to actually stream data from my device to the computer. I cleaned up the design, added some messaging, and added some state and pulse animations to the buttons to make it clearer to a user what they have to do to make the charts show up.
Better y-axis scaling
My design creates multiple charts as the data “wraps” to a new line. Originally these charts all had different y-axis ranges, but ideally they would be on the same range.
This isn’t so simple in my current setup: To draw this much data without a lag, once you’ve “wrapped” to a new chart, the previous charts are never redrawn, so the y-axis range can’t be dynamically updated across the entire page. (We could do it by targeting and redrawing specific charts uppage, but it would add a lot of complication and a performance hit.)
But I thought of a simple solution that gets me 90% of the way there. The y-axis max for a new chart is now determined by the max across all the data up to that point, not just the data in the current chart, plus I’m setting a minimum value so that the first couple charts don’t end up with a much smaller range. To the chart axes can still differ, but quite quickly they’ll all start looking more or less the same.
Basic screenshot
One of my goals from the very beginning was to make the final chart screenshot-able, so you’re left with a piece of art that reflects the path of your ball.
This is actually a pain in the ass. It is not simple to render a screenshot of an entire page in Javascript. The best option is generally the getDisplayMedia API, which is the same API that lets you share your Chrome screen on Zoom. But that does a very good job of capturing what’s in the viewport, and a much worse job capturing a full browser tab (which includes offscreen content.)
The solution was a library called html2canvas, which has been around for a while. This takes your entire webpage and shoves it in a canvas element, and then converts that element to image data using base 64 image encoding. Then I pop a new window open that contains that image. Here’s all the code it takes to run that, although the library you’re loading is quite heavy.
html2canvas(document.body).then(canvas => {
	let img = canvas.toDataURL("image/png");
	window.open().document.write("<img src="' + canvas.toDataURL() + '" /">);
});
The big problem with html2canvas is that it’s actually creating a screenshot off of the DOM, not the pixels that are displayed on the page. So style stuff can get really funky, in particular fonts. Update Dec. 13: Turns out the fonts work fine on production, just not from a local server.
Next steps
I also thought a bit harder about what I actually want to prioritize for my “v2” before Monday’s presentation. I don’t think I’m going to get to a v3, and I’ve decided that I’m actually pretty happy with the 3d-printed version of my ball with press fit magnets. I’d rather spend time improving my packaging and making a nice video than trying to tackle molding and casting all over again.
So that leaves me with the following priorities. V2 must haves:
V2 nice-to-haves:
In the lab today I knocked out the two simple hardware improvements. First, I used 400-grain sandpaper to smooth out to the outside of my ball. This turned out to be pretty quick and easy. You can’t really tell from the picture, but just a little bit of sandpapering made it feel so much smoother in my hands, and so much less like a 3D print.
Second, I used some stick-on velcro we had in the lab to affix my LiPo battery to the top half of my ball interior. Overall I was left with what I would call a nicely packaged project!
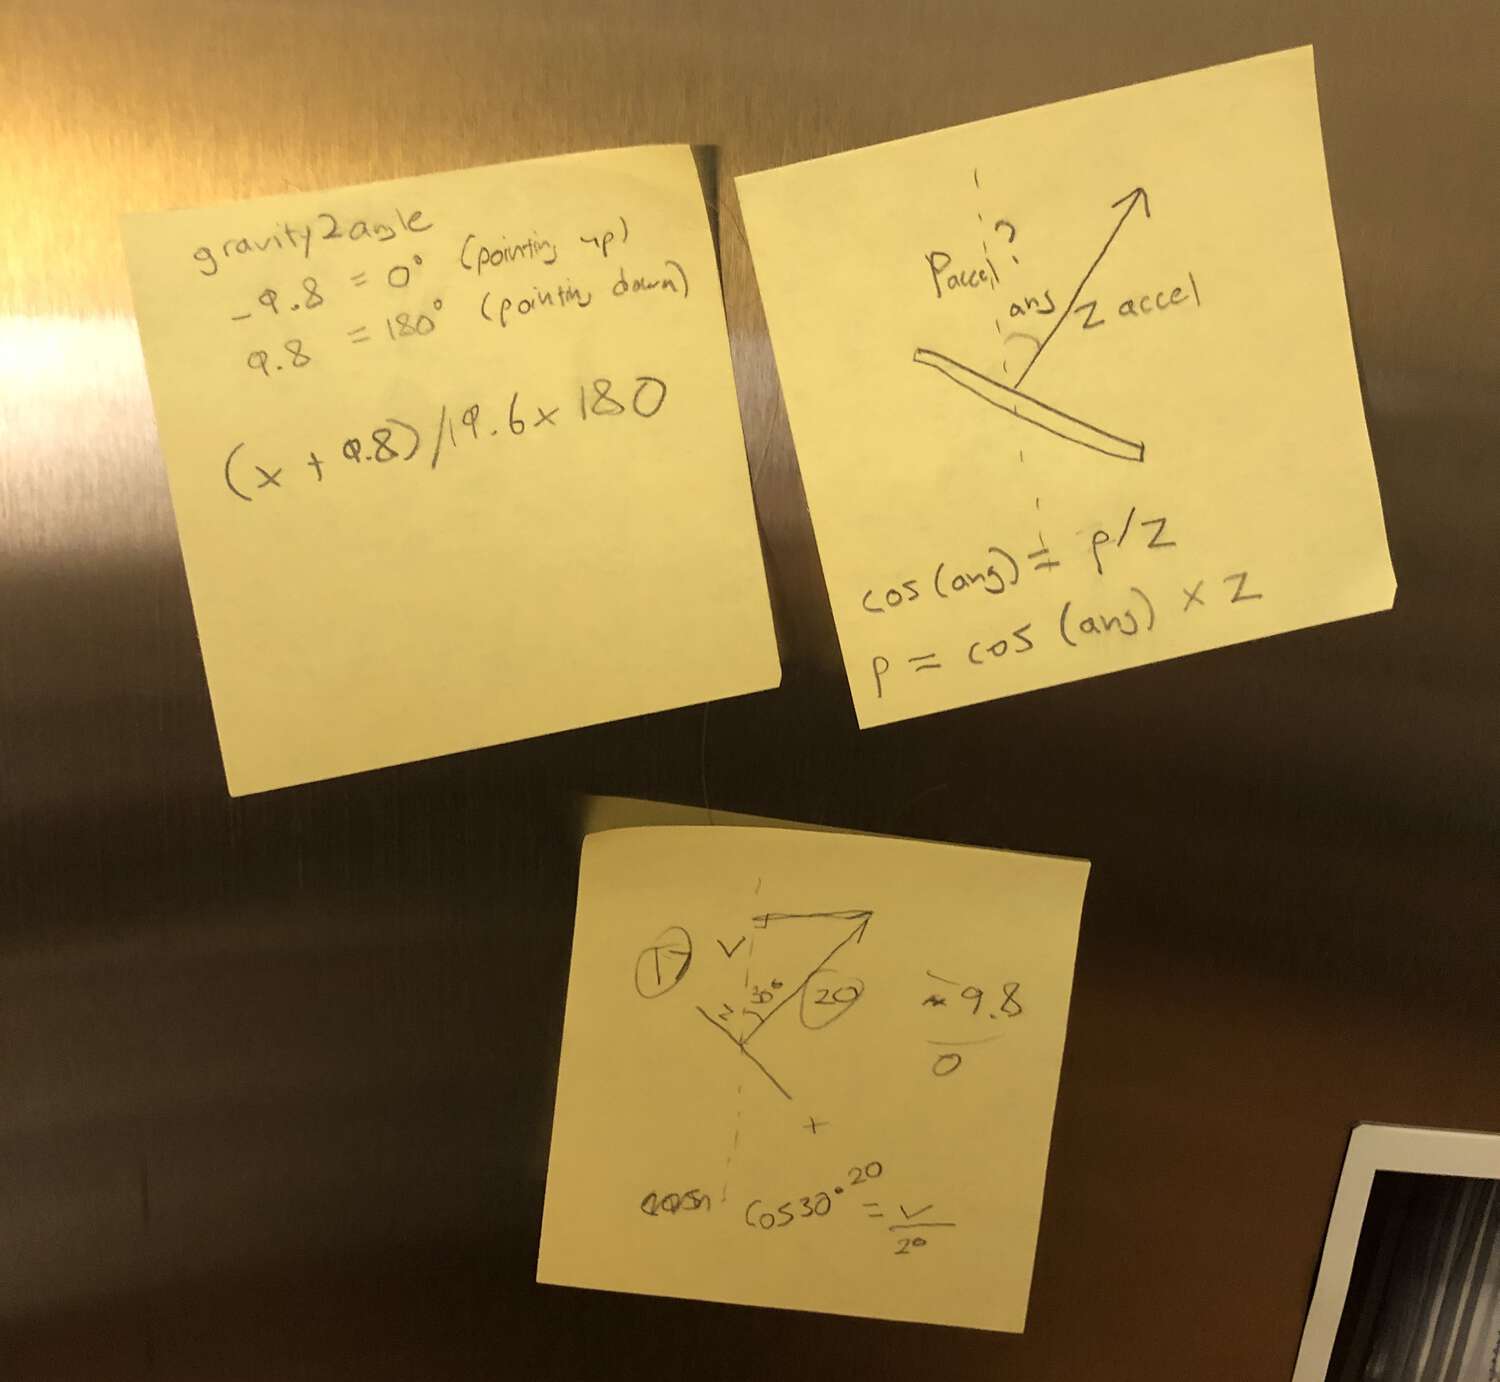
Meanwhile, I started thinking about the trig I’d need to values that would let me make some more complex charts. Specifically, I was on the hunt for “vertical acceleration,” which is the acceleration perpendicular to ground. Here was my back-of-envelope math for how to get it.
If I had this value, I could attempt one-dimensional dead reckoning. Integrate vertical acceleration into vertical velocity, and then integrate velocity into position. Tons of people try this with accelerometers and everyone says it’s a horrible idea, but I was going to learn for myself!
I’d knocked out my big hardware tasks, so from here on out it was all software. This was pretty frustrating! I got a much better sense of what my BNO005 could and (more importantly) couldn’t do.
First I had to access orientation data, which I hadn’t really used before. These are the pitch, roll and yaw measurements (I need pitch), and I can access these values directly by calling an orientation event like so.
sensors_event_t orientationData;
bno.getEvent(&orientationData, Adafruit_BNO055::VECTOR_EULER);
But when I was testing this out, I found that my pitch reading produced weird values when my device was turned 90°. A little Googling revealed that this was a real problem called gimbal lock, which could be solved by approaching 3D orientation with something called a “quaternion” number system.
Obviously I’m way over my head, physics-wise. But it turns out that I could get the result I wanted in just a couple lines of code. This calculates orientation as a quaternion and then converts it to Euler for output.
imu::Quaternion quat = bno.getQuat();
imu::Vector<3> euler = quat.toEuler();
This is the sort of functionality that makes the BNO005 such an expensive accelerometer, and it produced pitch readings that were free from gimbal lock. Then with a little bit of math, I was able to calculate vertical acceleration based on pitch and z acceleration.
imu::Quaternion quat = bno.getQuat();
imu::Vector<3> euler = quat.toEuler();
imu::Vector<3> accel = bno.getVector(Adafruit_BNO055::VECTOR_LINEARACCEL);
Serial.println(accel.z()*cos(euler.z()));
Here’s the problem. When my ball is sideways, the z acceleration while it’s being tossed upwards is basically zero. So even though I’m adjusting for pitch, I’m still getting garbage estimates depending on how my ball is oriented.
I should be able to use X and Y acceleration to calculate alternative estimates of vertical acceleration, and then merge all three to get the best estimate at any given orientation. But that’s a problem for tomorrow.
A long and half-satisfying day. Apologies for the long writeup.
I gave up on calculating that more complicated “vertical acceleration” figure. I wasn’t able to figure out how to use X and Y acceleration to provide secondary estimates when my device was tilted, and I also revealed how little I know about physics by pronouncing Euler angles as “Yooler” angles in front of other people. (Turns out it’s more like “Oiler.”)
This means no double integration for position. Instead, I’m just going to calculate the magnitudes of the X, Y and Z accelerations combined, which has the benefit of being totally independent of the orientation of the ball. So a single sensor value looked like this.
double x = event->acceleration.x;
double y = event->acceleration.y;
double z = event->acceleration.z;
double accel = sqrt(pow(x,2) + pow(y,2) + pow(z,2));
This means that, sadly, my final project no longer takes advantage of all the cool properties of a nine-axis accelerometer. Technically I’m using linear acceleration (acceleration minus gravity), which you need gravity detection to pull off. But I think regular acceleration would work about as well, so this could have been done with a cheaper three-axis accelerometer.
Once I had this new value streaming over bluetooth, I got to work on improving my visualization. As a reminder, here’s where I was starting. I’m plotting the acceleration values directly, with some line smoothing.
Obviously these arcs don’t look like a ball getting thrown at all. A single toss can have multiple maxima, which doesn’t make any sense. It’s just a peculiarity of plotting noisey accelerometer data directly.
My plan early on, before I thought I might be able to pull off position via integration, was to simply draw parabolas. After all. once you toss a ball in the air, there’s only one type of path it can follow (ignoring air resistance.) The equation for the y position of an object tossed directly upwards from height zero is quite simple:
y = -16 * time^2 + initial_velocity * time
From here it was just Javascript Javascript Javascript. It would be very boring to explain all the details on how this worked, but the basic flow was that when a high acceleration value showed up over bluetooth (a “toss”), it triggered a loop where a parabola would start to draw based on the initial acceleration value and time, until the line returned to zero (breaking the loop). In this code rewrite, I also figured out a way to handle realistic time on the x-axis without having to call the slow Date.now() function over and over again.
If the program wasn’t in the parabola loop, it simply advanced time and added a zero to the chart. Getting the passage of time correct was a real pain, but eventually with lots of futzing with constants I was producing charts that looked like this. Much better.
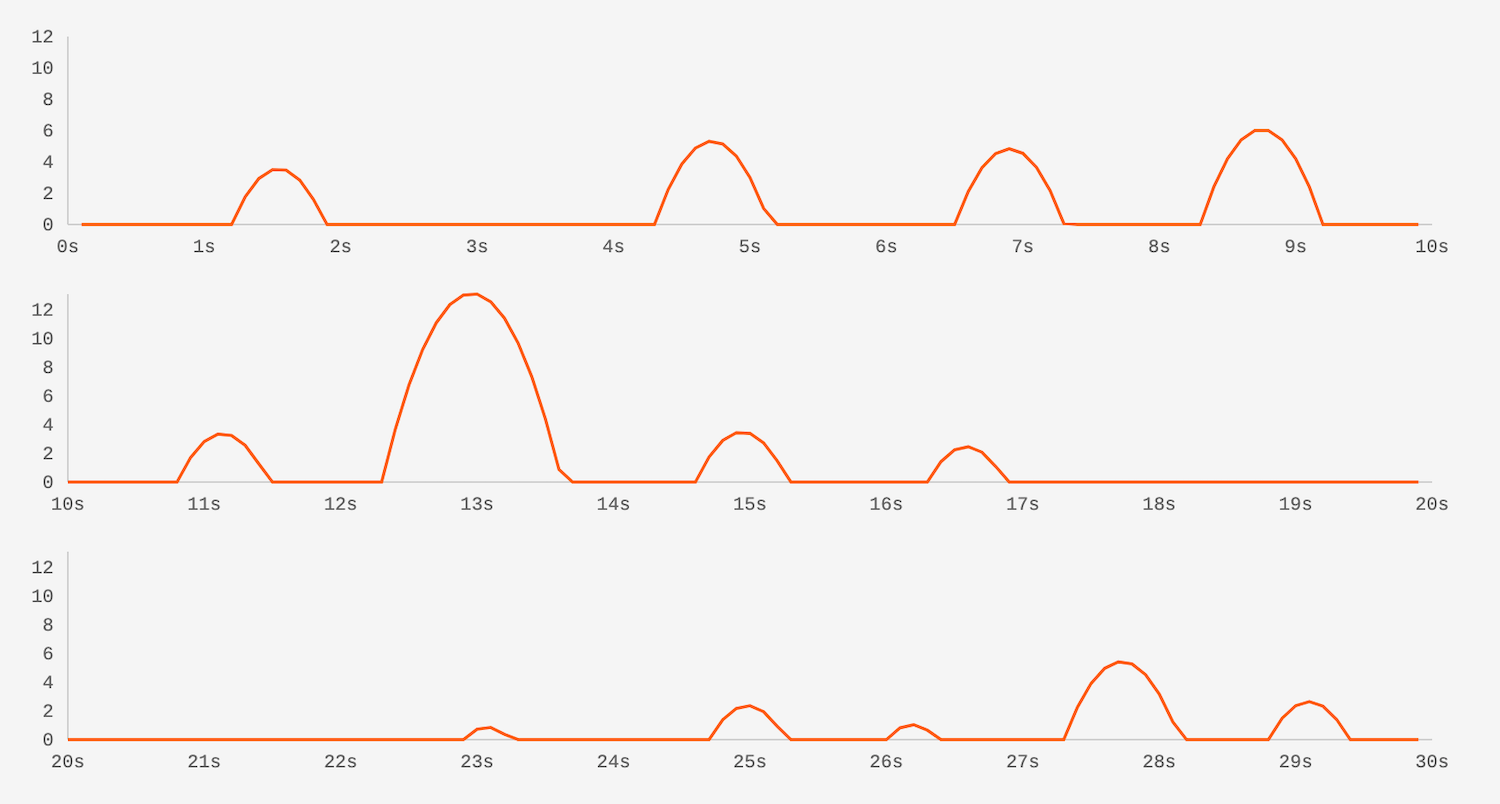
There was just one big problem remaining: My signal processing sucked. The timing of my arcs was working great, but the magnitude was off. Throwing the ball up harder wouldn’t consistently produce a larger parabola.
I had a theory of why this was happening. I read online that I shouldn’t send updated values through the RN4871 faster than every 100ms. So I was just taking an accelerometer reading every 100ms, and then sending that. Throwing a ball in the air is a surprisingly fast and violent act, and a lot can happen in 100ms. So my theory was that the data reading was super dependent on which part of the throw was captured, which could cause a lot of inconsistency.
My accelerometer can make readers much faster than every 100ms. 10ms is safe. So I tried two things out: Pulling 10 values within 100ms and sending the max across BLE, and taking the average of those values and sending it across BLE.
Here’s how that comparison looked. Max = green, avg = red, last value (my original setup) = blue.
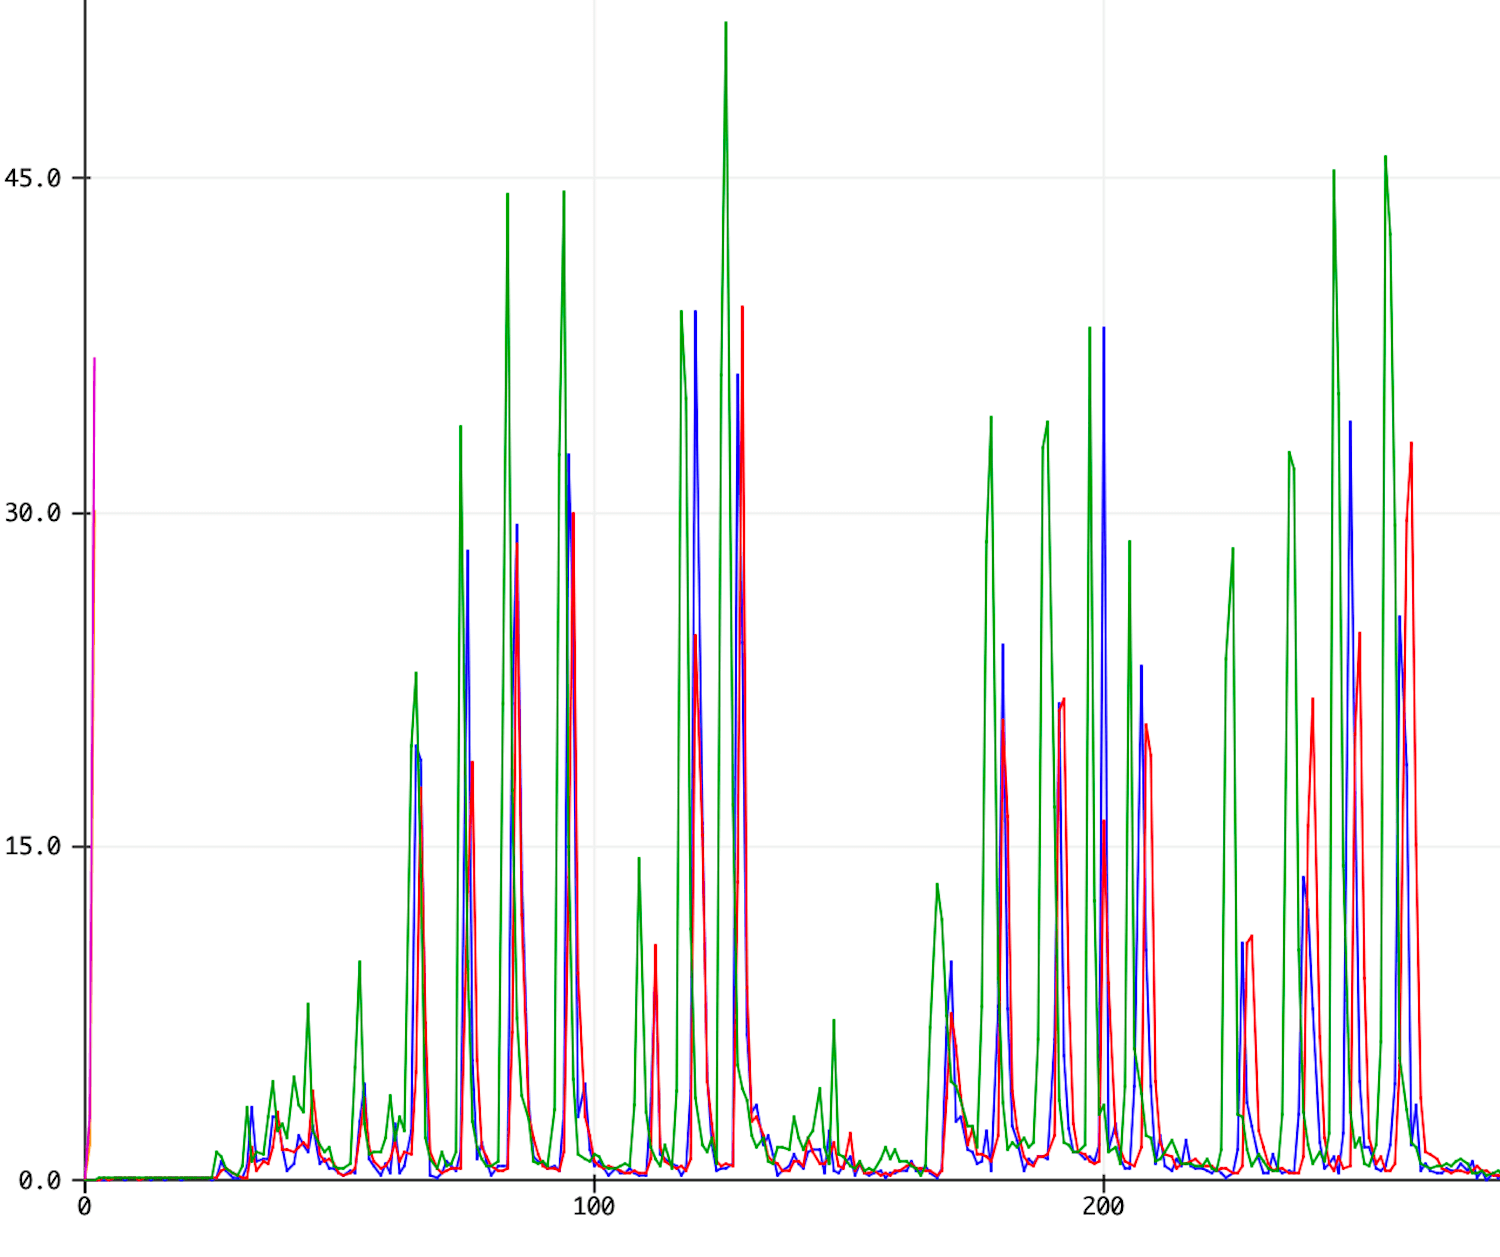
As you can see, both max and average “stepped up” pretty consistently as I put more oomph into the ball, while the blue line is a lot messier. I decided to try both options, actually tossing the Bluetooth-enabled ball instead of reading values over serial.
The max worked pretty well, definitely better than the version I had working before. But it had a funny quality that reminded me of what value I was actually measuring. A throw with a short burst of acceleration would generate a high value, even if the ball didn’t go very high. For anyone who’s played baseball or tennis or Wii sports, that meant that getting a high arc was “all in the wrists.”
Using the average value was less jumpy in this way, but it was also less consistent. It was much easier to get a “miss” – a fairly large throw that registered too small on the screen.
I had one other thought, which was basically to blend the two. For ten 10ms readings, find the acceleration values that were over some threshold, and average those together. This would be less sensitive to the very highest acceleration compared to the max value,
Here’s how that looked. Max = green, avg = red, blend = blue.
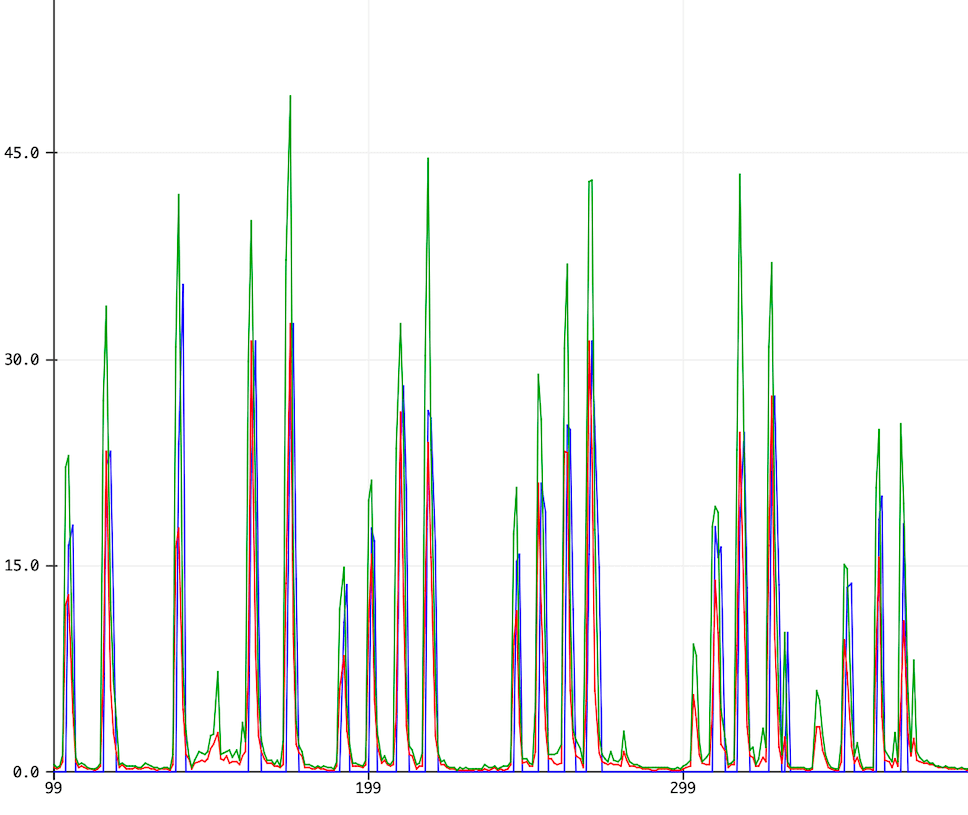
As you might expect, the blend ends up between the max and the average. Over bluetooth, it felt like it worked slightly better than the other two options but, frankly, I was still getting occasional misses, and the height of the arc was still really dependent on wrist action.
So progress, but haven’t solved this yet. And that’s where I called it a night.
I solved my signal processing problem! After thinking about it more in the morning, I realized that the solution was to free myself from the yoke of the 100ms cadence.
The max/avg/blend solutions were all still looking at data within 100ms windows, because that’s how often I sent data over bluetooth. If the acceleration event happened to cross two windows, the device would get confused, no matter which metric I was using.
A better framework was to send a message over bluetooth only when I detected a toss. That meant I could take a longer running average, I found that 25 samples at 10ms worked nicely. I used code from this explainer. Here’s how that looked compared to the raw values.
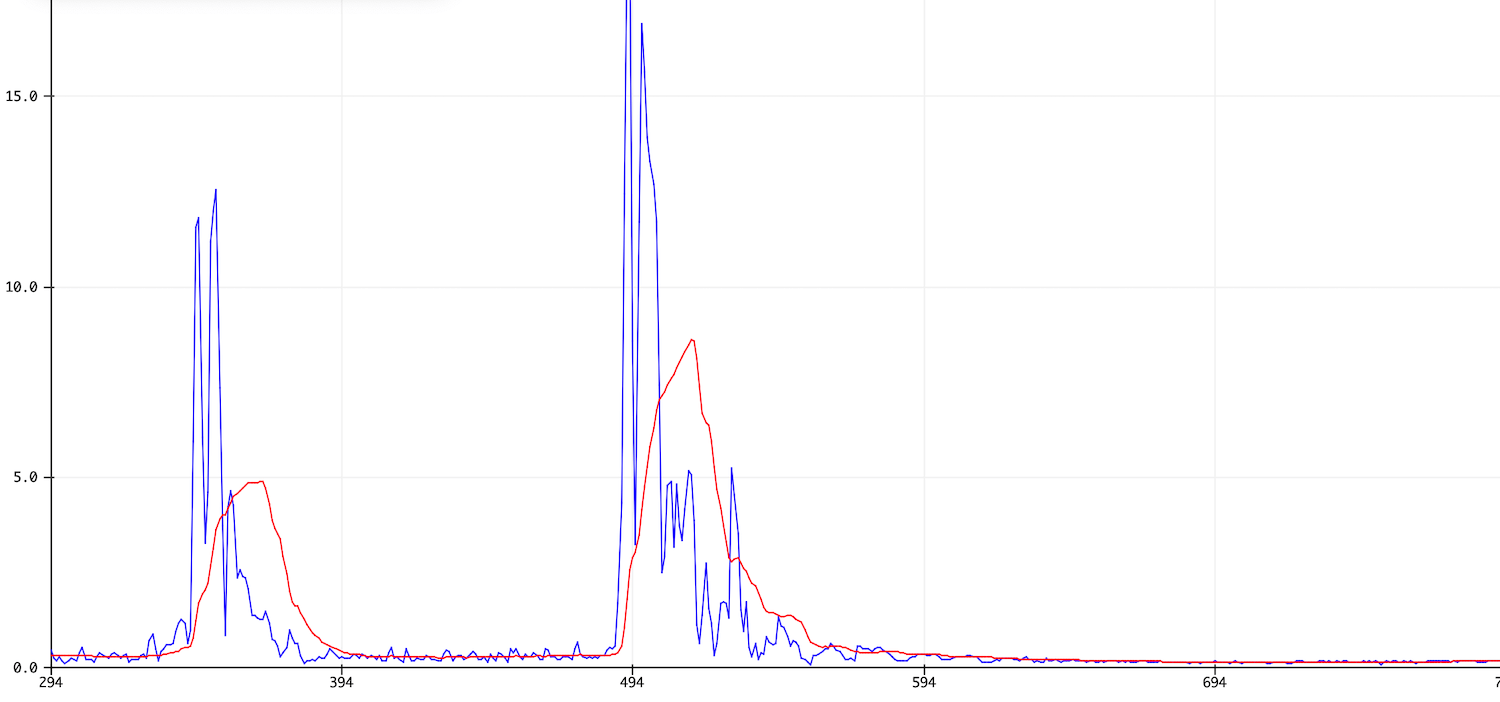
Pretty nice! The next task was to detect peaks within those moving averages. As a toss happens, the peak value gets overwritten, and then when the moving average falls below a certain threshold the winning peak gets sent over bluetooth.
This adds a lag between the backend and frontend, but it’s nice and safe. If for whatever reason the moving average has multiple maxima within the same toss, only the highest value will get sent. I also added a check to make sure that two tosses weren’t recorded within the same 100ms interval, which could overload the RN4871.
You can see my complete code at the bottom of the page, which used up 84% of my 1624’s flash memory. Didn’t even cut it that close in the end. Here’s my new result, although the video at the top of the page better shows that the arcs matched the (relative) strength of the toss.
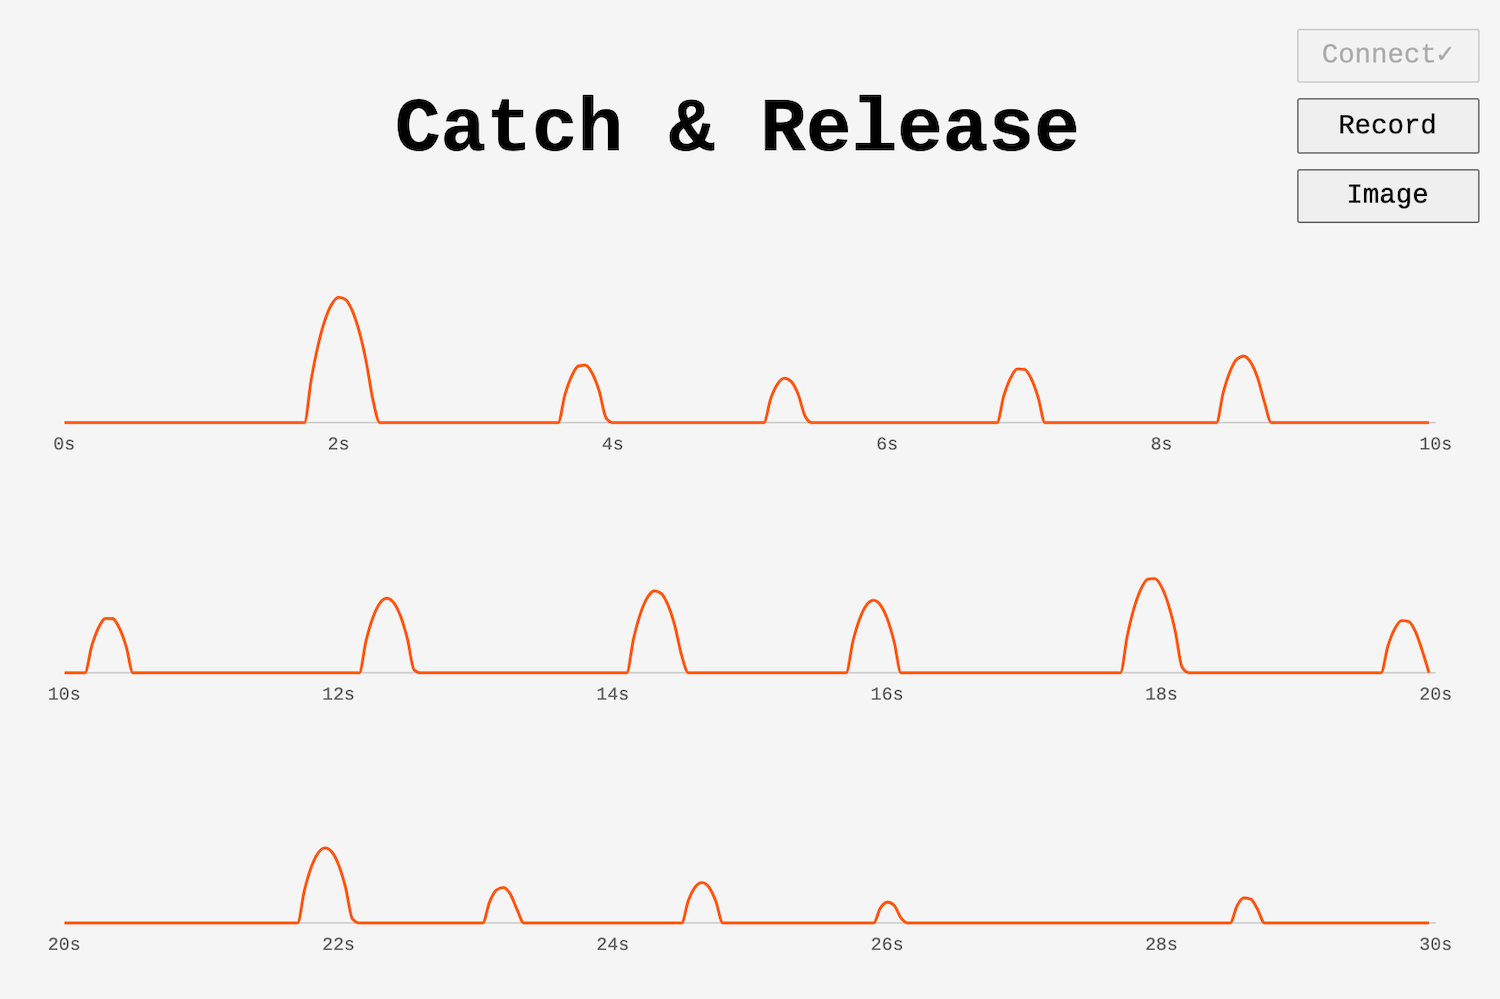
This setup had two other advantages. It meant I didn’t have to push my RN4871 so hard. Instead of sending a value every 100ms no matter what, I only send peak events. This is a lot less bluetooth traffic.
The second advantage was that my Javascript, which I had to reconfigure a bit, was also free from the 100ms cadence. That meant I could redraw my chart every 50ms instead. This creates a much smoother animation, jumping from 10 to 20 frames per second.
In the lab, I did a couple wrap up tasks. I made sure that my LiPo battery and backup battery were fully charged. I swapped in a cleaner velcro cut to attach that battery, and made sure my PCB was securely adhered.
Most importantly, I checked off one of my nice-to-haves and employed a subtractive process by using the vinyl cutting to affix some branding to the inside of my ball.
I spent the evening shooting a video of the project in action. My wife edited, and I am very lucky she is a documentary journalist. I actually have no idea how people manage to pull off a nice video at the very end of this whole process if they don’t have those skills already. Although I bet people younger than me have a lot more practice making short videos!
I also finished up this documentation, and that was that. Presentation day tomorrow. Here are my final files.
My presentation went great. Here’s a video of me doing my thing.
Unfortunately, during open house my ball did get dropped and it broke. Specifically, the traces on the vertical pins holding my accelerometer got ripped off. But otherwise a great day.
I felt sad that I’d worked all semester and didn’t have anything phyiscal to show for it, so over winter break I decided to fix my ball and make it a little more drop-proof. I made a new ball and a new PCB, and it also gave me a chance to make a couple adjustments I’d thought up. Here were all the changes:
I also fixed my LiPo charger, which someone had busted by plugging a battery in backwards. It was really satisfying to upload all the code I’d already written and have a totally new device work right off the bat!
There was one other new complication, which I’m not going to fix. Like Neil predicted, the Bluetooth API for chrome changed a bit. Specifically, it is now only available when a site is served over HTTPS. Most sites have this level of security nowadays, but alas fab.cba.mit.edu does not. And that’s where my interface page is located at the moment. If I decide it’s important enough, I can always move it to my personal site, but for now to show off my ball I can just spin up a localhost server.