Final Project
Description of the final project
For my final project, I am building a product called ‘ClassRate’. ClassRate is a product that allows for interactive learning and real time feedback for the professor. It is common for students not to speak up in lectures for fear of ‘sounding stupid’ or because they worry that they are falling behind. ClassRate solves these problems by allowing anonymous real time feedback from students. ClassRate consists of a ‘Rating Box’ and a web application. Each student receives a physical ‘Rating Box’. The Rating Box has a dial that can be turned. When the dial is at the middle setting, the lecture is going at a perfect rate. If the dial is turned to be at a high setting, this means that the professor is going to fast or he/she is not explaining a concept well and the student is confused. If the dial is at a low setting, the student thinks that the material is easy and the professor is going slow, and he/she might be getting bored. Each student will adjust the dial on the Rating Box however they want whenever they want during the lecture.
ClassRate takes the average rating from all of the students every second and displays a graph over time of the rating of the lecture. If the average rating is very high (indicating that a lot of people are not understanding what the professor is saying), then an alert sign will pop up on the web application, so that the professor knows and can adjust and maybe explain a concept again.
A physical Rating Box is ideal for lectures, because if this were an iPhone app, then having their phones out all of the time would distract a lot of people. That would be an intrusive app. However, the Rating Box is conveniently always there, and simple to use – just turn the dial whenever you think there is a change in the complexity of the lecture.
For the MVP of the product, these are the steps I need to take:
- Create an input device with a potentiometer
- Read the output and display it in an interface
- Create an output device that shows what the current reading is
- 3D print a box to place the circuit and potentiometer
- Connect all these pieces together
If I have more time, I will improve it by:
- Creating multiple ‘Rating Boxes’
- Improving the user experience of the web application
- ‘Prettify’ the 3D boxes
This final project includes:
- Computer-Aided Design
- Computer Controlled Cutting
- Electronics Production
- 3D Printing and Scanning
- Electronics Design
- Computer Controlled Machining
- Embedded Programming
- Molding and Casting
- Input Devices
- Output Devices
- Interface and Application Programming
- Networking and Communications
Designing the Final Project
I created some designs for the final project. The ClassRate product consists of two parts: 1. a web application 2. The potentiometers for the studets. Below are the designs I created.
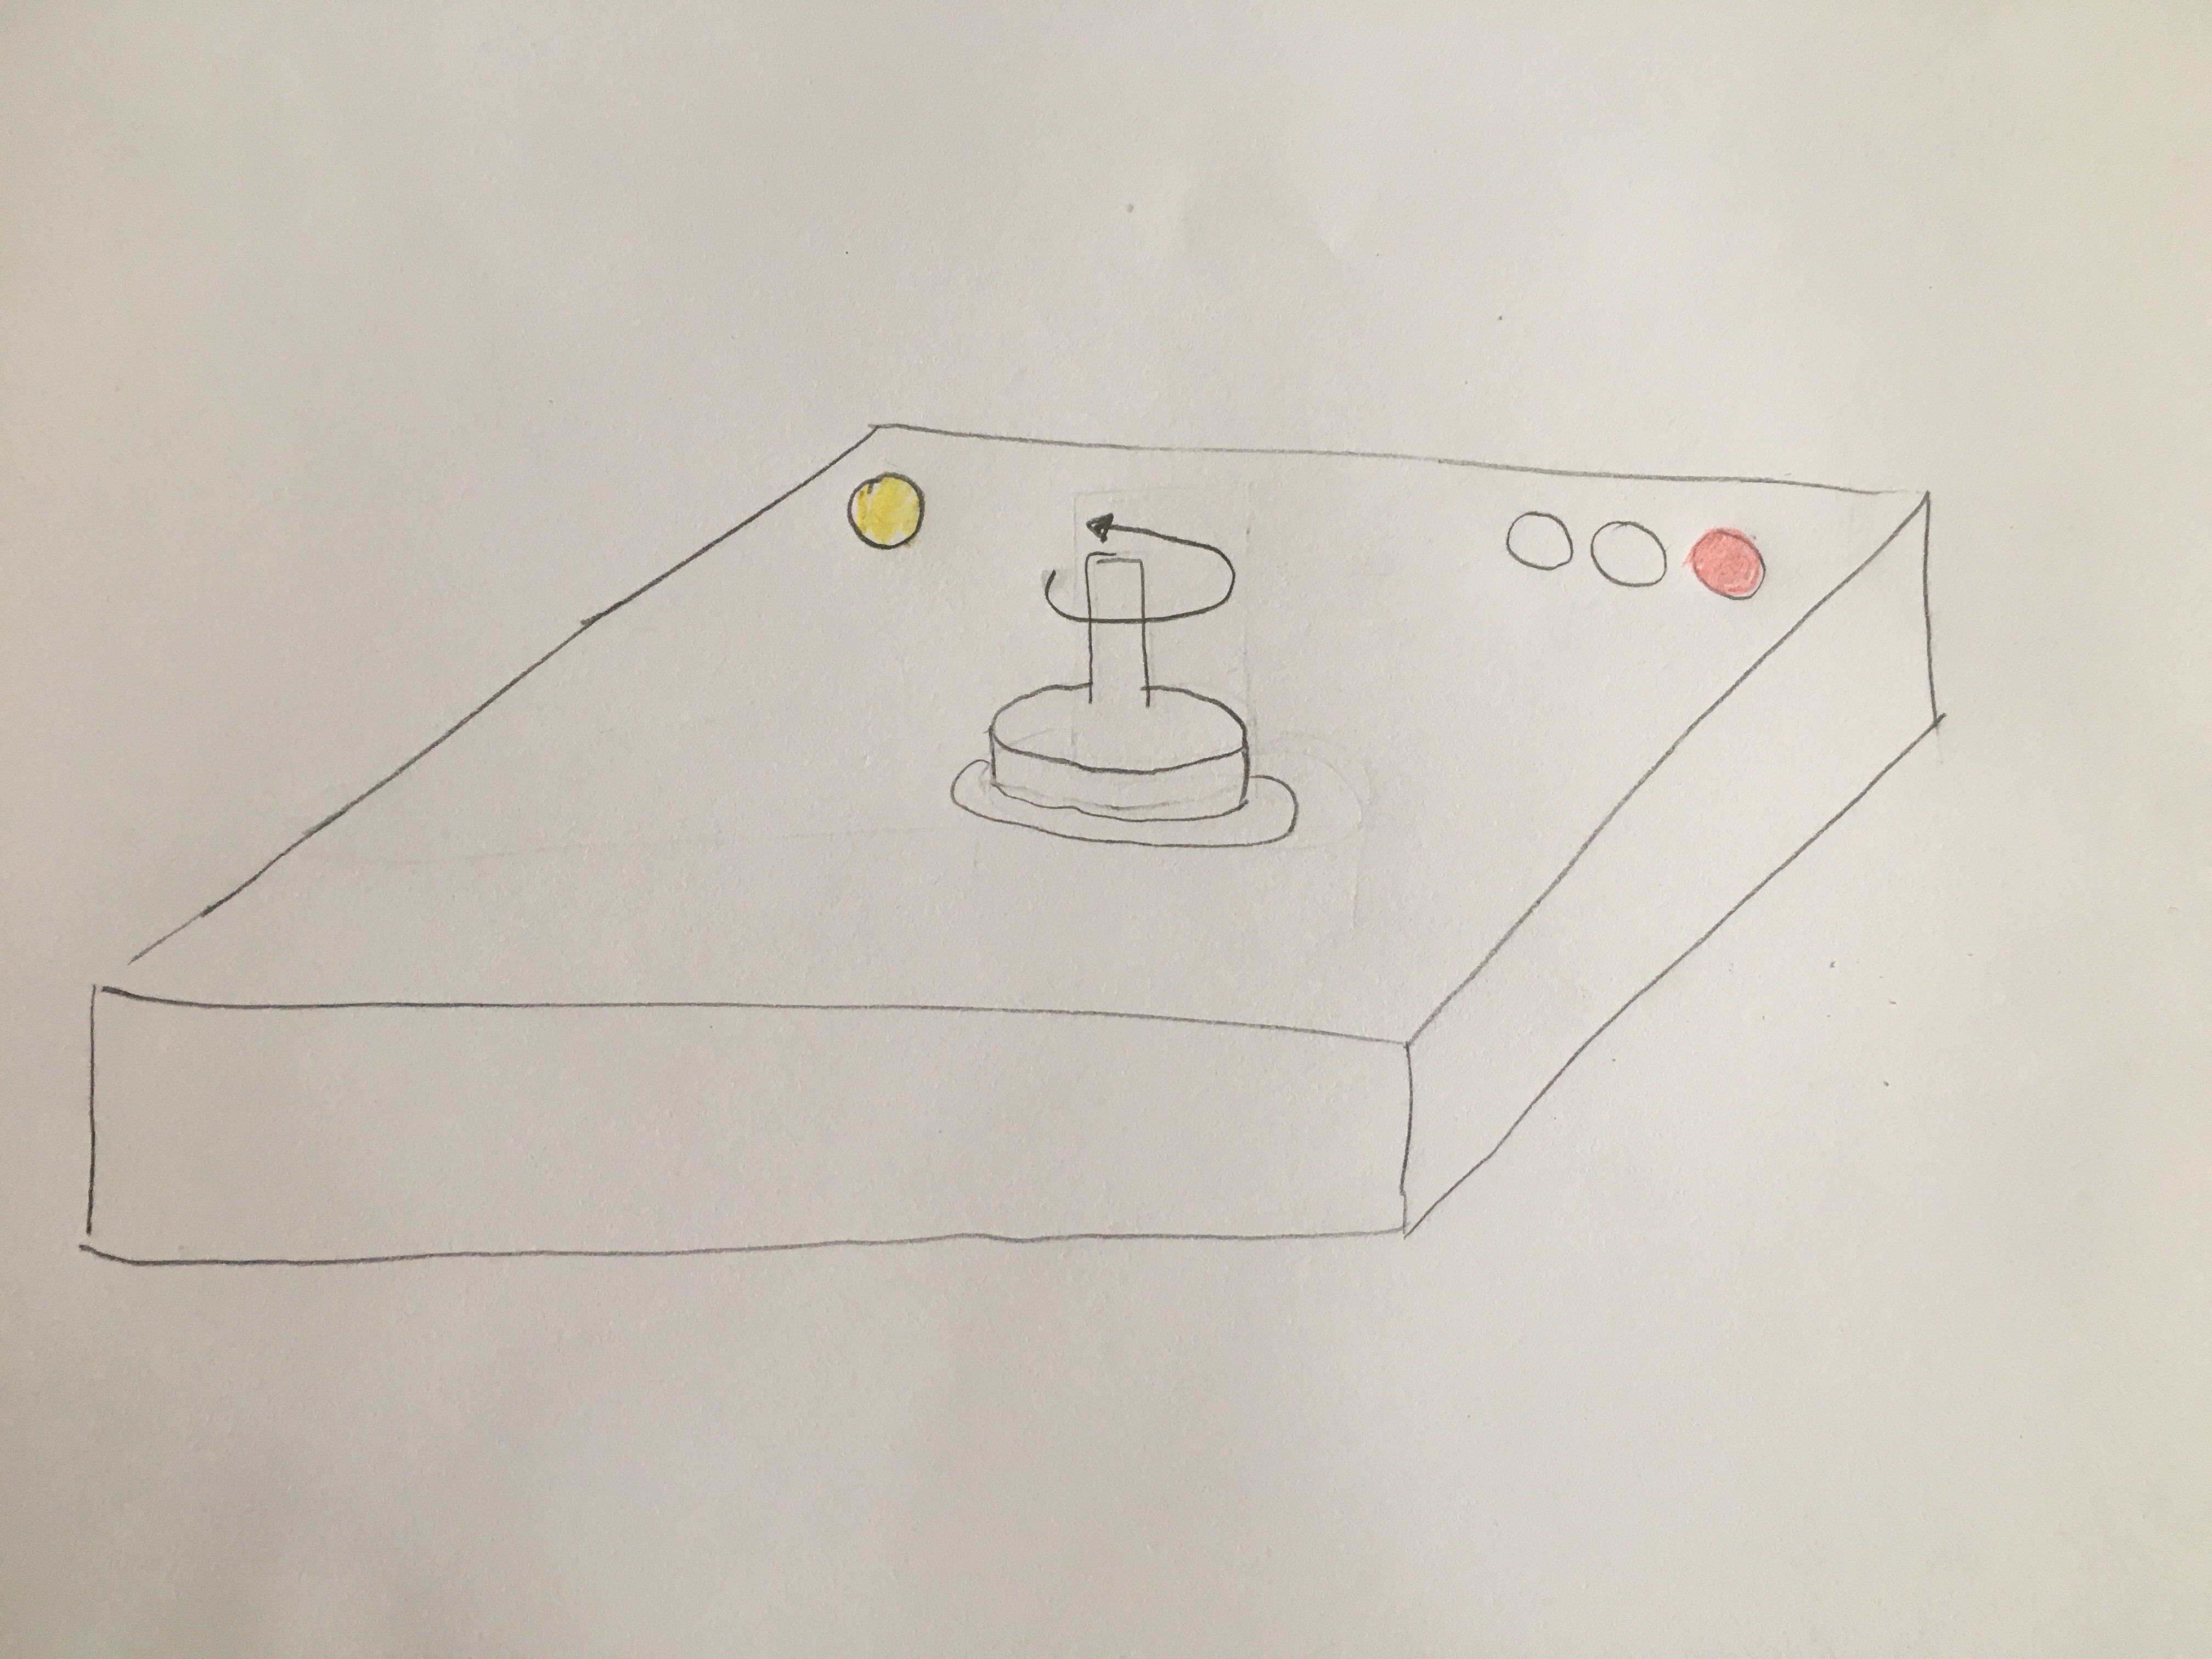
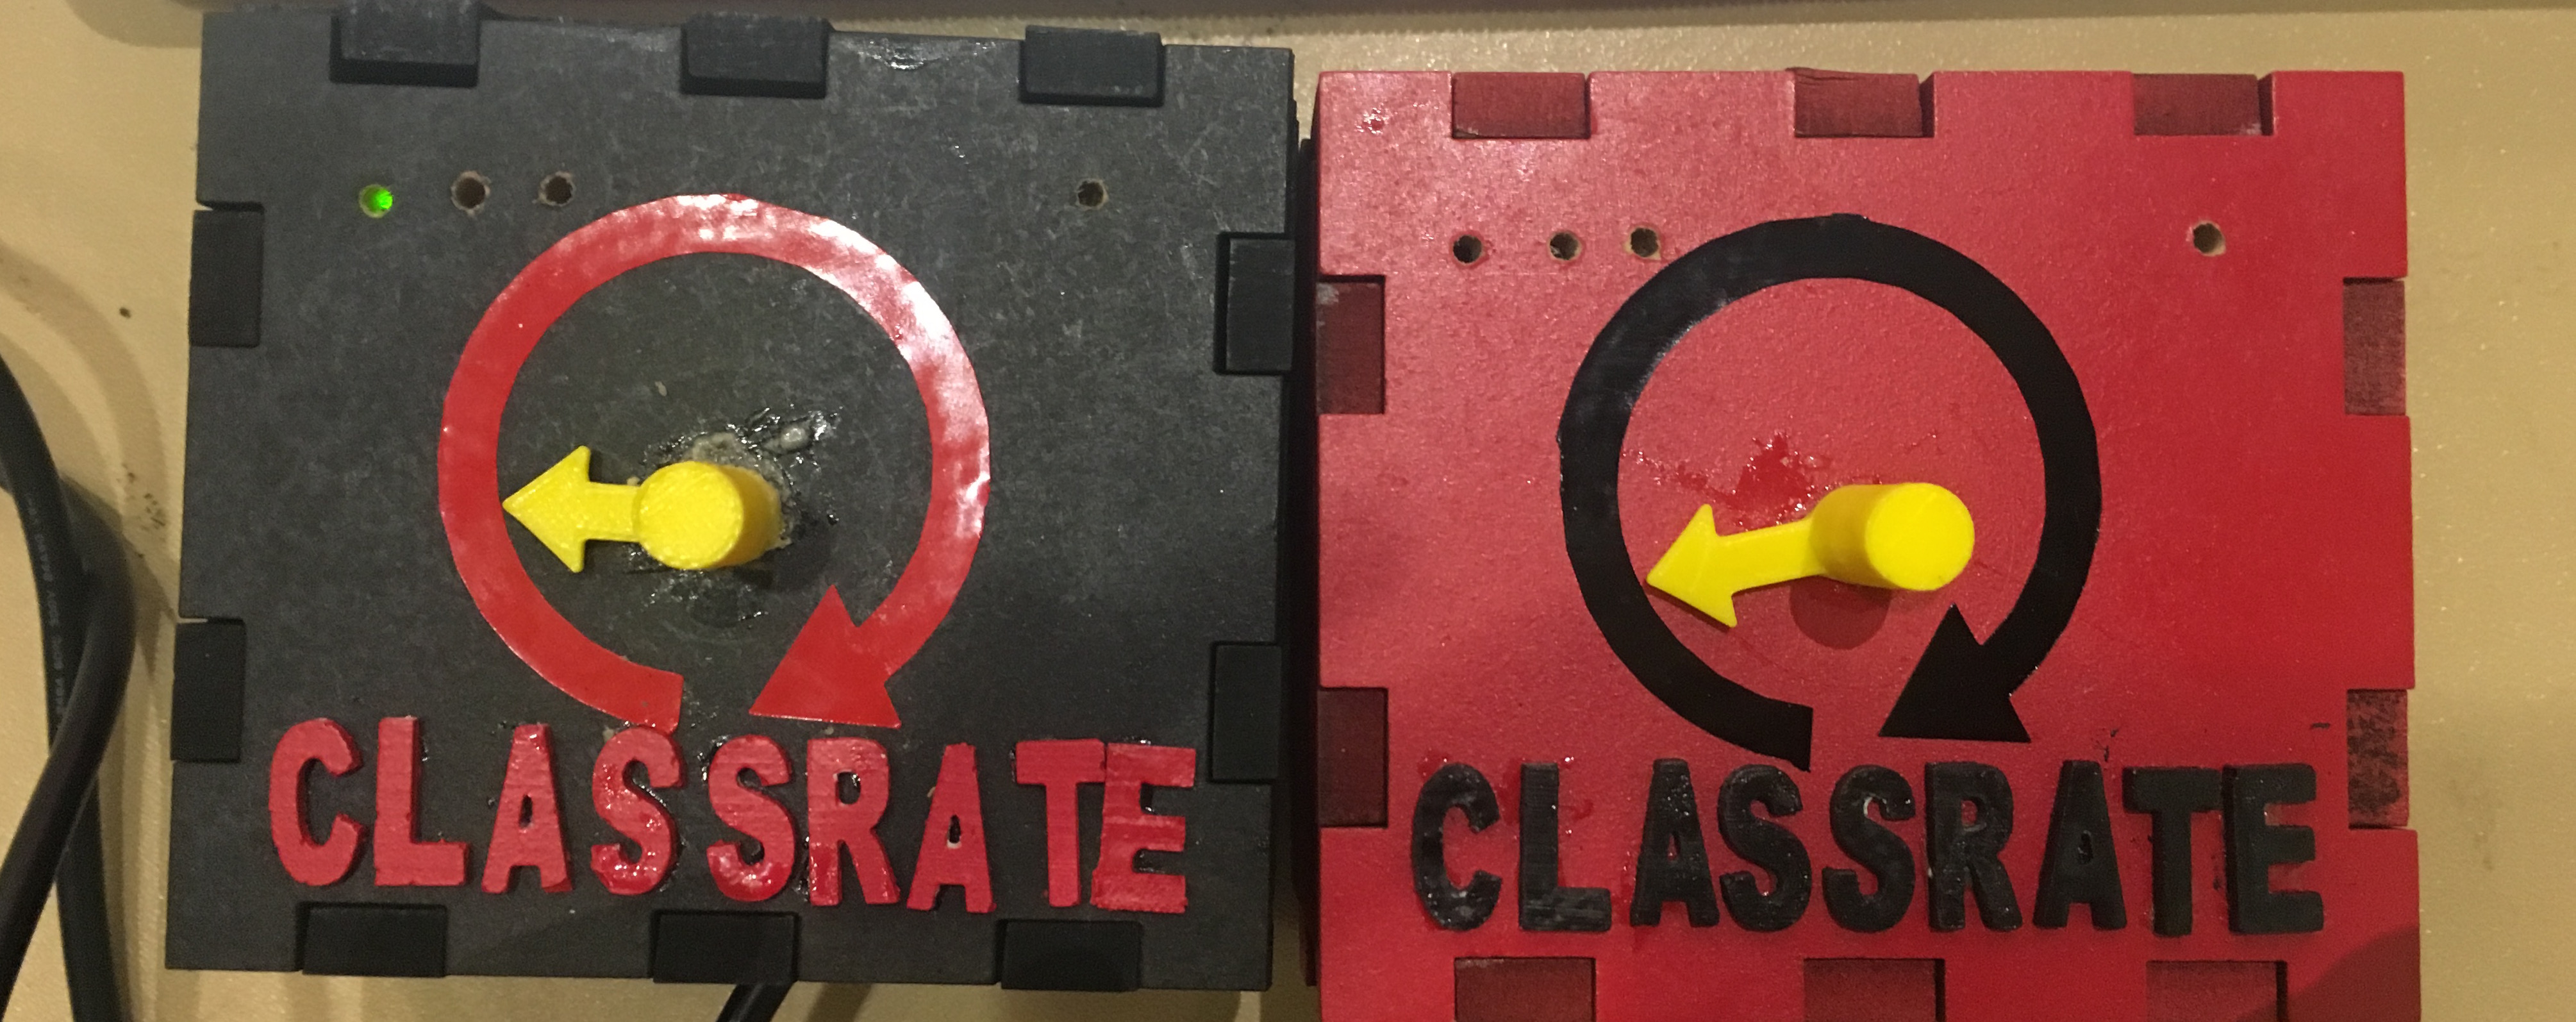
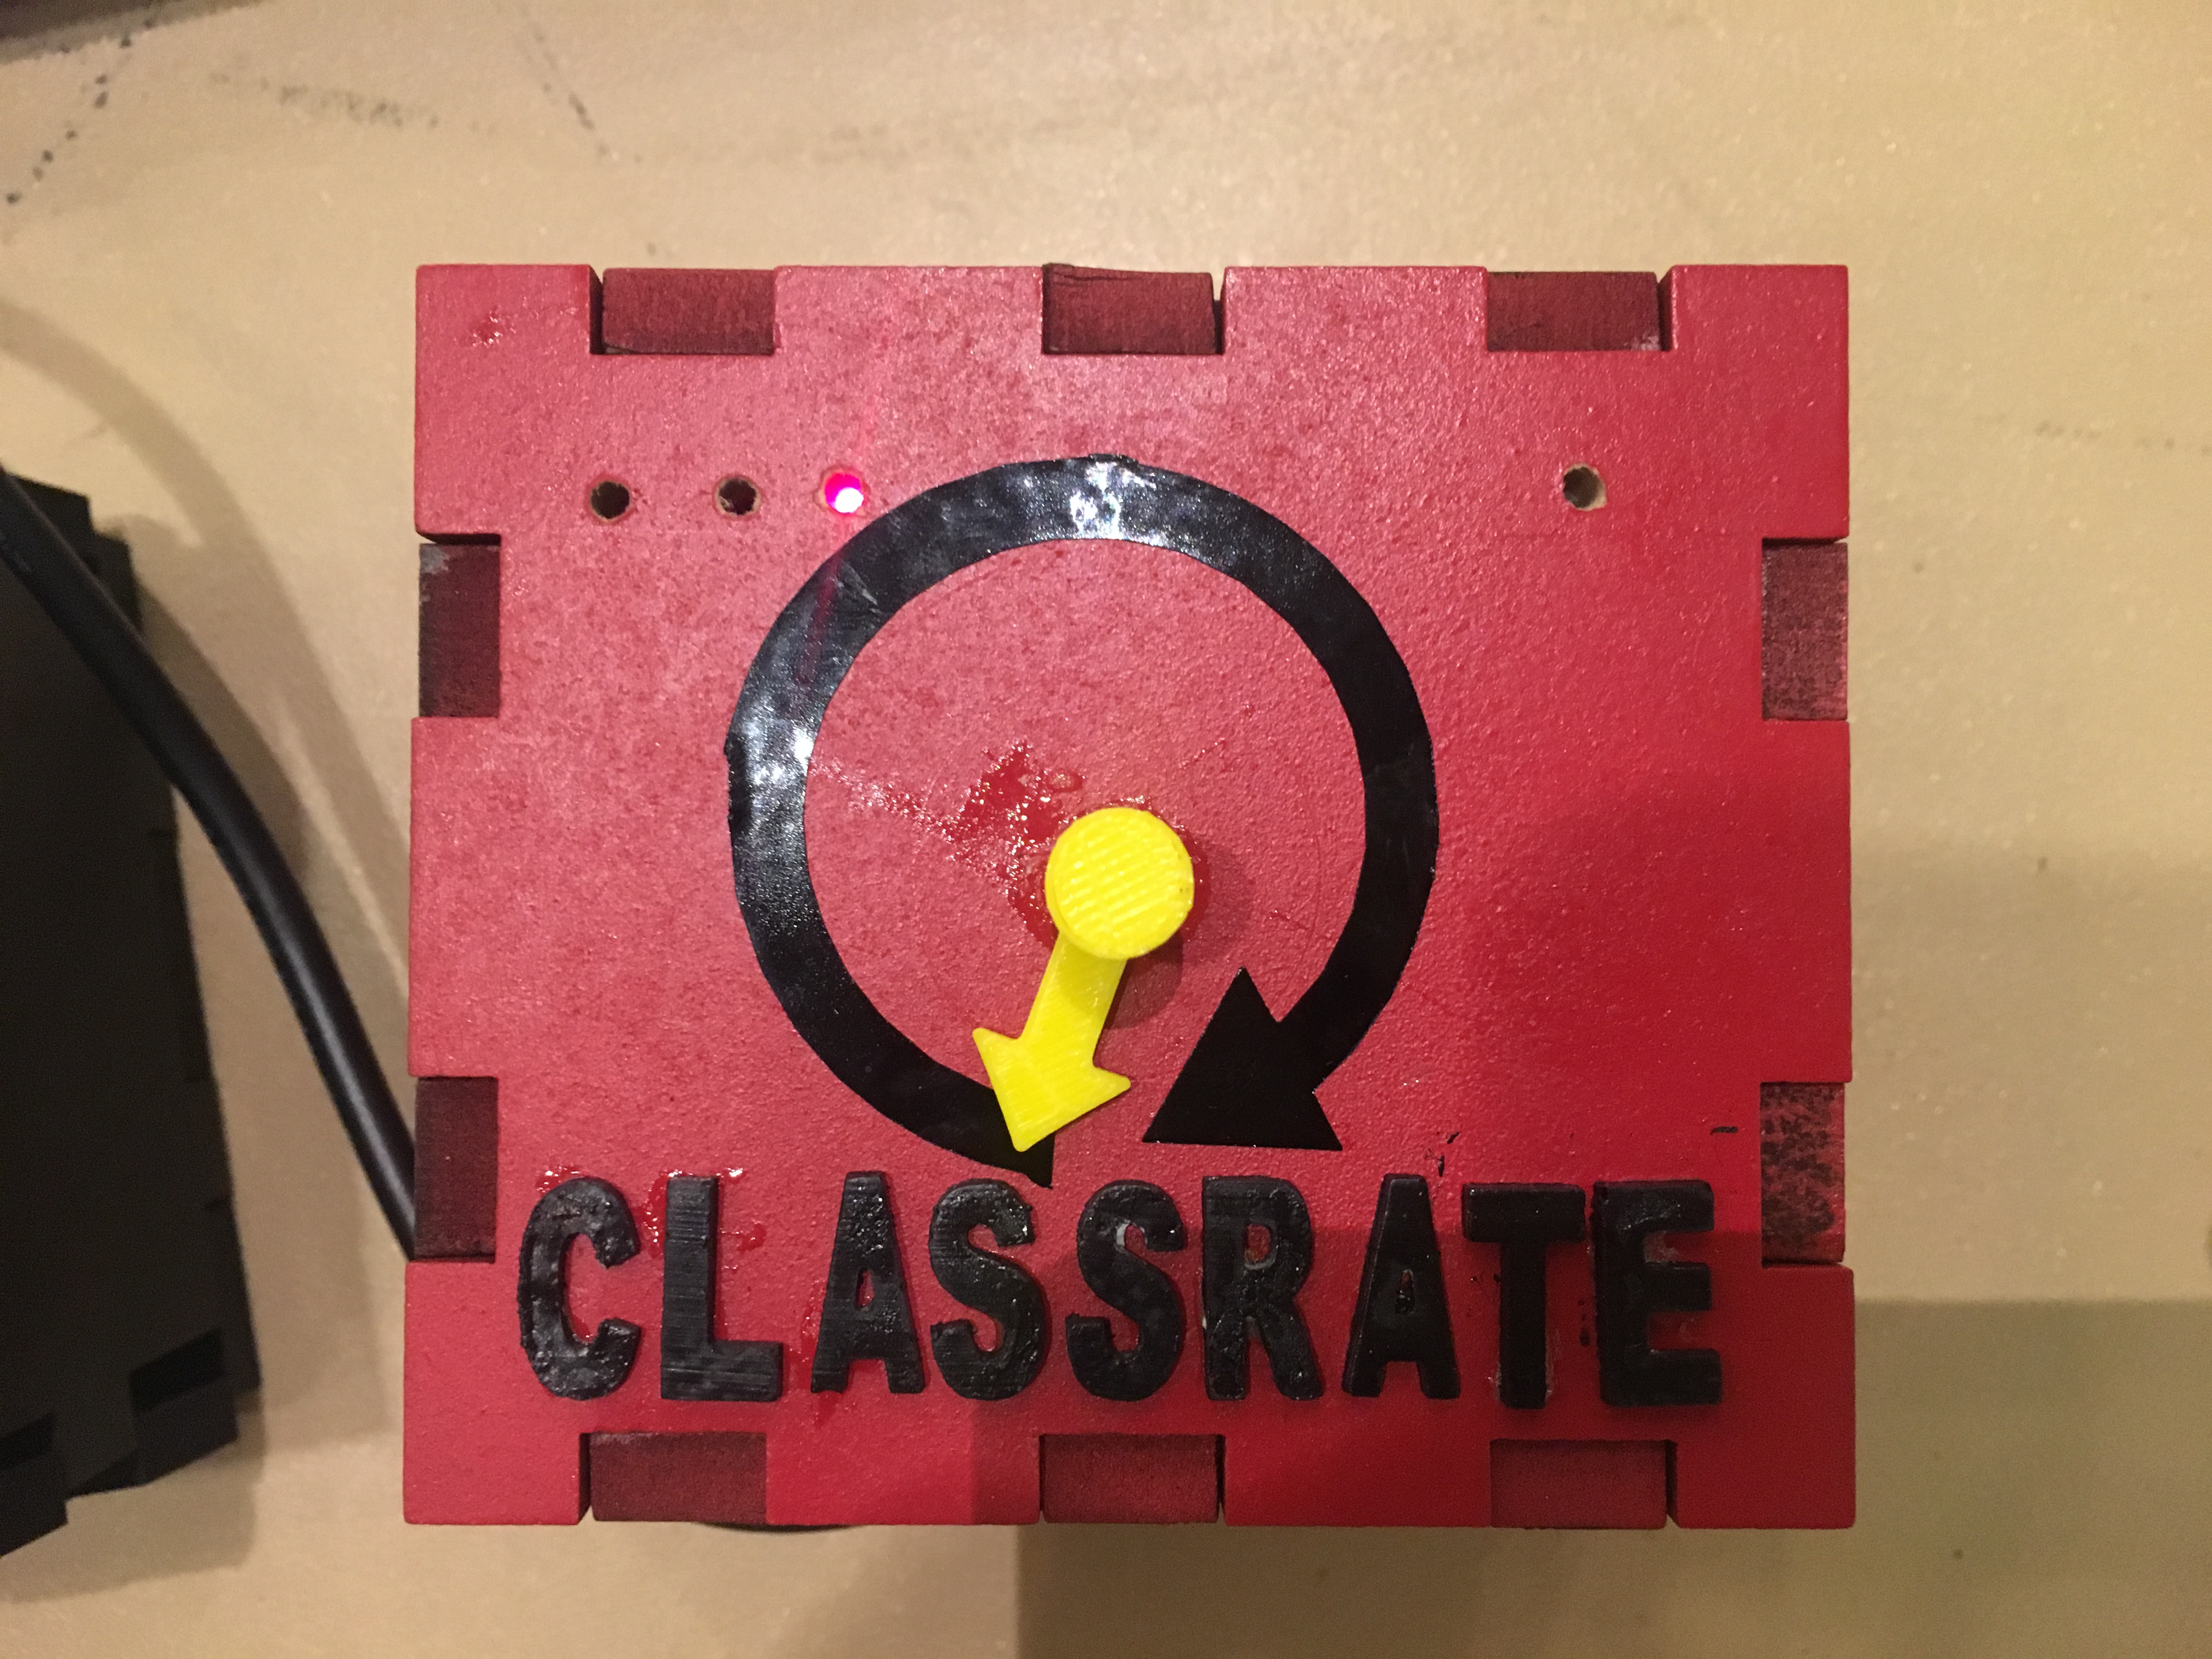
This picture shows the potentiometer and its different parts. The cylinder in the middle is the potentiometer that the student turns. As the student turns the potentiometer, they can know how they are rating by the yellow light on the upper left corner of the rating box. This light shines brigther when the student is at the highest rating (hard to understand) and shines dimmer when the student is at the lowest rating (easy to understand). In addition, there are three levels - easy to understand, medium to understand and hard to understand. These levels have cutoffs corresponding to one third, two thirds and three thirds of the highest rating respectively. When the student is within the first third of the highest rating, the student is within the 'easy to understand' level. Thus the green light will appear on the upper right corner of the rating box. When the student is between the first third and second third of the highest rating, the student is within the 'medium to understand' level. Thus the orange light will appear on the upper right corner of the rating box. When the student is between the second third and the highest rating, the student is within the 'hard to understand' level. Thus the red light will appear on the upper right corner of the rating box. In this picture, the red light is appearing, indicating that the student thinks the lecture at that time is hard to understand.
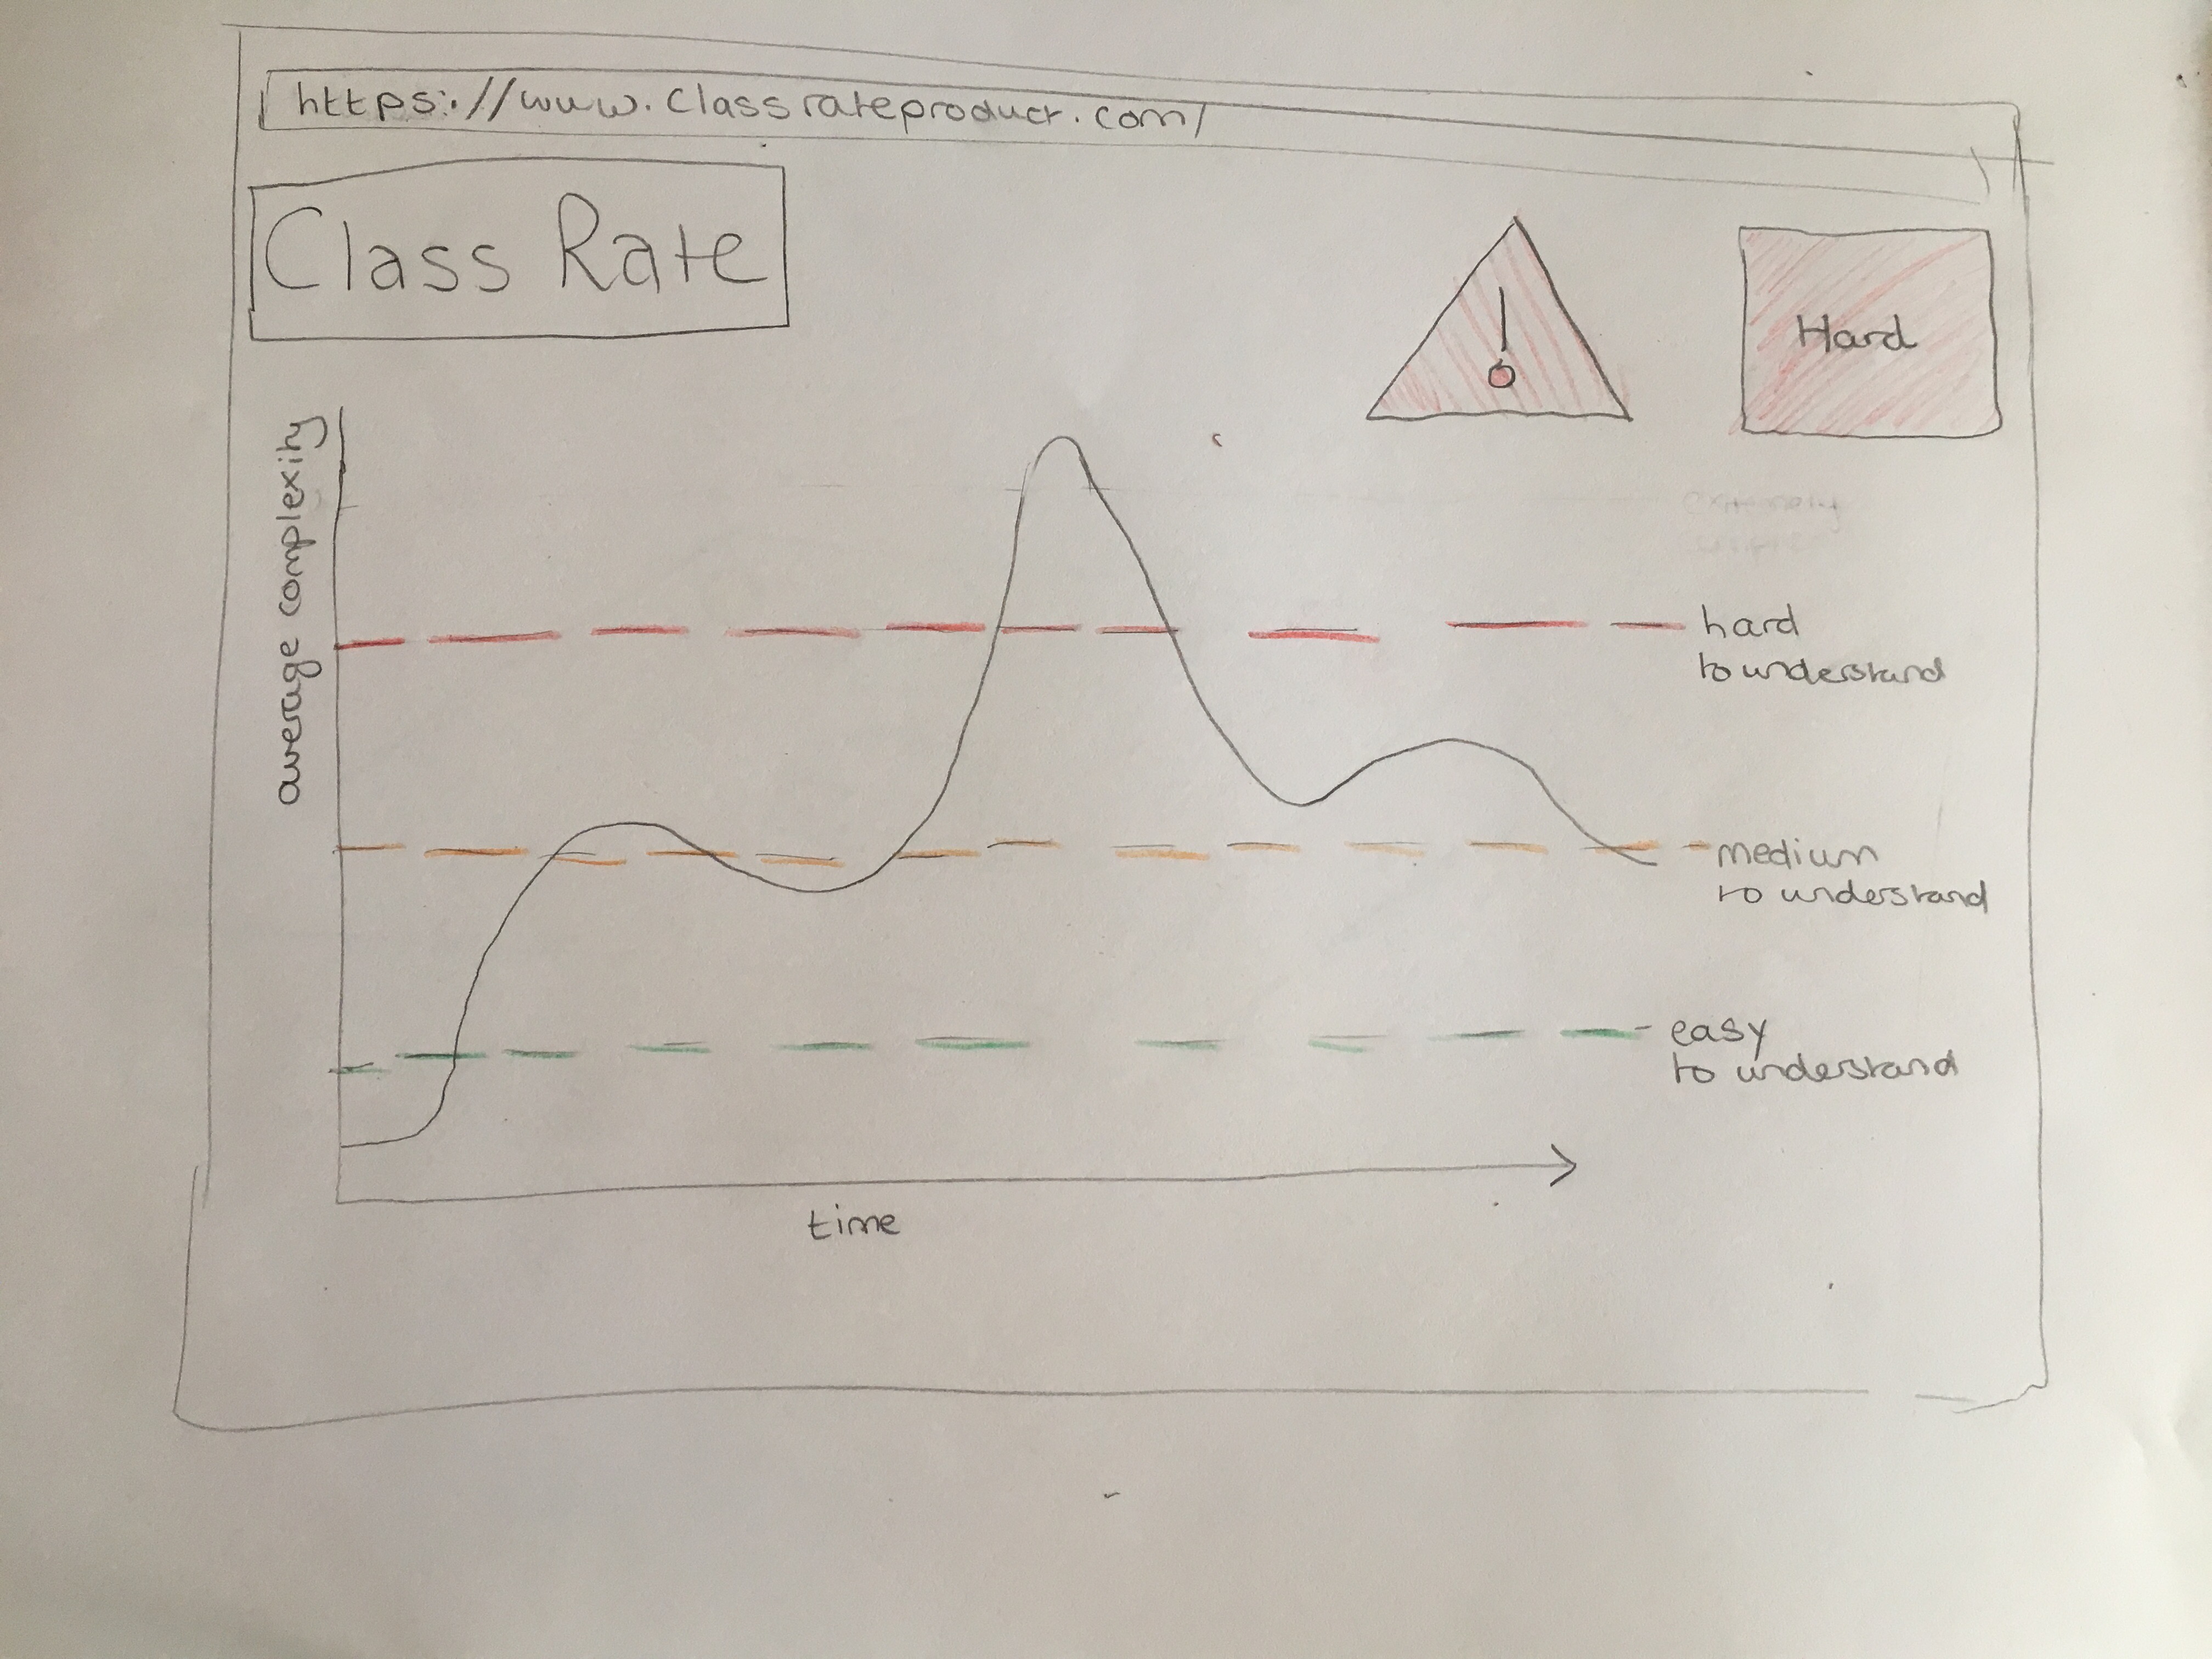
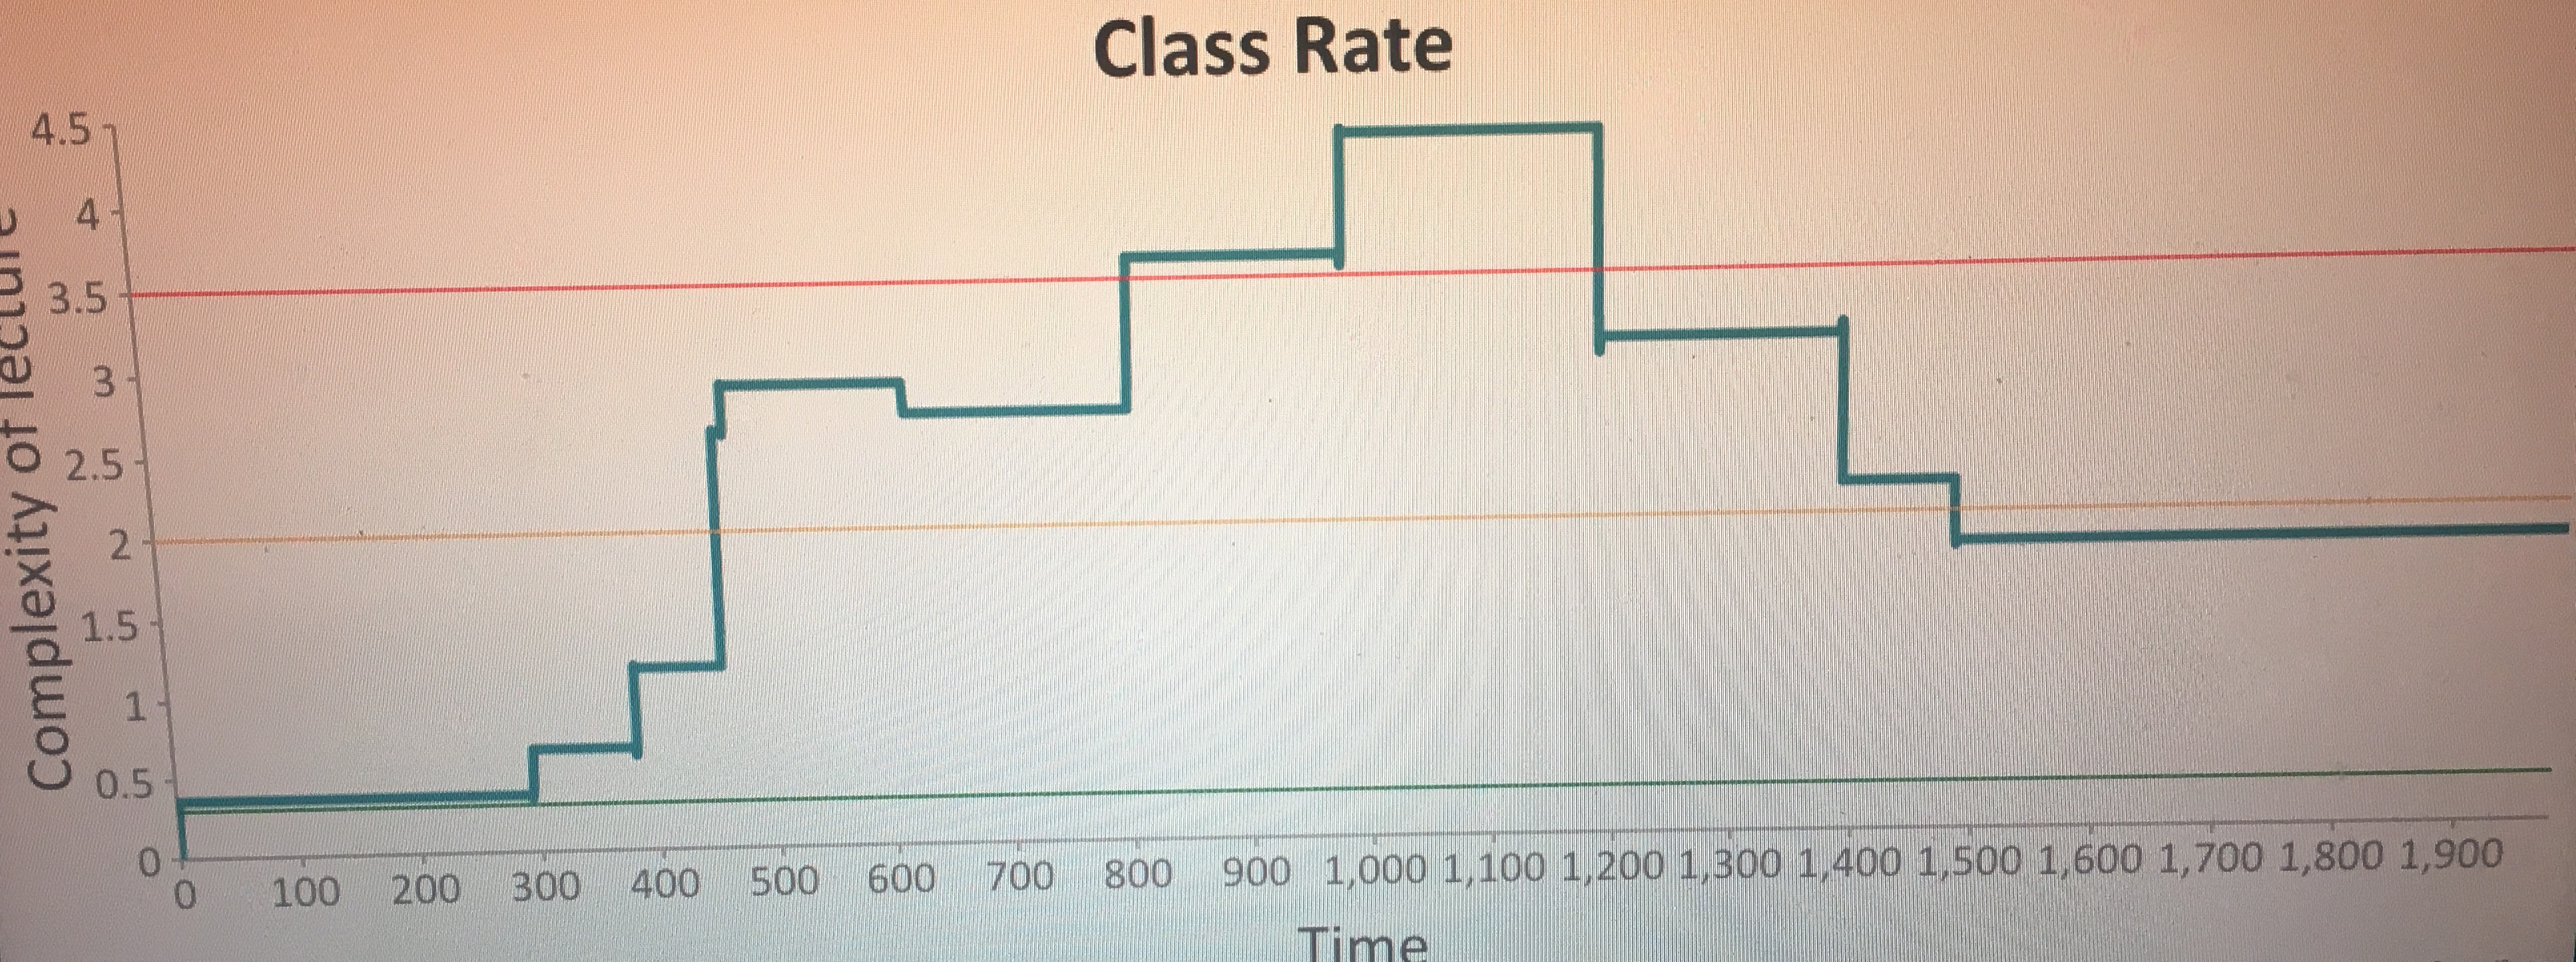
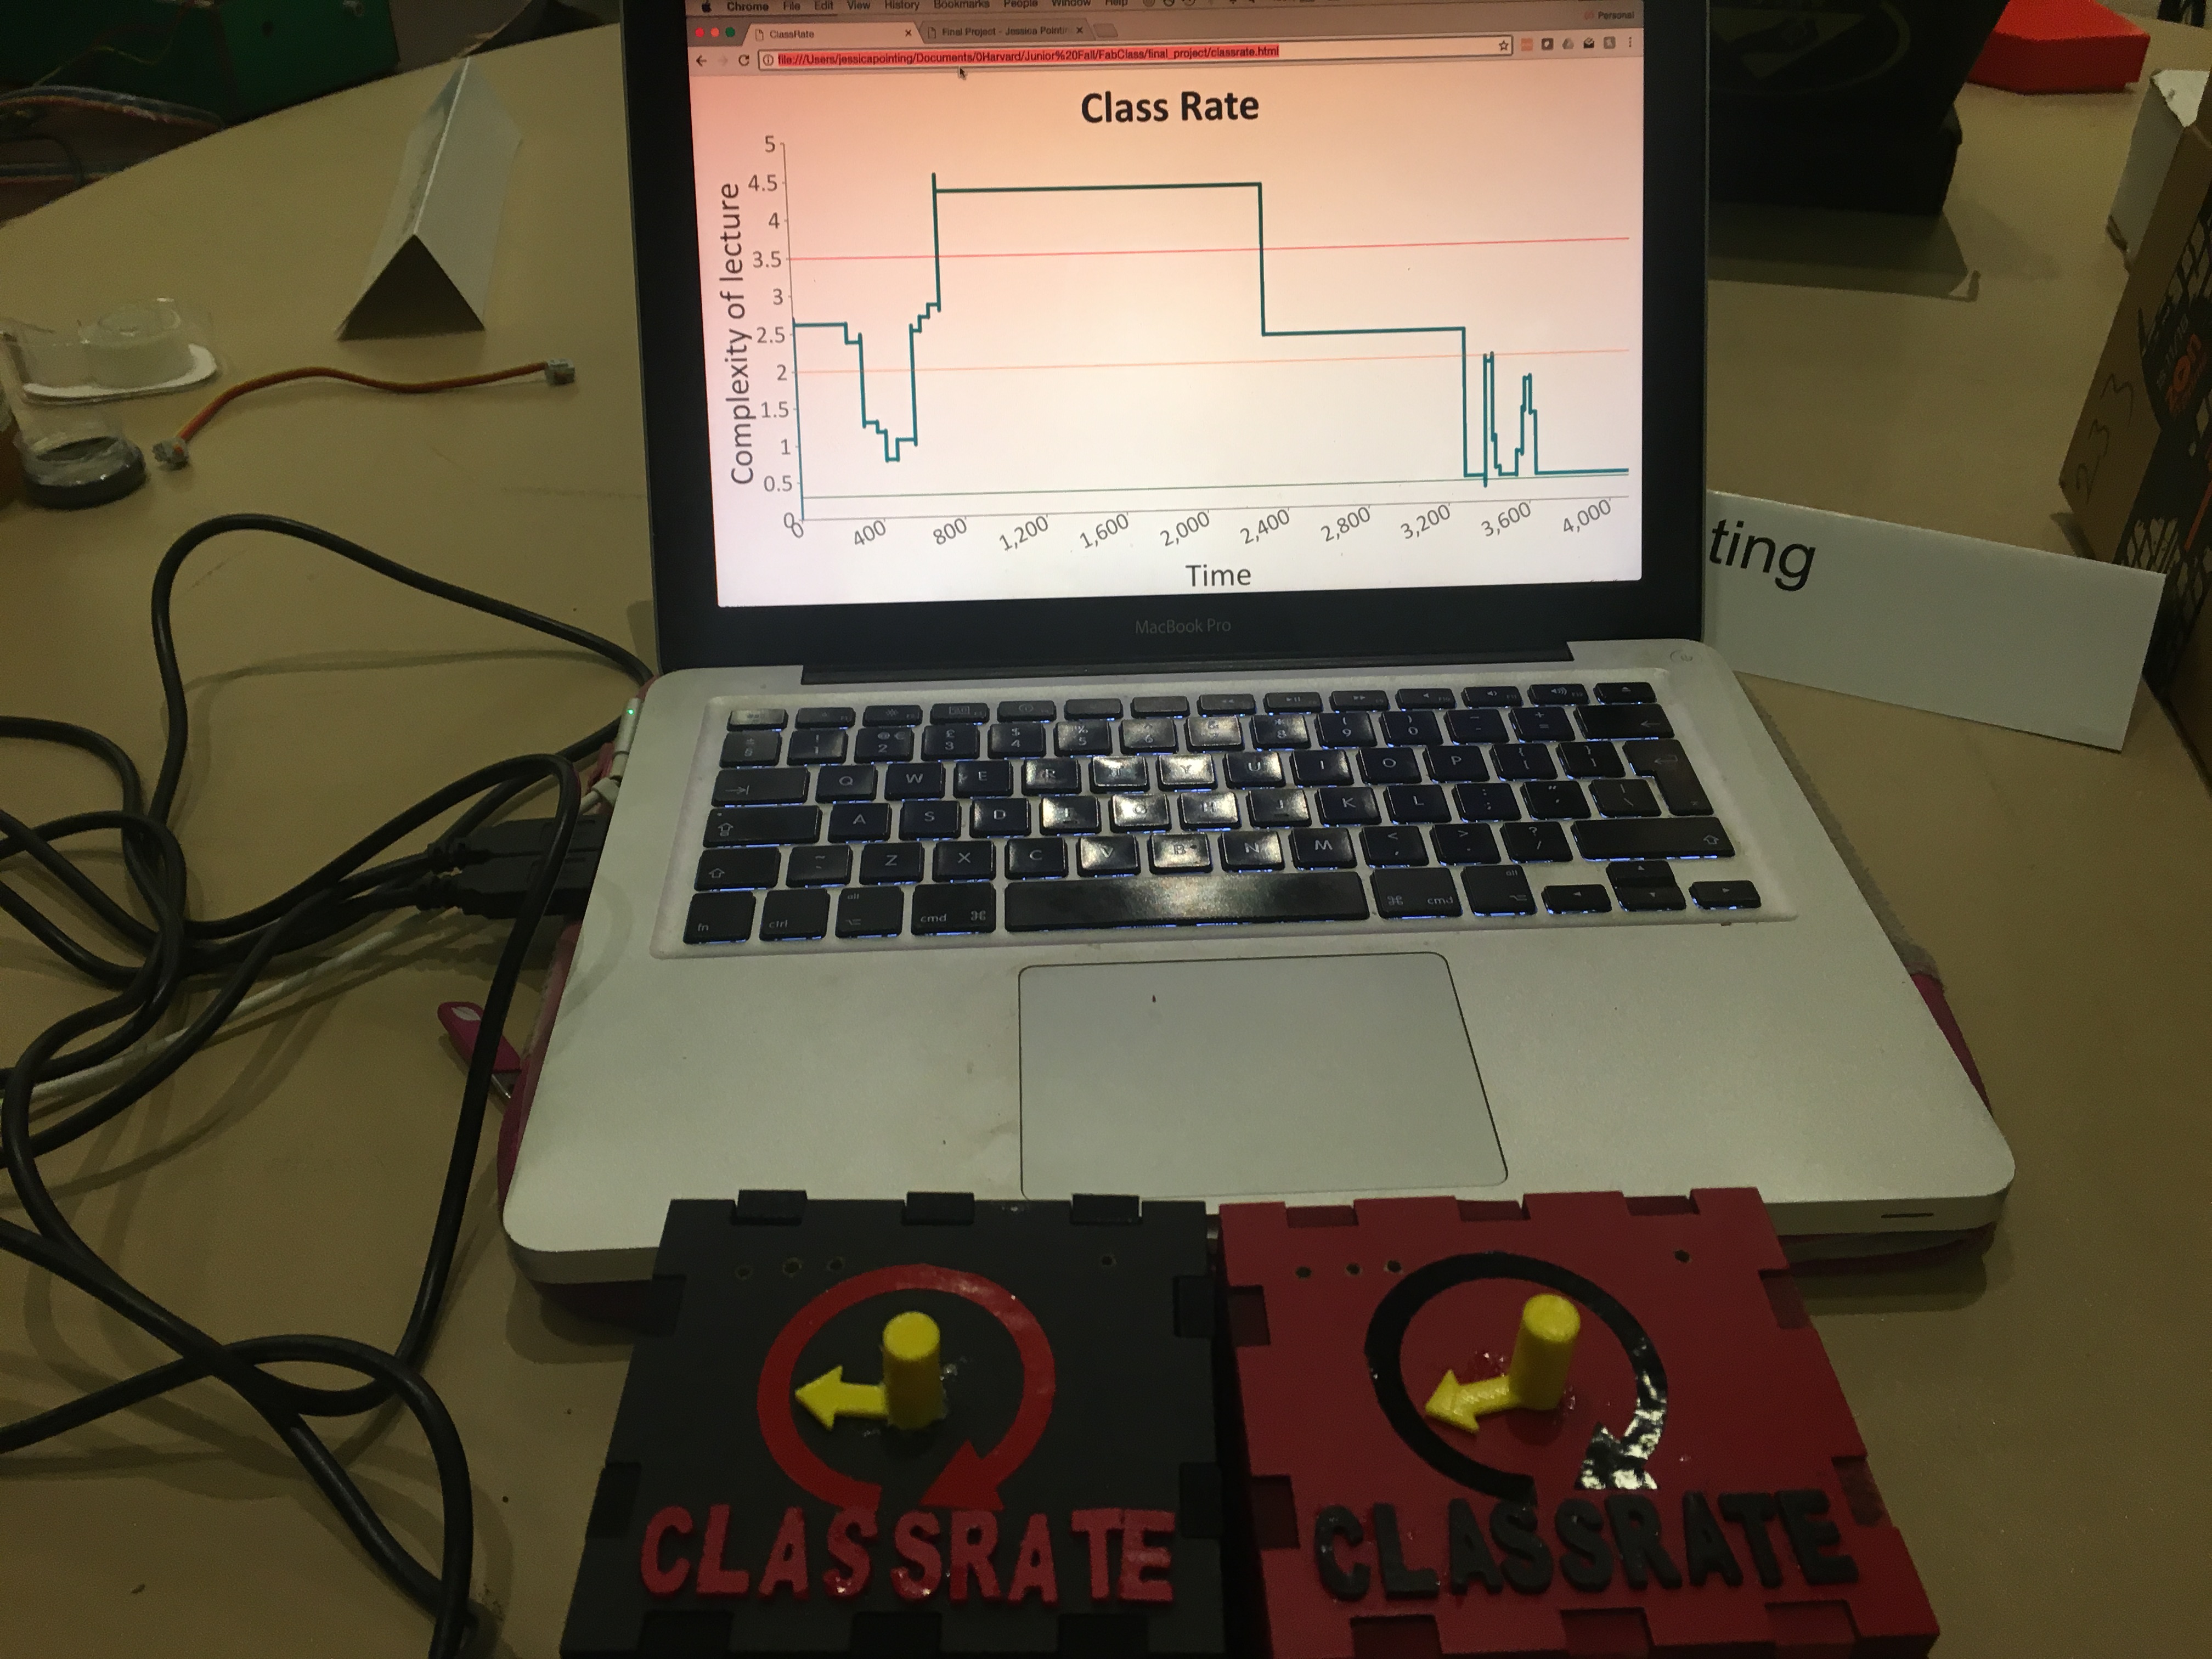
This picture shows the web application for the ClassRate product. The application consists of two parts: 1. a graph over time showing the average rating 2. an indicator of what level the average rating is at at that particular time. The graph y-axis is the average rating and the graph x-axis is time. The graph updates as time moves on (which it always does). The graph also shows the cutoffs for the three levels. Near the middle, the line shoots up to 'hard to understand'. At this point, the professor should have noticed and would try to explain the topic more. As a result, you see that the line then goes down fairly quickly and you get a cycle. This is what should happen. You shouldn't see graphs that have a constant level if the line is above the 'hard to understand' range. The second part of the web app is an indicator showing what level it is currently at. In this picture, the level is 'Hard' so that shows up. In addition, when the level is 'hard to understand', a warning sign comes up to make the professor notice even more.
Building the Final Project
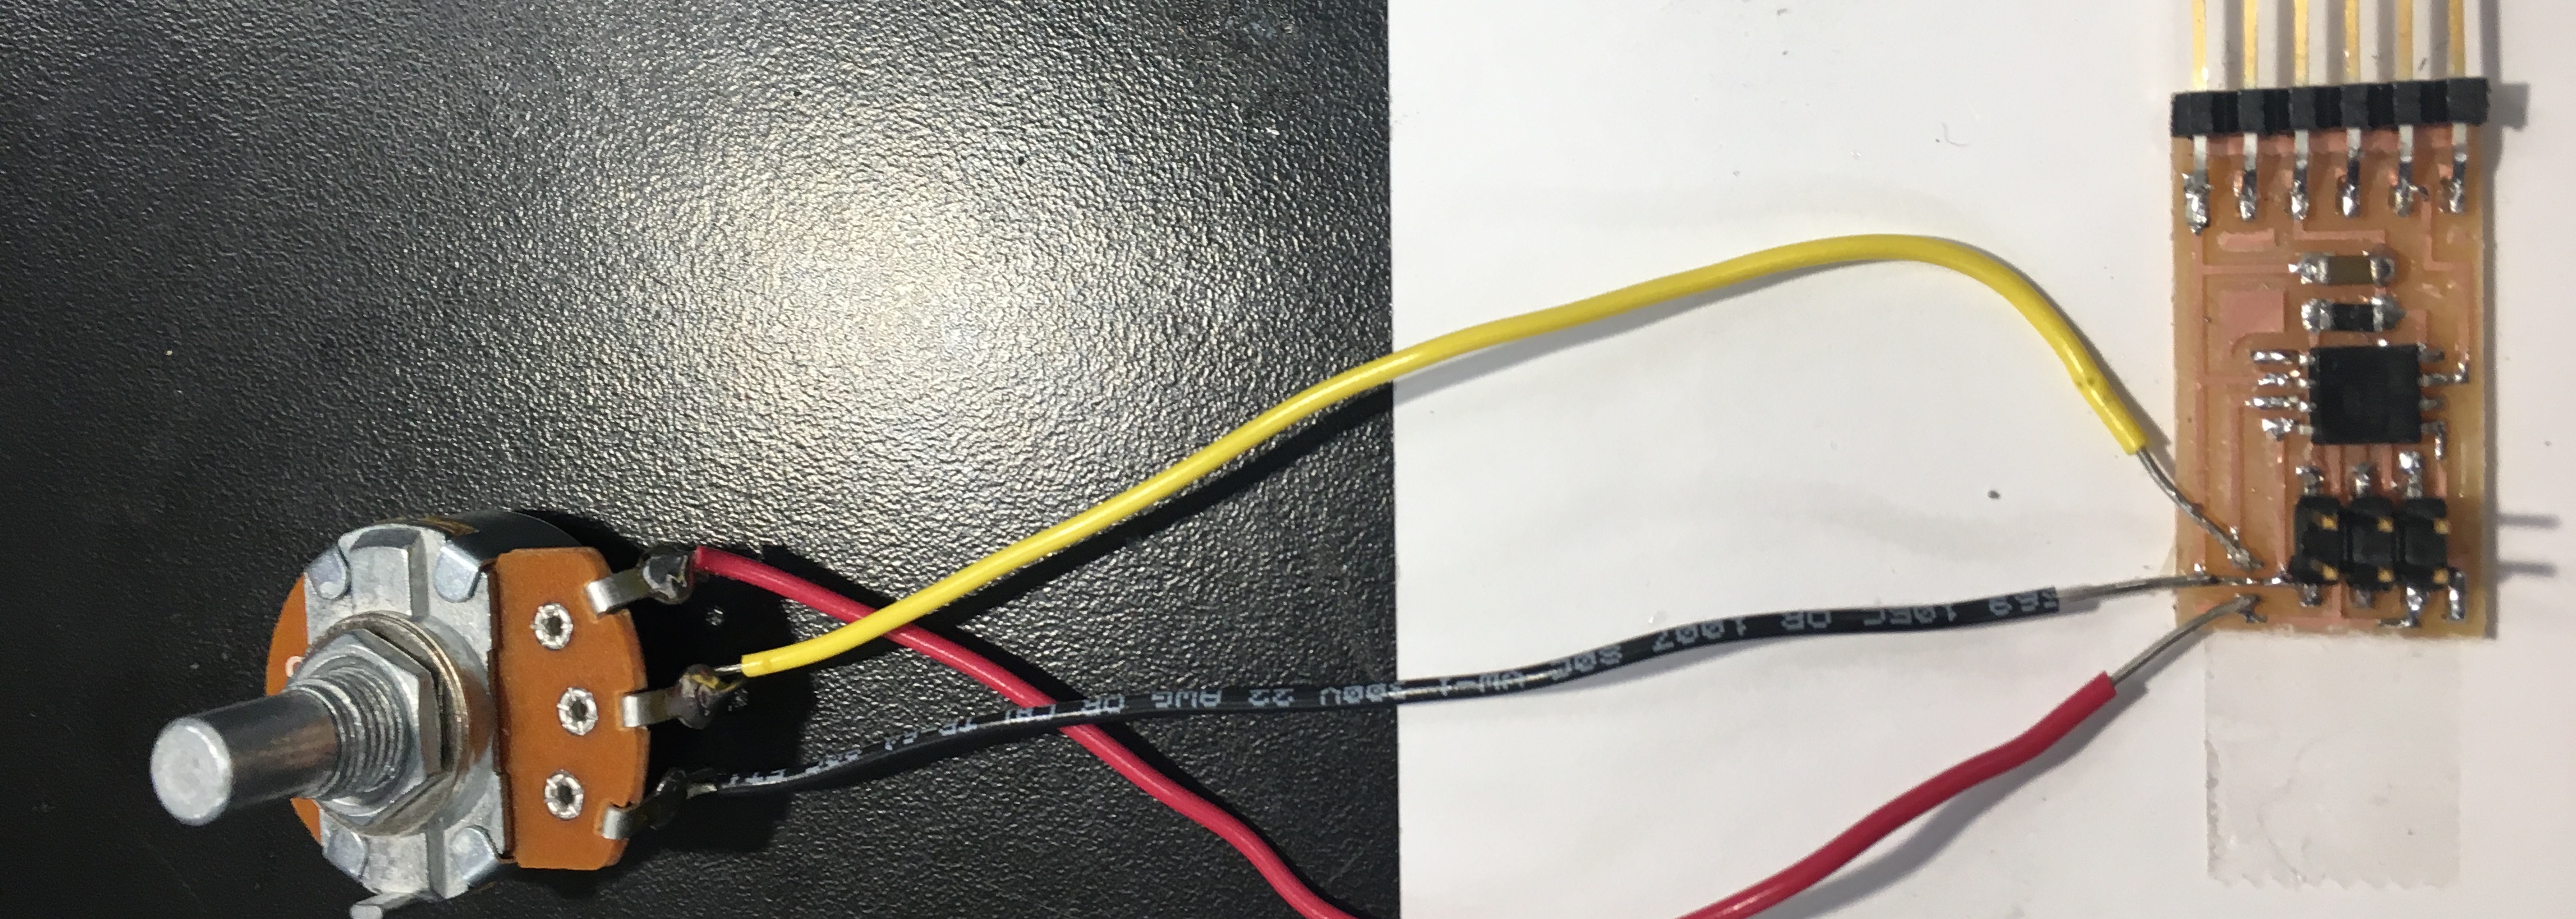
The first step is trying to identify a single potentiometer and get its reading.
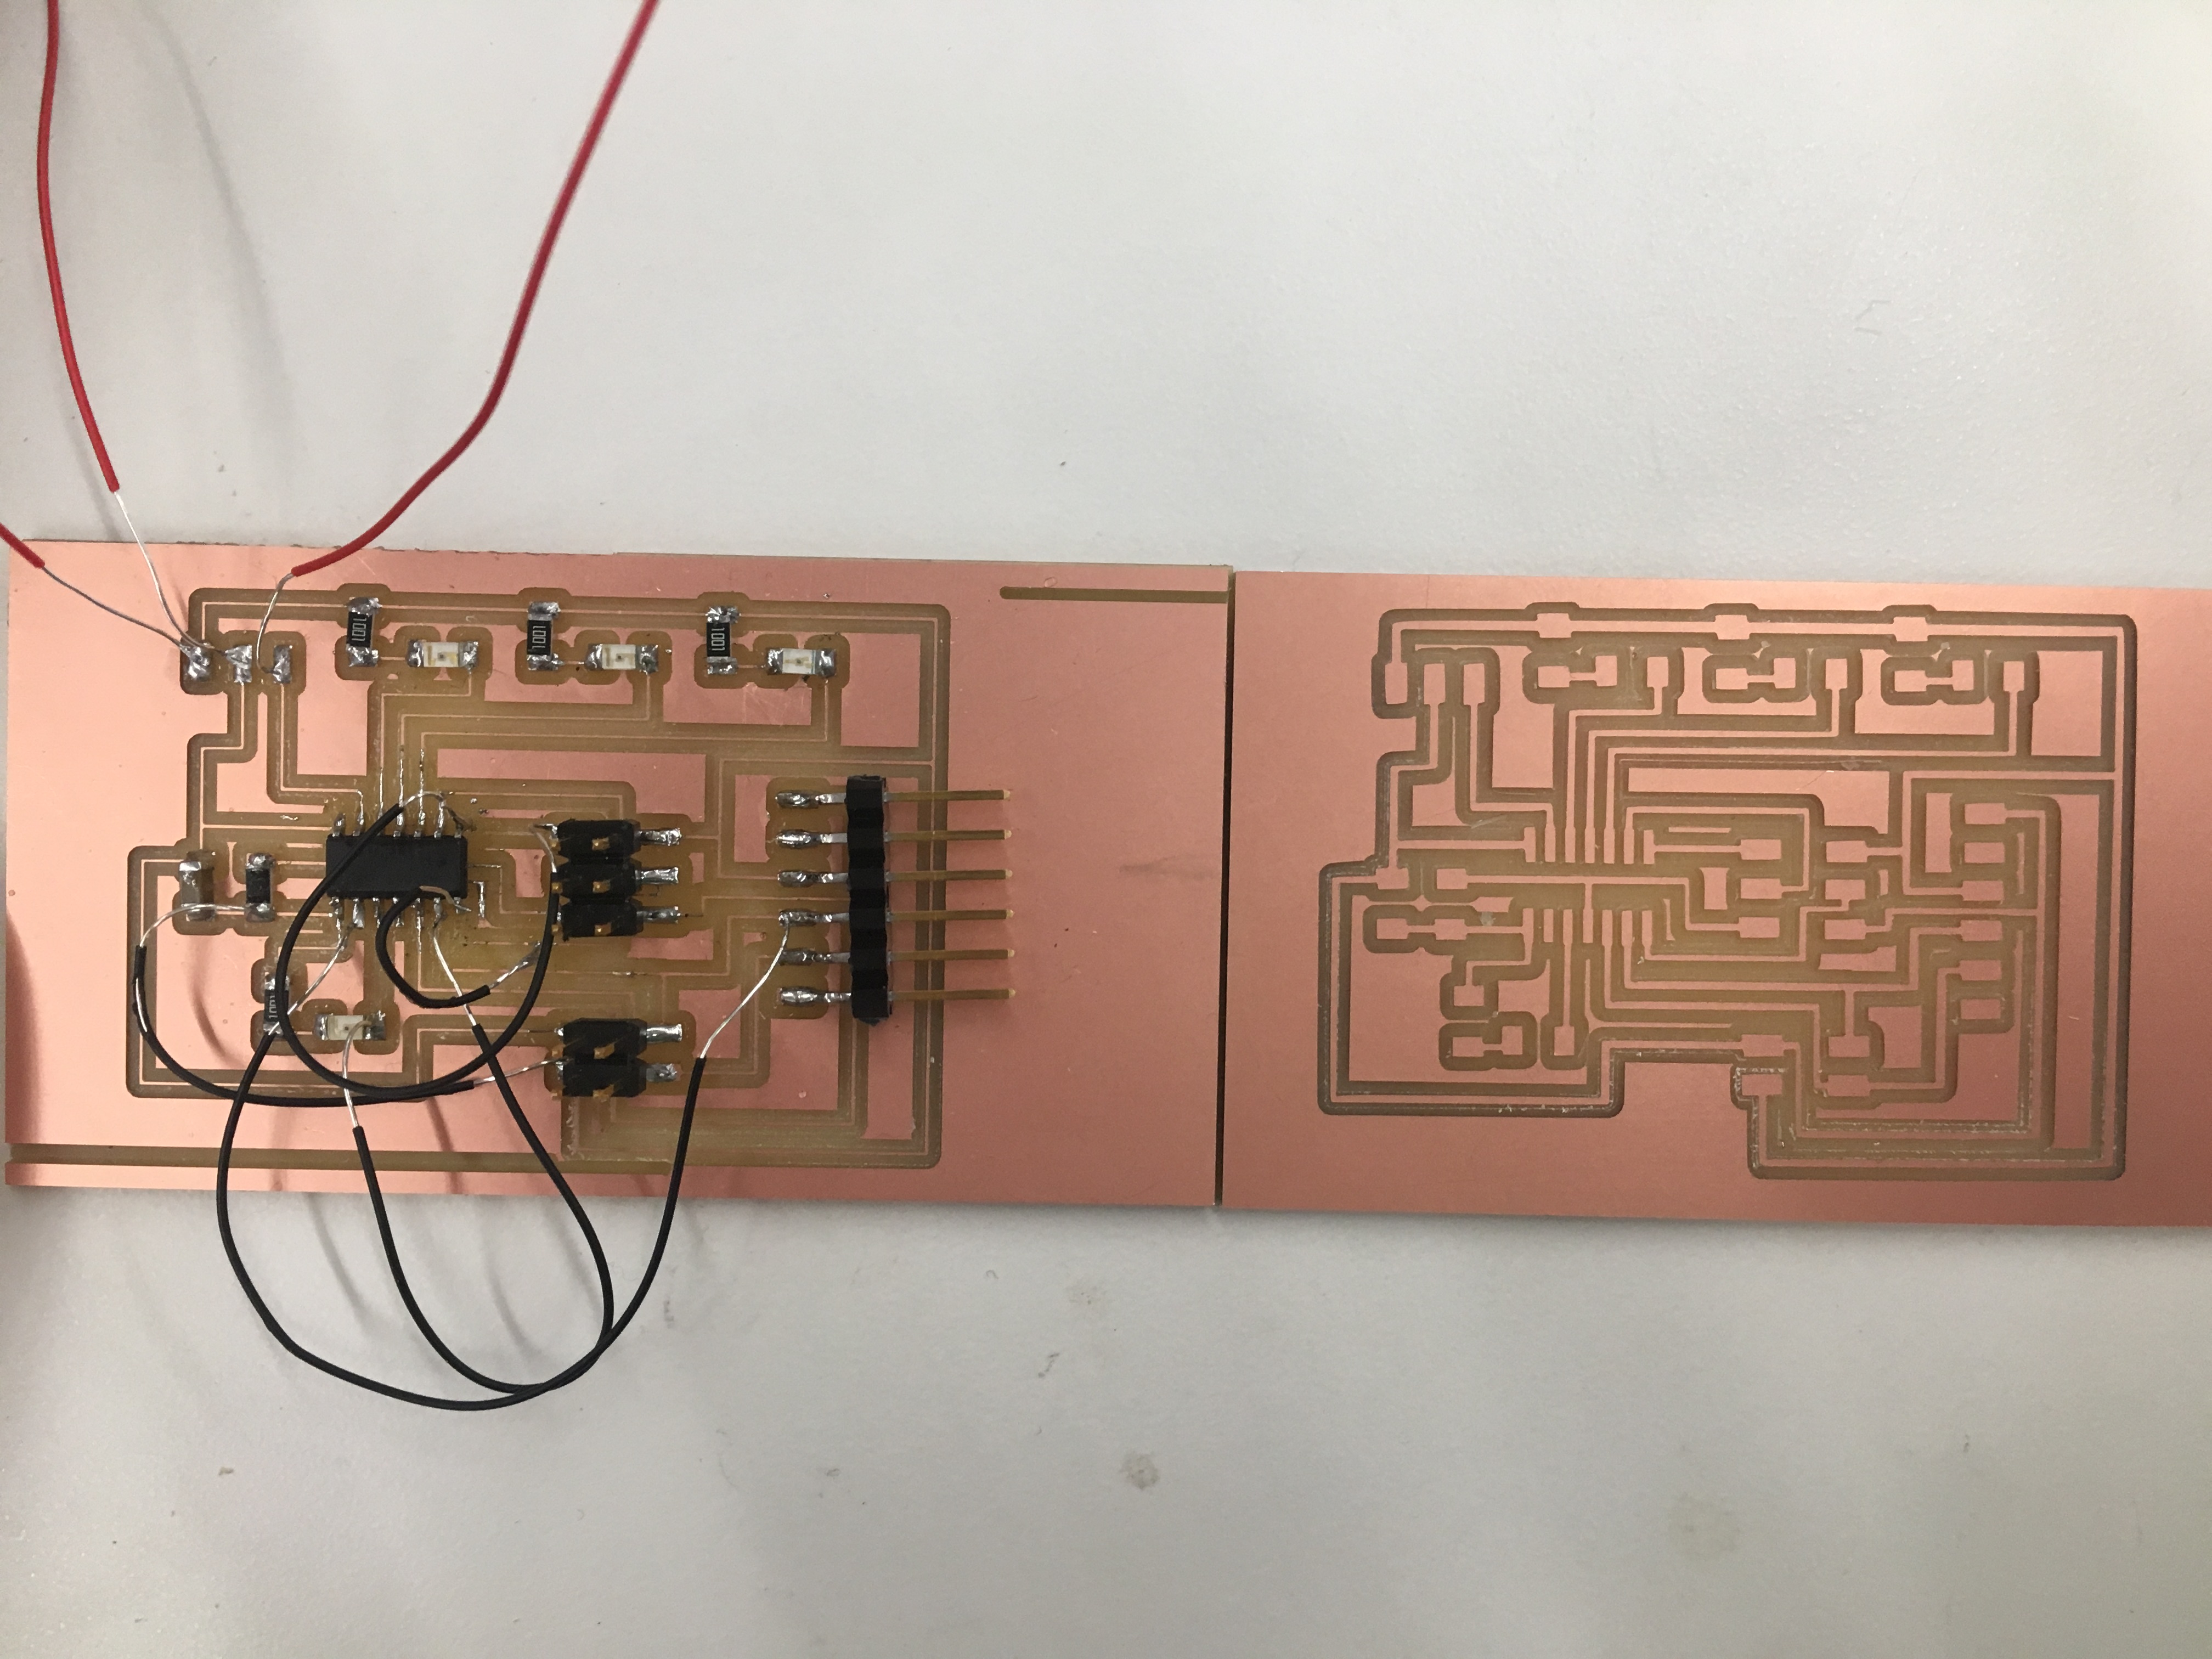
Phase 1: Building the circuit
I used steps in Week 1 to make this board. I used a circuit similar to the magnetic field input device circuit. This is because both of these give an analogue output, which I could convert, to digital.
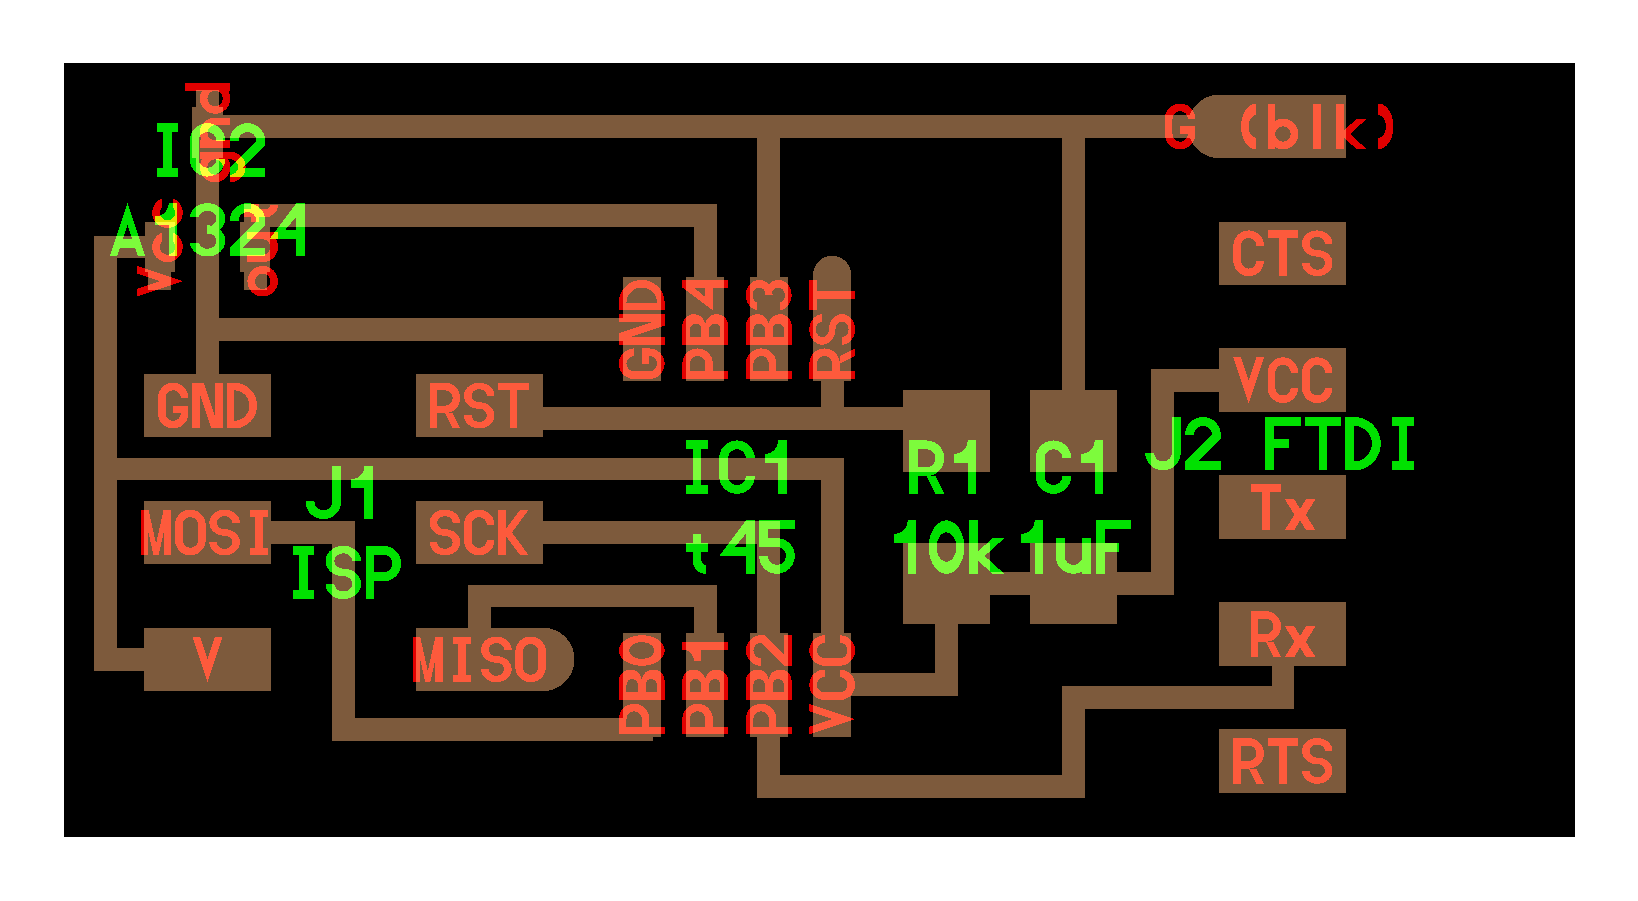
I made the board on the Roland Mill. After making the board, I soldered the components together, and got the board! Then, I added the potentiometer to the ground, voltage and output parts of the board.
Phase 2: Programming
After doing that, I programmed the board (using steps in embedded programming). The board programmed ok. The files are:
hello.mag.45.c hello.mag.45.c.makePhase 3: Nodejs app
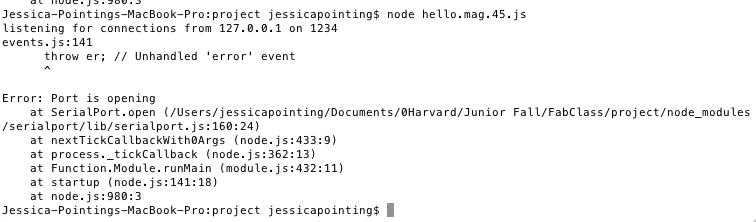
I npm installed ws and serial port Now, I tried running the Nodejs app by running node hello.mag.45.js hello.mag.45.js hello.mag.45.html First of all, it complained that var SerialPort = require("serialport").SerialPort was deprecated, so I used require("serialport") instead. Then, I got the following error message:
This bug was very annoying. I installed ‘CoolTerm’ which is now one of my favourite terminals. It allows you to easily see what devices are connected and allows you to send output to the board and receive input from the board in a simple interface. I used CoolTerm to see whether the serial port was being recognized by the computer. And yes it was being recognized. [Instructions for CoolTerm]. I then checked whether the computer was receiving input from the potentiometer, and yes it was also! So why wasn’t the nodejs app doing the same? I asked a lot of people and no one knew the answer. After many Google searches and attempts, I came across this post. I added this block of code:
									serialPort.on('error', function(err)
										{
											console.log(err);
										});
And it worked!
Now, I was able to read the input from the potentiometer. When I turned the potentiometer, the reading changed. The changes in the numbers weren’t noticeable, so I displayed the value as (value % 5) so that I had a range from 0 to 4 where 0 was the lowest rating and 4 was the highest rating.
Networking and Communications
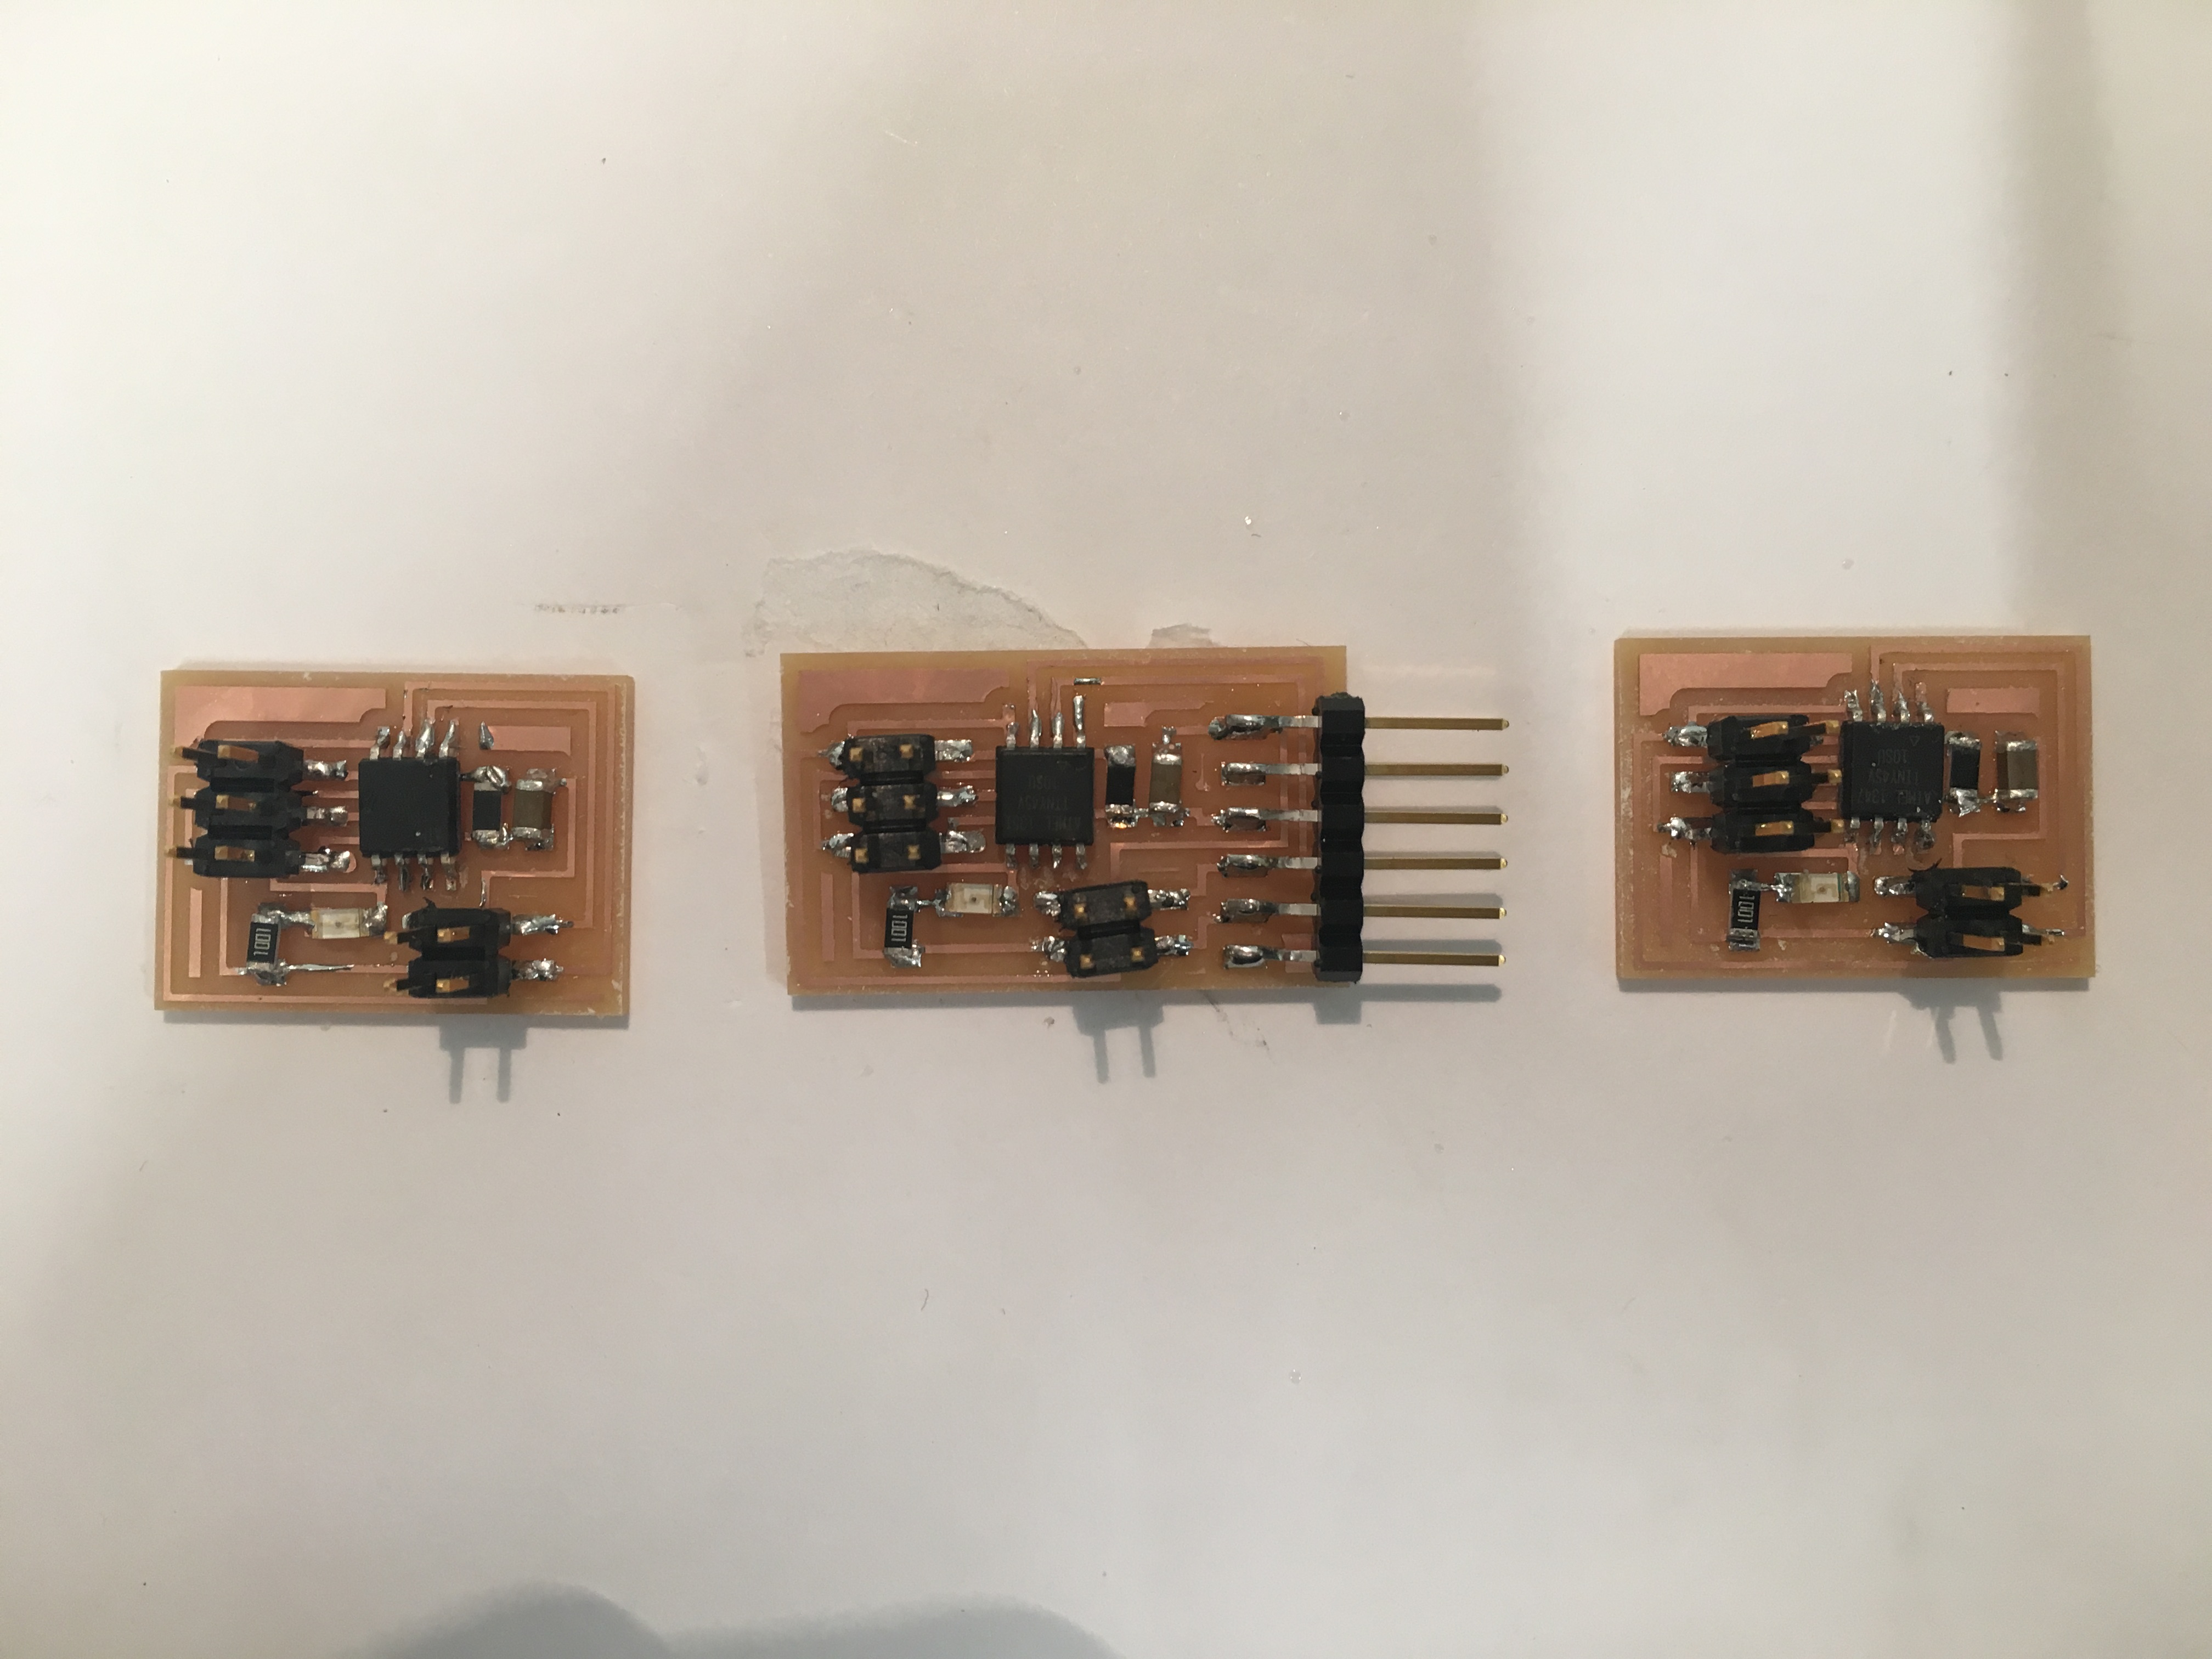
There are a couple of node boards and a master bridge board that connects to the computer. I built all three of these boards
Now, I needed to program the boards. Before, I always used my programmer to program the boards, but this time, someone introduced me to the AVR programmer! It was much better (and much more expensive) because it had a light indicating whether it was connected or not. The light was green so I thought that everything was fine But when I went to actually program the board, I was getting an error message saying that the board could not be programmed. Hmmm.
I tried using a ribbon cable that connected to the microcontroller instead of the 2x3 header and then the board started to program! Which means there was probably something wrong with the connections between the 2x3 header and the microcontroller. I then programmed the other two nodes, and sent data using CoolTerm. The boards responded as they should: All the boards blinked when a character was received and the board with the same node id as the character blinked again.
Designing a new board
Now that I knew how to read input from the potentiometer and communicate across boards, I needed to join these two functions together into one board! I would also be adding output devices (four LEDs – green, orange, red and blue) to this new board. The first thing I knew when designing the board is that the Attiny 45 would not have enough pins for all the functions I wanted (reading output of the potentiometer, lighting up the four LEDs and communicating). That means that I would have to design the board with an Attiny 44 instead of an Attiny 45. This is not as easy as it sounds! The two microcontrollers have different pins, and different instructions that need to be written to get things to work. From switching the Attiny 45 to a Attiny 44, I got to read the datasheets of the microcontrollers and I also had to understand the C code!
So I went ahead and designed the new board in Eagle. This new board needed to have four LEDs, a potentiometer, and serial communication. To know which pins to hook up to what, I looked at the Attiny 44 datasheet which has a nice schematic of it. [datasheet] [picture of schematic]. I was able to design a board with none of the routes crossing and then I was ready to make the board! I made the route thickness less than usual (0.010 instead of 0.016) to allow the routes get in between components to minimize crossing.
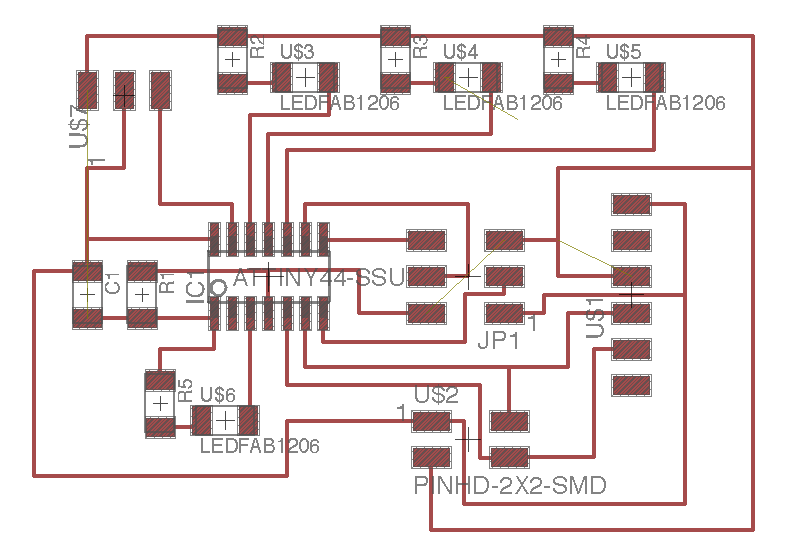
This is the schematic: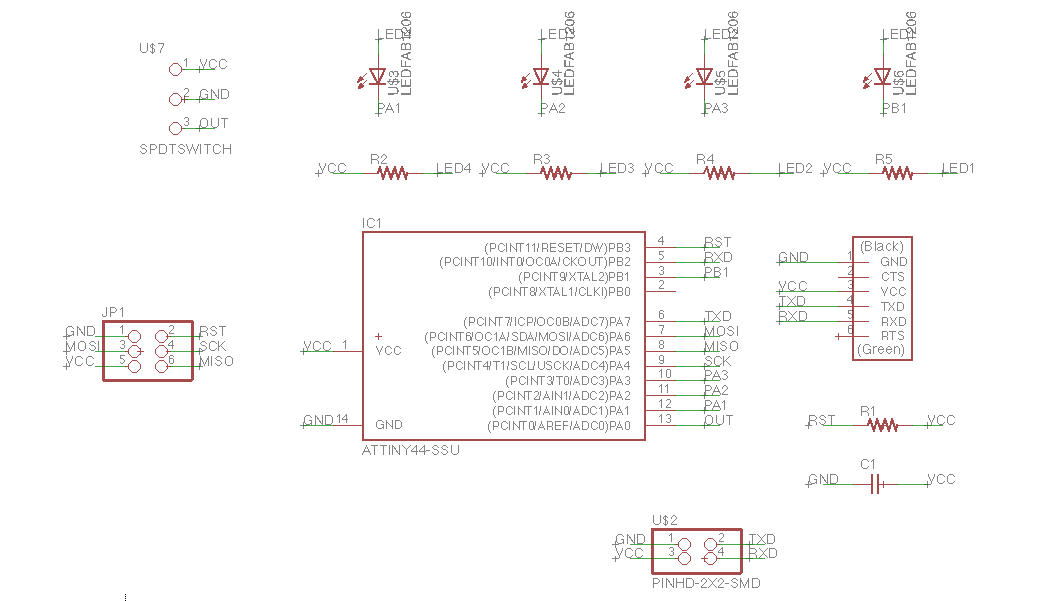 This is the board:
So I made the circuit on the Roland mill and when it was finished it looked like this! It failed.
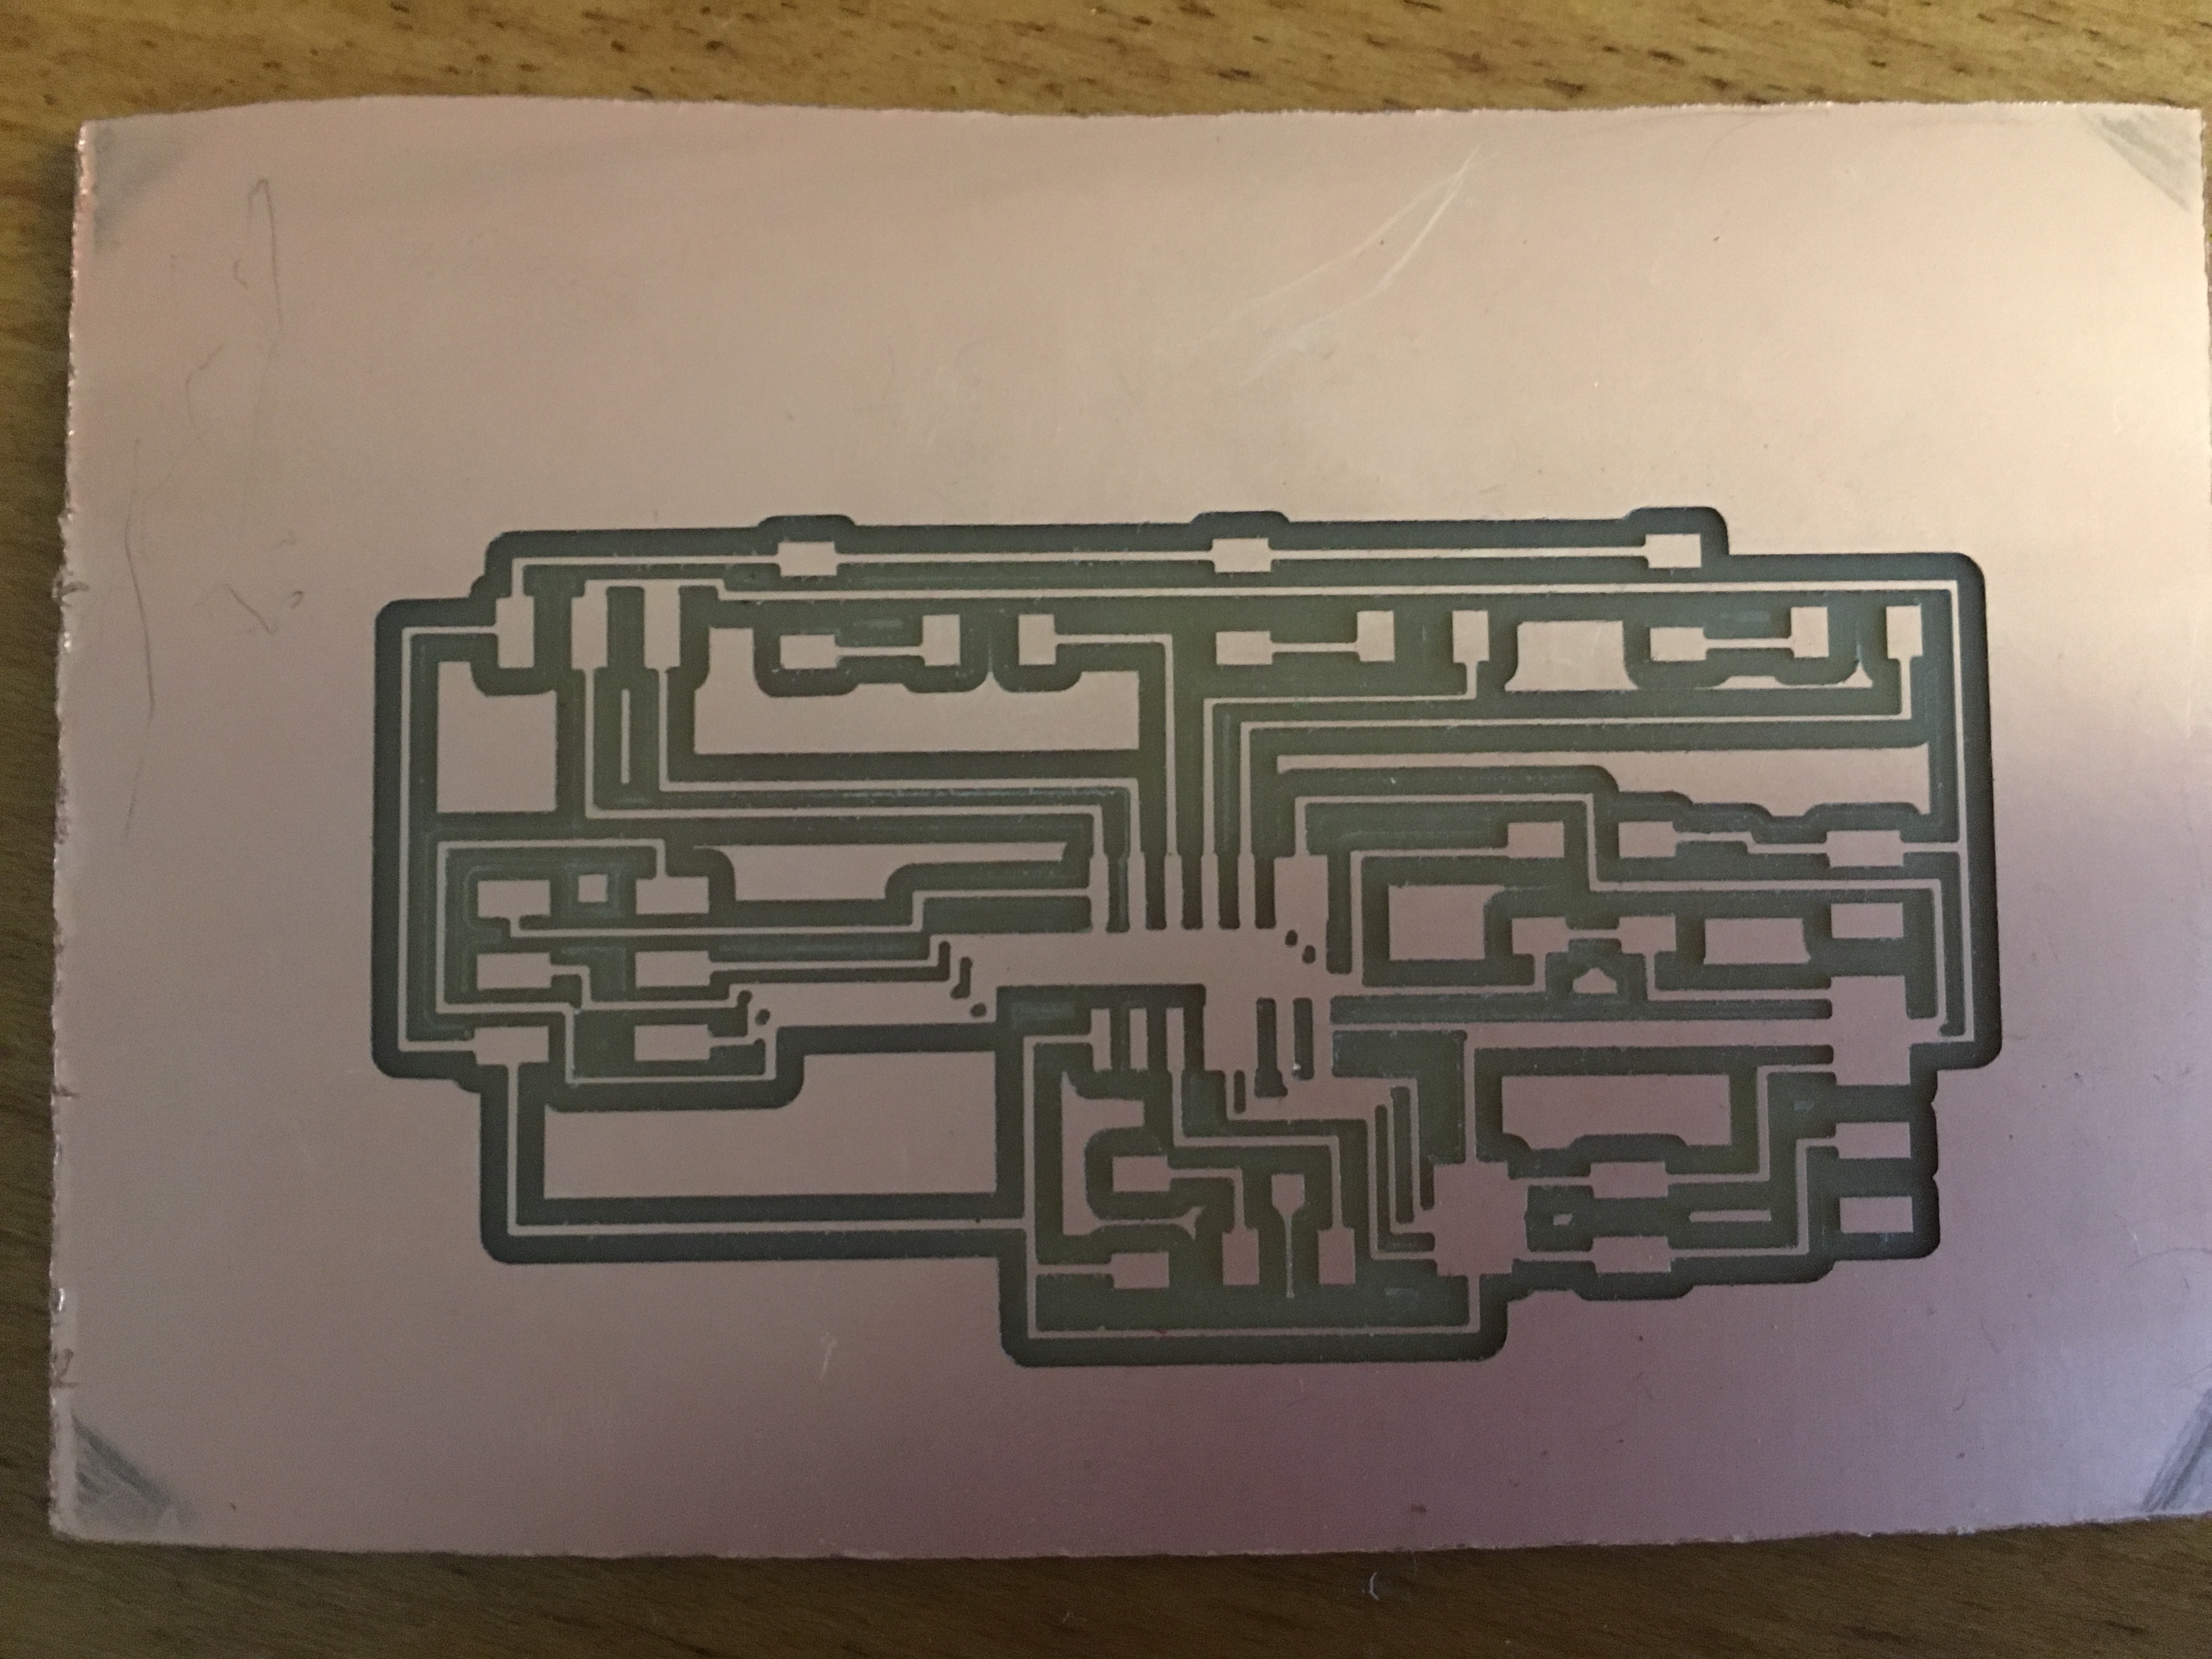
It looks like I added too many lines in between the components. I was a bit concerned about making the routes smaller, and it looked like making it smaller wouldn’t help so I decided to re-design the routes of the board so to also minimize how many routes go in between components. I actually discovered later that the Roland Mill makes the routes much thicker than the Shopbot, and that if I had made the circuit on the Shopbot, it probably could have worked (more on that later). So I spent some time re-designing the board – trying to minimize crossovers and routes in between components. In the end, I came up with a design that required just one crossover. I made this board on the Roland Mill and I was ready to stuff it.
This is the first time I decided to use the microscope to stuff the board. After making the boards before for the networking and communication, and running into soldering problems, I decided to be more careful and exact with the soldering so that I would not run into any connection problems. At first it was a little weird using the microscope, but towards the end I liked it! I was able to see every detail and at the end of it, I was very confident that there were no soldering issues because the microscope allowed me to be so precise. The bad side of using a microscope is that it did take longer, but probably with more practice, I could become just as quick, if not quicker, than not using a microscope.
Testing the boards
Moment of truth to see if my design works! First, I wanted to test whether I could receive input from the potentiometer on the new board. Because I was using an Attiny 44 instead of an Attiny 45, I needed to made some changes in the code. I also changed the serial port in the code to the correct one. First, I changed the pins of the potentiometer output and LEDs. Then I ran it, and the code did not recognize the pins PA7 (which is a pin on the Attiny 44 but not the Attiny 45), so I realized that I have to write in the code that this is an Attiny 44 instead of an Attiny 45. I found that code in the makefile – so in the makefile, I changed ‘45’ to ‘45’. Next, I had to change the A/D. In the Attiny 44, the A/D is different. So I changed it from:
									   ADMUX = (0 << REFS2) | (0 << REFS1) | (0 << REFS0) // Vcc ref
									      | (0 << ADLAR) // right adjust
									      | (0 << MUX3) | (0 << MUX2) | (1 << MUX1) | (0 << MUX0); // ADC4
									   ADCSRA = (1 << ADEN) // enable
									      | (1 << ADPS2) | (1 << ADPS1) | (1 << ADPS0); // prescaler /128
									  ADMUX = (0 << REFS1) | (0 << REFS0) // Vcc ref
									      | (0 << MUX5) | (0 << MUX4) | (0 << MUX3) | (0 << MUX2) | (0 << MUX1) | (0 << MUX0); // PA0
									   ADCSRA = (1 << ADEN) // enable
									      | (1 << ADPS2) | (1 << ADPS1) | (1 << ADPS0); // prescaler /128
As you can see, the differences are that the Attiny 44 has MUX0 up to MUX5 whereas the Attiny 45 has MUX0 up to MUX3. The Attiny 44 does not have a right adjust, and it also has ADCSRB, but when I added that the code did not work, so I left that out. In order to find out what the bits of MUX0 up to MUX5 were, I looked at the data sheet! I found the answer on page 146 of the data sheet! PA0 is the pin where the output of the potentiometer was hooked up and that was the pin that I initialized in the A/D. This pin was MUX0 = 0, MUX1 = 0, MUX2 = 0, MUX3 = 0, MUX4 = 0, MUX5 = 0.
Now that I changed the code, I tested the potentiometer output in CoolTerm, and it worked! It was pretty smooth – no major bugs. Now I needed to test the networking and communication – this is where all the bugs were revealed
To test the networking and communications, I used CoolTerm to send a character to the board. But things were getting weird. I wanted to test it with one LED first (rather than all four). When I tested it with one LED, one of them lit up when it was programmed (and it wasn’t supposed to do that). So I tried with another LED, and then this one didn’t light up when it was programmed, but then it didn’t blink either. When I tested it with one LED, another LED light up!
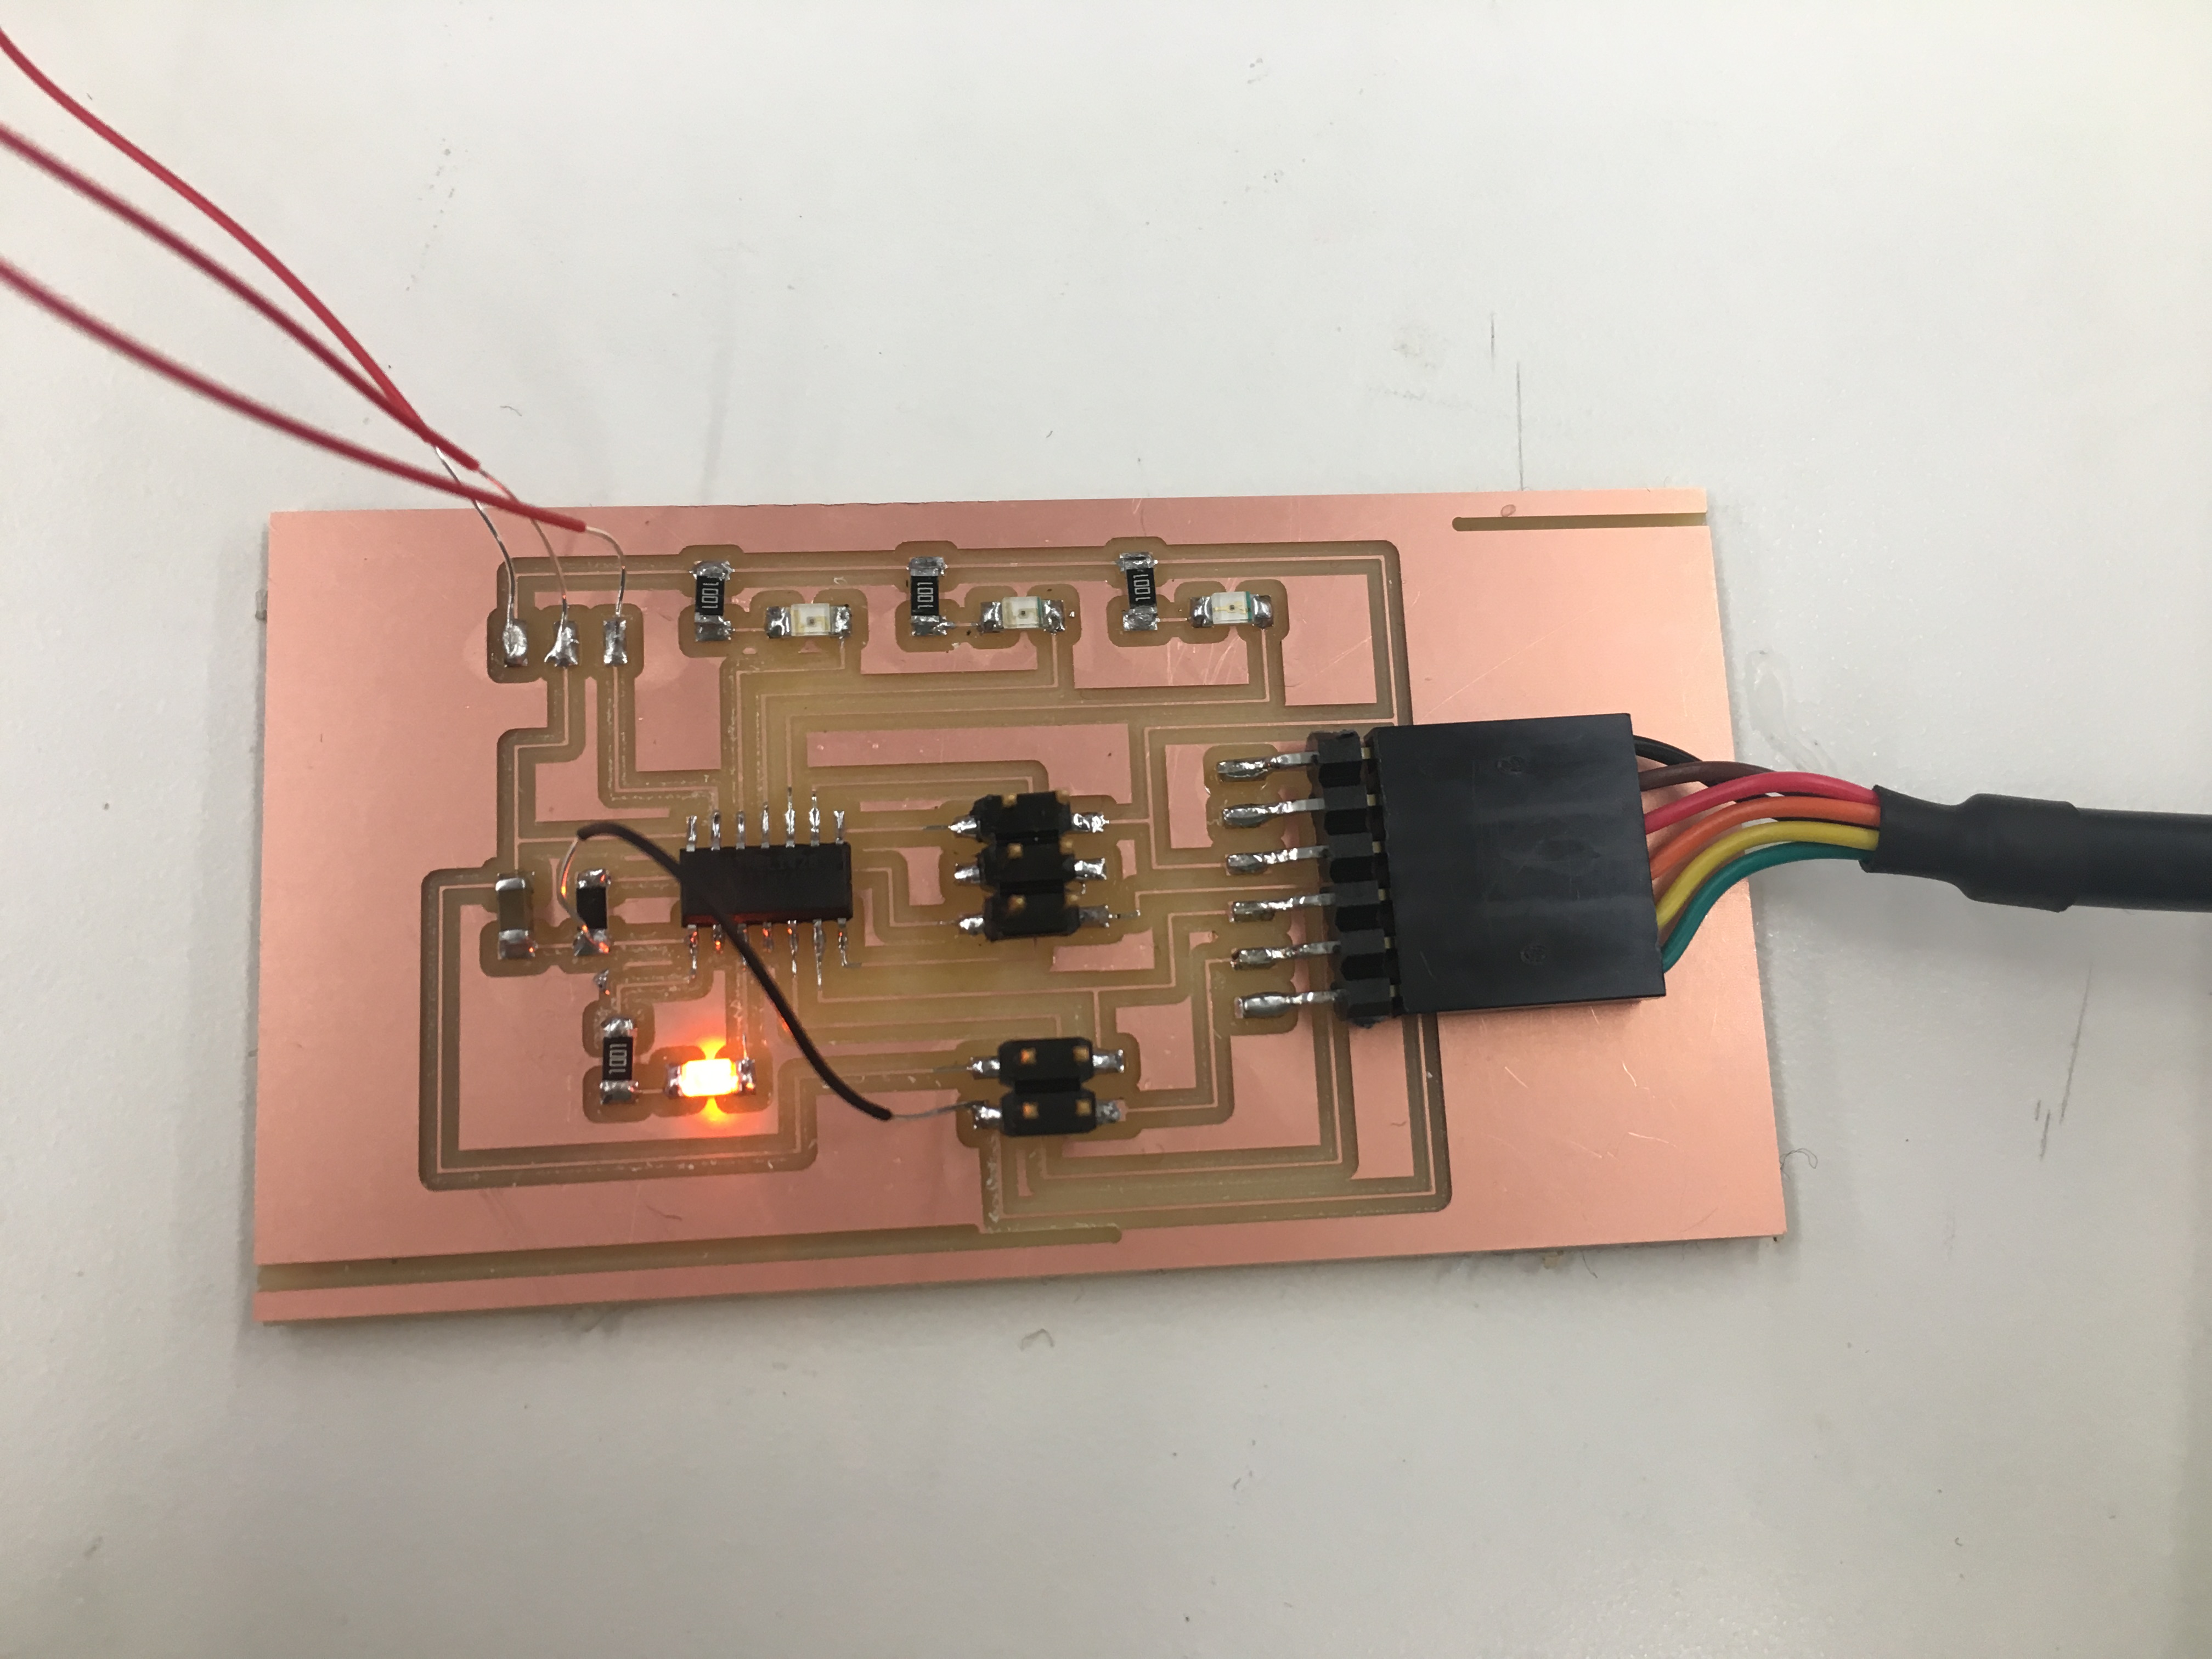
Picture of light shining when it shouldn't
I was getting a bunch of weird stuff with no obvious pattern. I was pretty confused now, and wasn’t sure what was wrong – was it the design? Was it the soldering? Was it the code? Since I had done all of these parts myself, it could be any of them! The design of the board seemed pretty solid. I was confident with the soldering. I was not sure about the code so I had a look at that. I noticed that the code was defining PORTS and DIRECTIONS so I tried changing them but I wasn’t really sure how they connected to the rest of the code. Soon, I figured out that there was a bug in the code (and also design)! I had TX on PA7, RX on PB2 and was defining the serial ports as PORTB and serial direction as PORTB! But TX was on port A so that was why the lights weren’t blinking because it wasn’t even receiving the data on the correct port. I also had three of the LEDs on PA1, PA2, PA3 but the fourth one on PB1, and I was defining the LED ports as PORTA and the led direction as PORTA but one of the LEDs was on PB1 (this was the LED that never lit up). So I decided to make my life easier and switch some of the pins on the design of the board so that the serial pins would be on the same port and the LED pins would be on the same port. I hooked up TX to PB0 instead of PA7 and the one of the LEDs to PA7 instead of PB0. This added more wires to my circuit board, but it did the trick. Finally, it worked when I changed the ports and directions!
Now I had both the potentiometers and networking and communication and output devices working on the same board. Now I could hook up two potentiometers to send their output through one serial port
Everything worked great, up until when I sent both ‘0’ and ‘1’ to the boards. Of course, since they were on the same serial port, they were sending data mixed together! Which means that I wasn’t getting any coherent data. I tried different methods to get coherent data from two potentiometers through one serial port. One of these methods was to time the sending of the data. In this case I would program on one board to send the data immediately and then I would program on another board to send the data after a delay. Similarly, another method was to have one board send its data, and then have another board programmed to wait until it finished and then send its data. In my opinion, these methods were ‘hacky’, because what would happen if there were 100 devices? Would there be a 100 second delay to send the data? That wouldn’t be good. So I decided that it would be best not to send two potentiometer’s output through one serial port.
So I set up two serial ports and recognized them both in the nodeJS app. I wrote some javascript code to send both of the values from the potentiometers to the web page, and then the web page would find the average of them and display that. I sent the two values as a JSON string and then converted it to a JSON object once it was received to get the individual value results. I was having some problems with global variables in javascript. It turns out that the bytes that are defined when you get the data needed to have a scope outside of the opening port function, but that wide scope was causing problems with two of the serial ports. The bytes were mixing together because the scope of the byte variables were not within the function that opened that own serial port. So to fix this, I renamed the variables for the second serial port and that worked.
I was able to now read the potentiometer input from two circuits. Now, I wanted to adjust the output devices. For this, I wanted to make an LED blink according to what ‘level’ the student has turned to. So as mentioned in the overview of this product, the student can rate how complex the lecture is at any given point in time. There are also three levels – easy to understand (green light), medium to understand (orange light), and hard to understand (red light). Since the student just has a potentiometer, it is important for them to know what level they are currently rating the lecture. So I added the green, orange and red lights to show that. When a student starts at the lowest value (easiest to understand), the green light blinks; when the student turns the potentiometer higher, at a certain level the orange light blinks; the student can continue to turn the potentiometer and then at another level, the red light would blink’. In order to do this in the code, I defined the three led pins, and wrote if statements that checked the current value of the potentiometer and flashed the correct light according to what the value currently is. The lights weren’t flashing when there were multiple LEDs, so in order to change that, I had to write:
									               set(led_port, led_pin_green);
									               output(led_direction, led_pin_green);
before flashing the LED and that worked!
I decided not to add the dimming light because it was a redundant feature. Instead I have the fourth LED (blue) blink when the lecture starts and the data is being read from the potentiometer
When I made the second circuit, I used the Roland Mill instead of the Shopbot, and the Roland Mill circuit had lines that were thicker! See below
Next, I had to create the nodejs app and user interface for seeing the average rating. I used charts from Canvasjs, because they had some code for updating a chart according to time passing by. To adapt it to my needs, I added code that would retrieve the average rating and then pass that into the y-value for the chart and then a new data point was added to the chart. I also added lines for the three different levels: easy to understand (green), medium to understand (orange), and hard to understand (red).
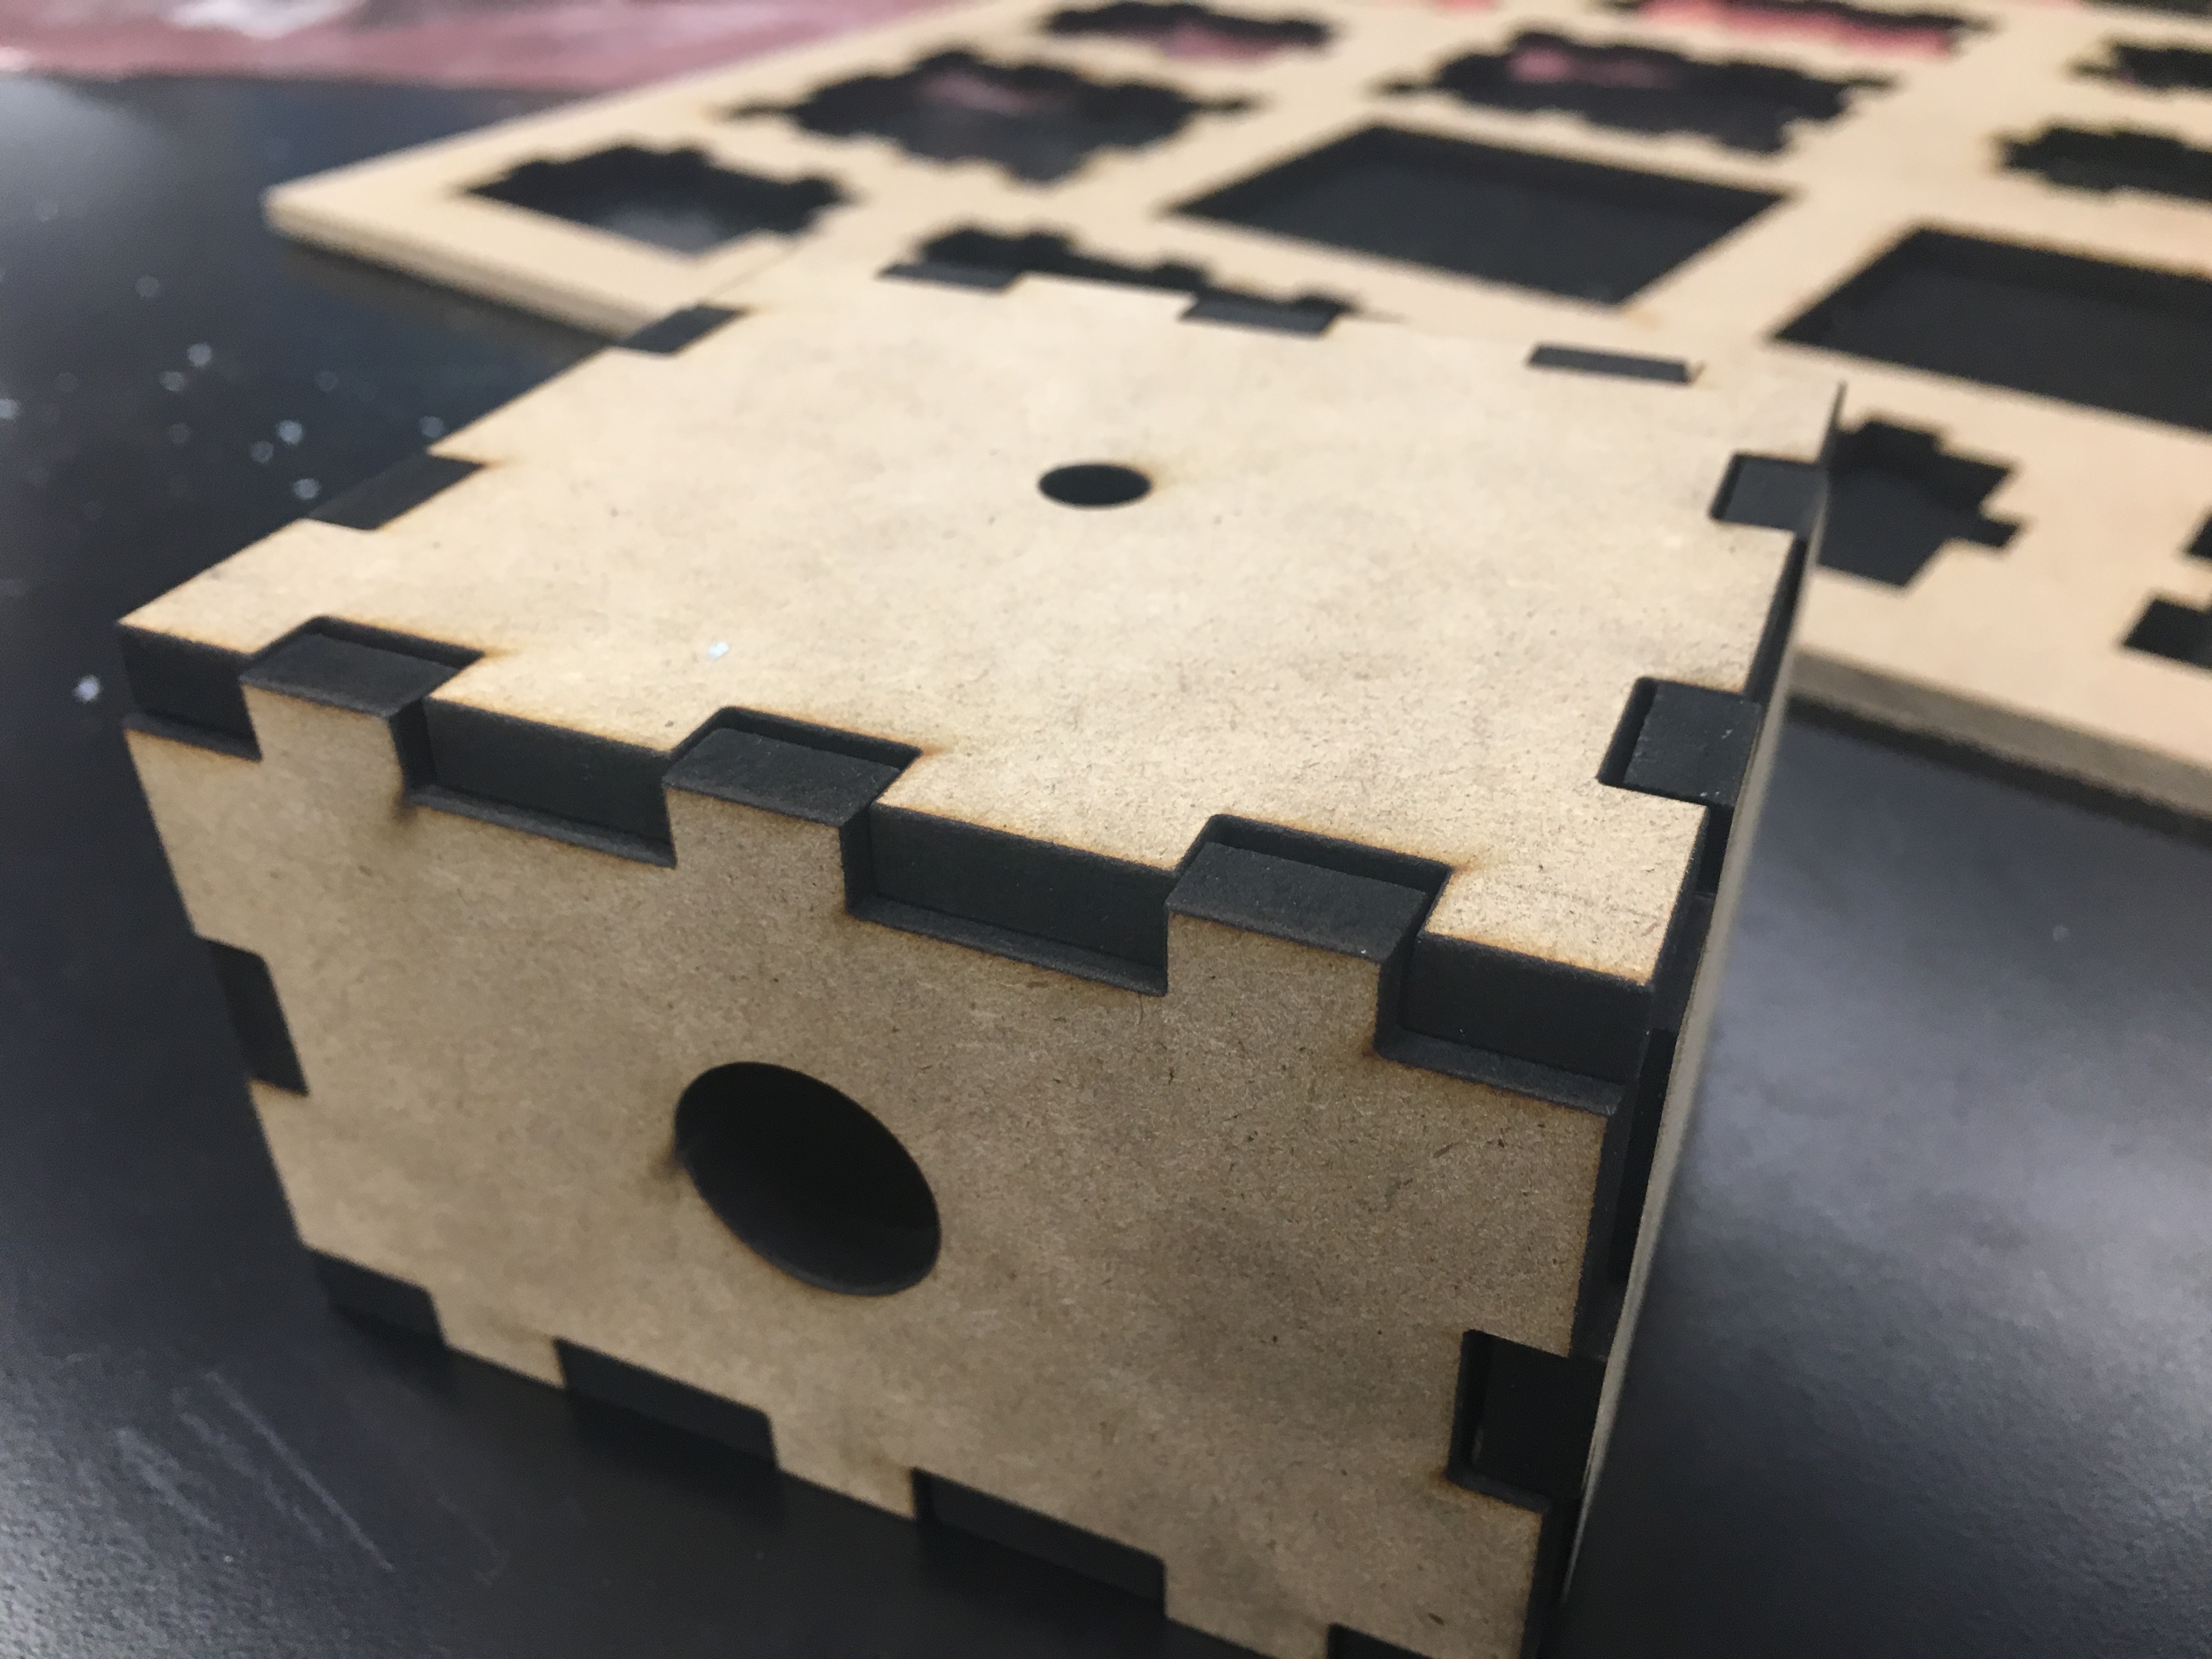
Physically making stuff
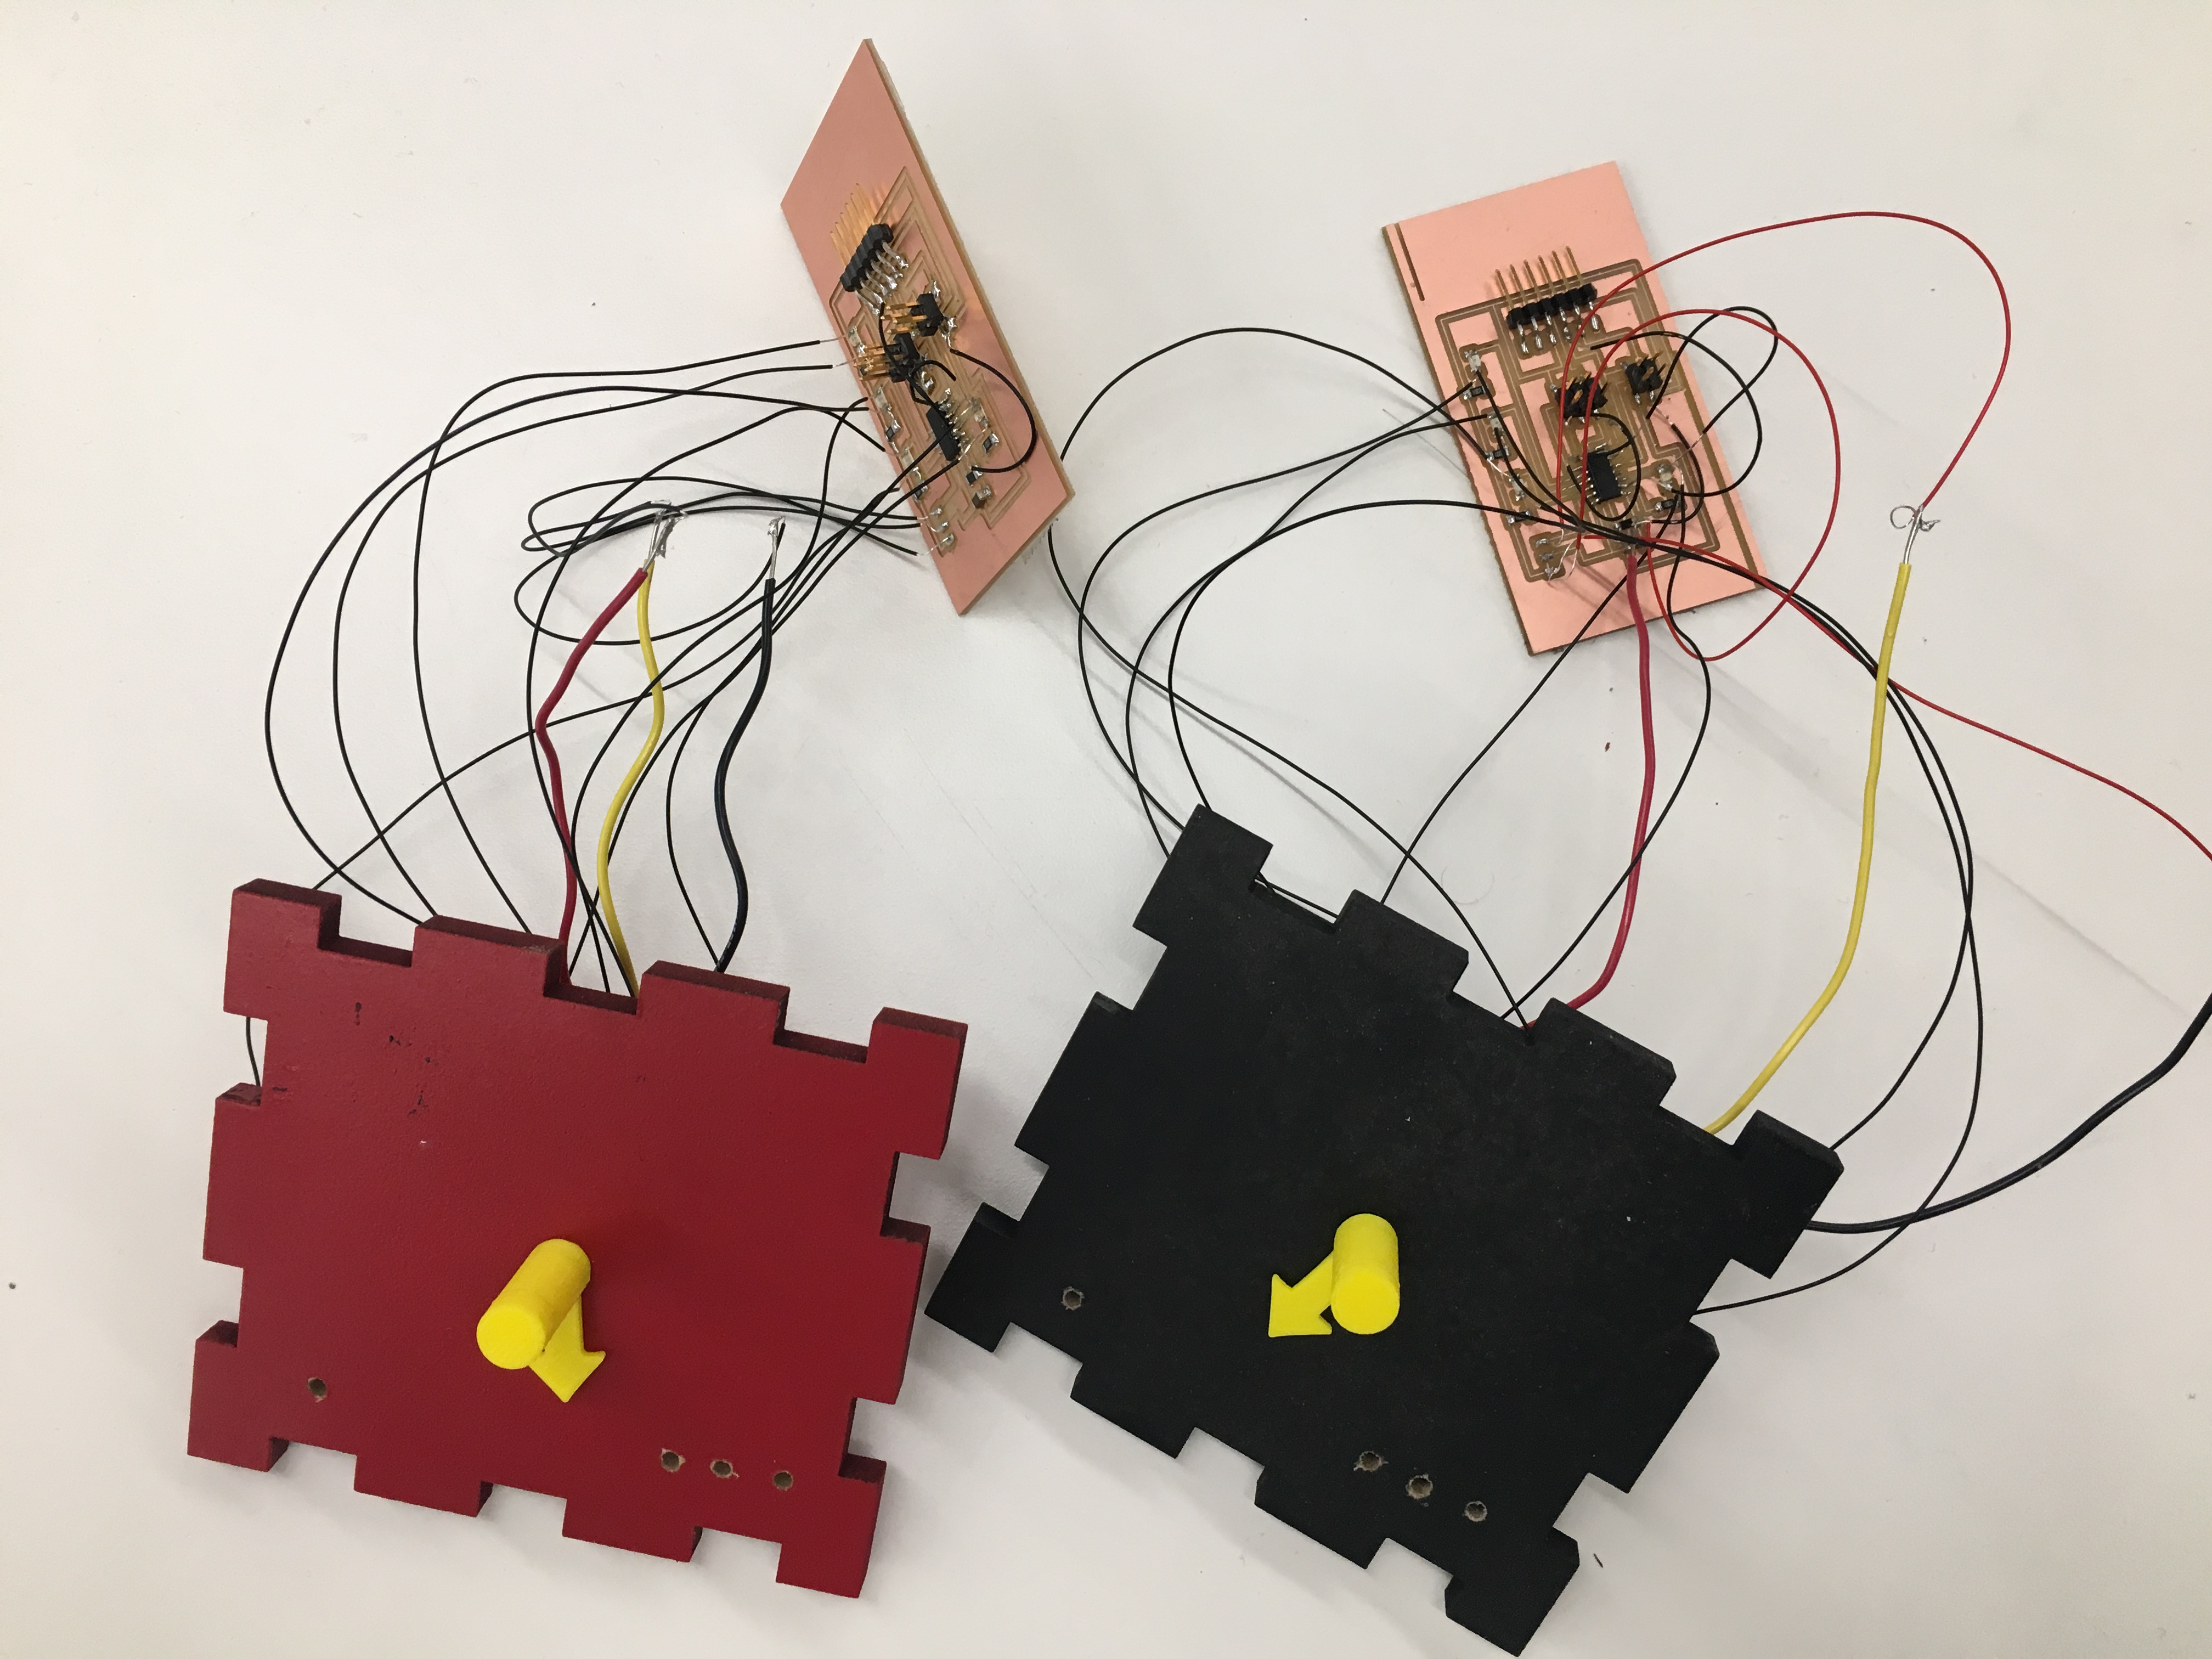
I did the circuitry, programming and physically making stuff in parallel. In order to make the ‘ClassRate’ boxes, I designed, and made a parametric press-fit construction box accounting for the lasercutter kerf. In order to see the process for that, check out the computer-controlled cutting week.
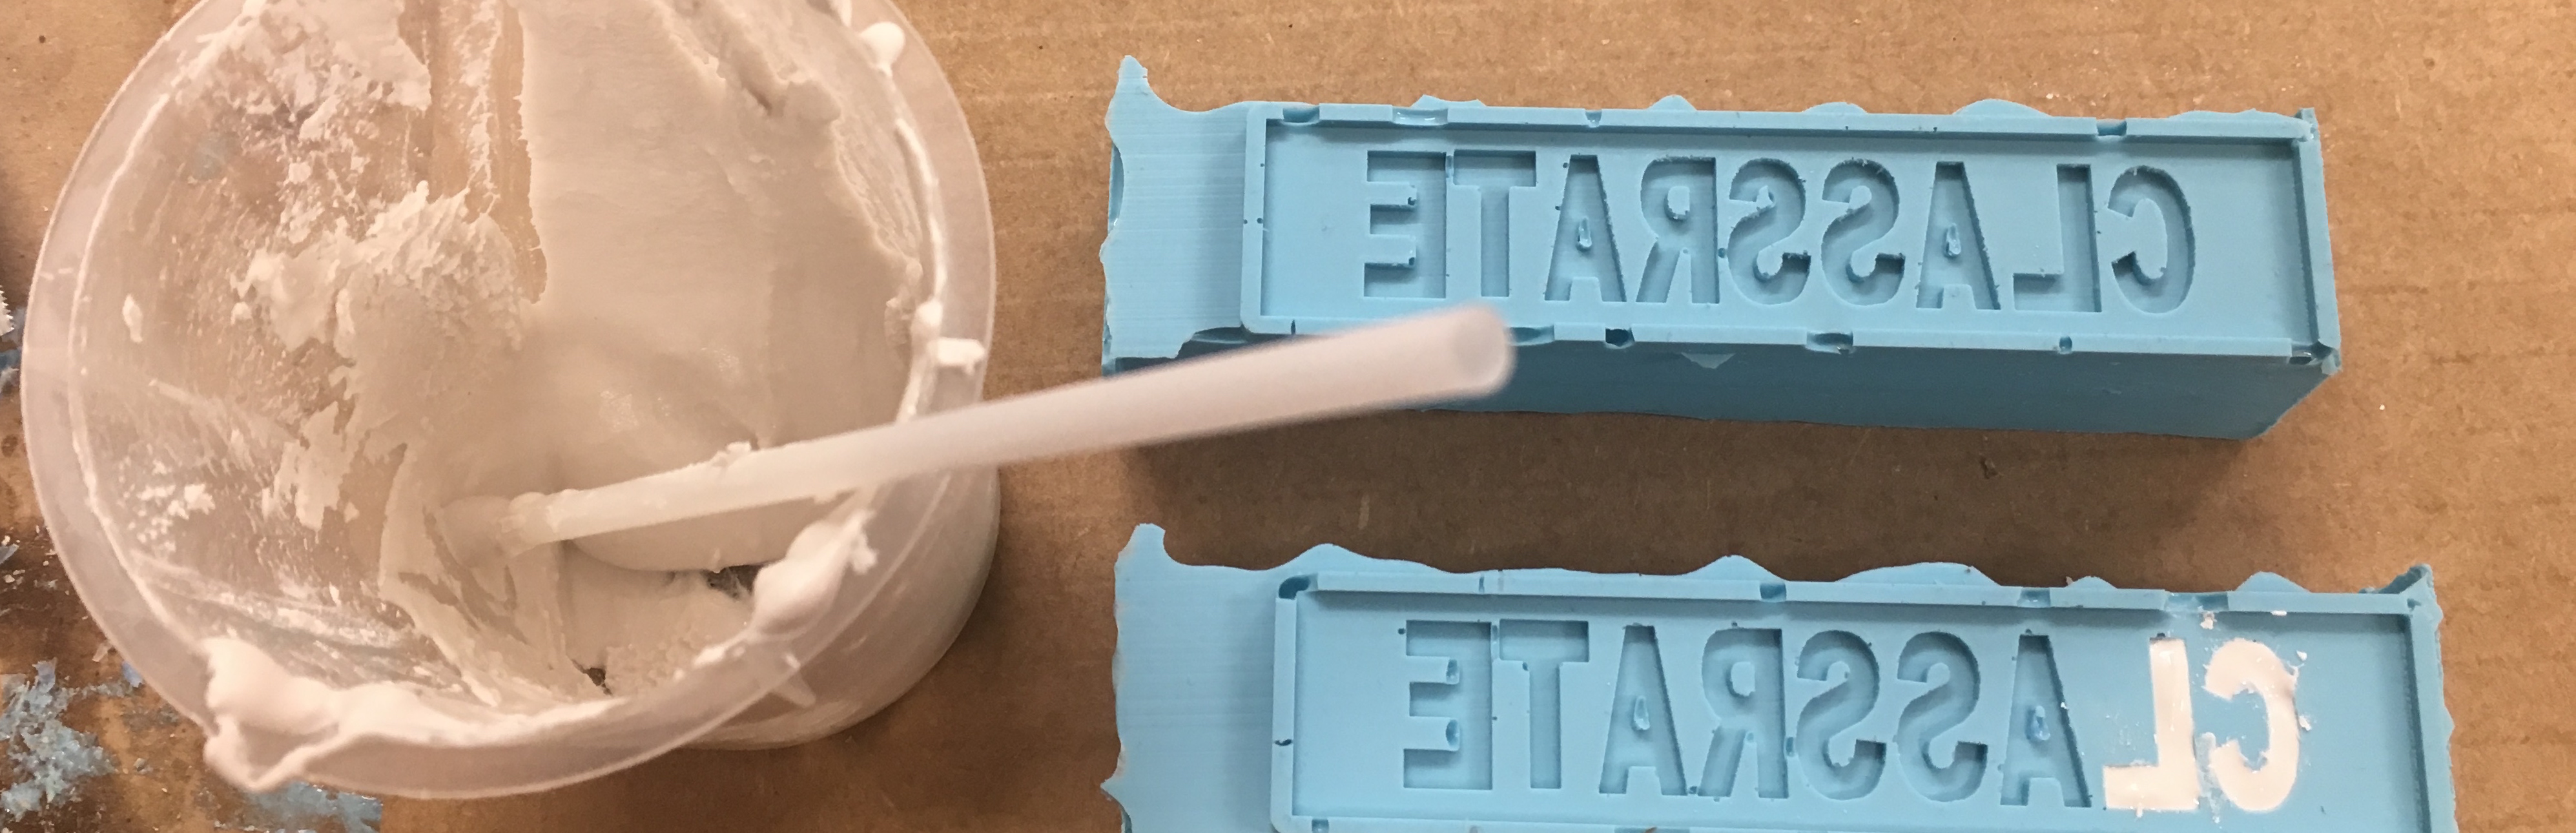
Next, I molded and casted the ‘ClassRate’ logo. In order to see the process for that, check out the molding and casting week.
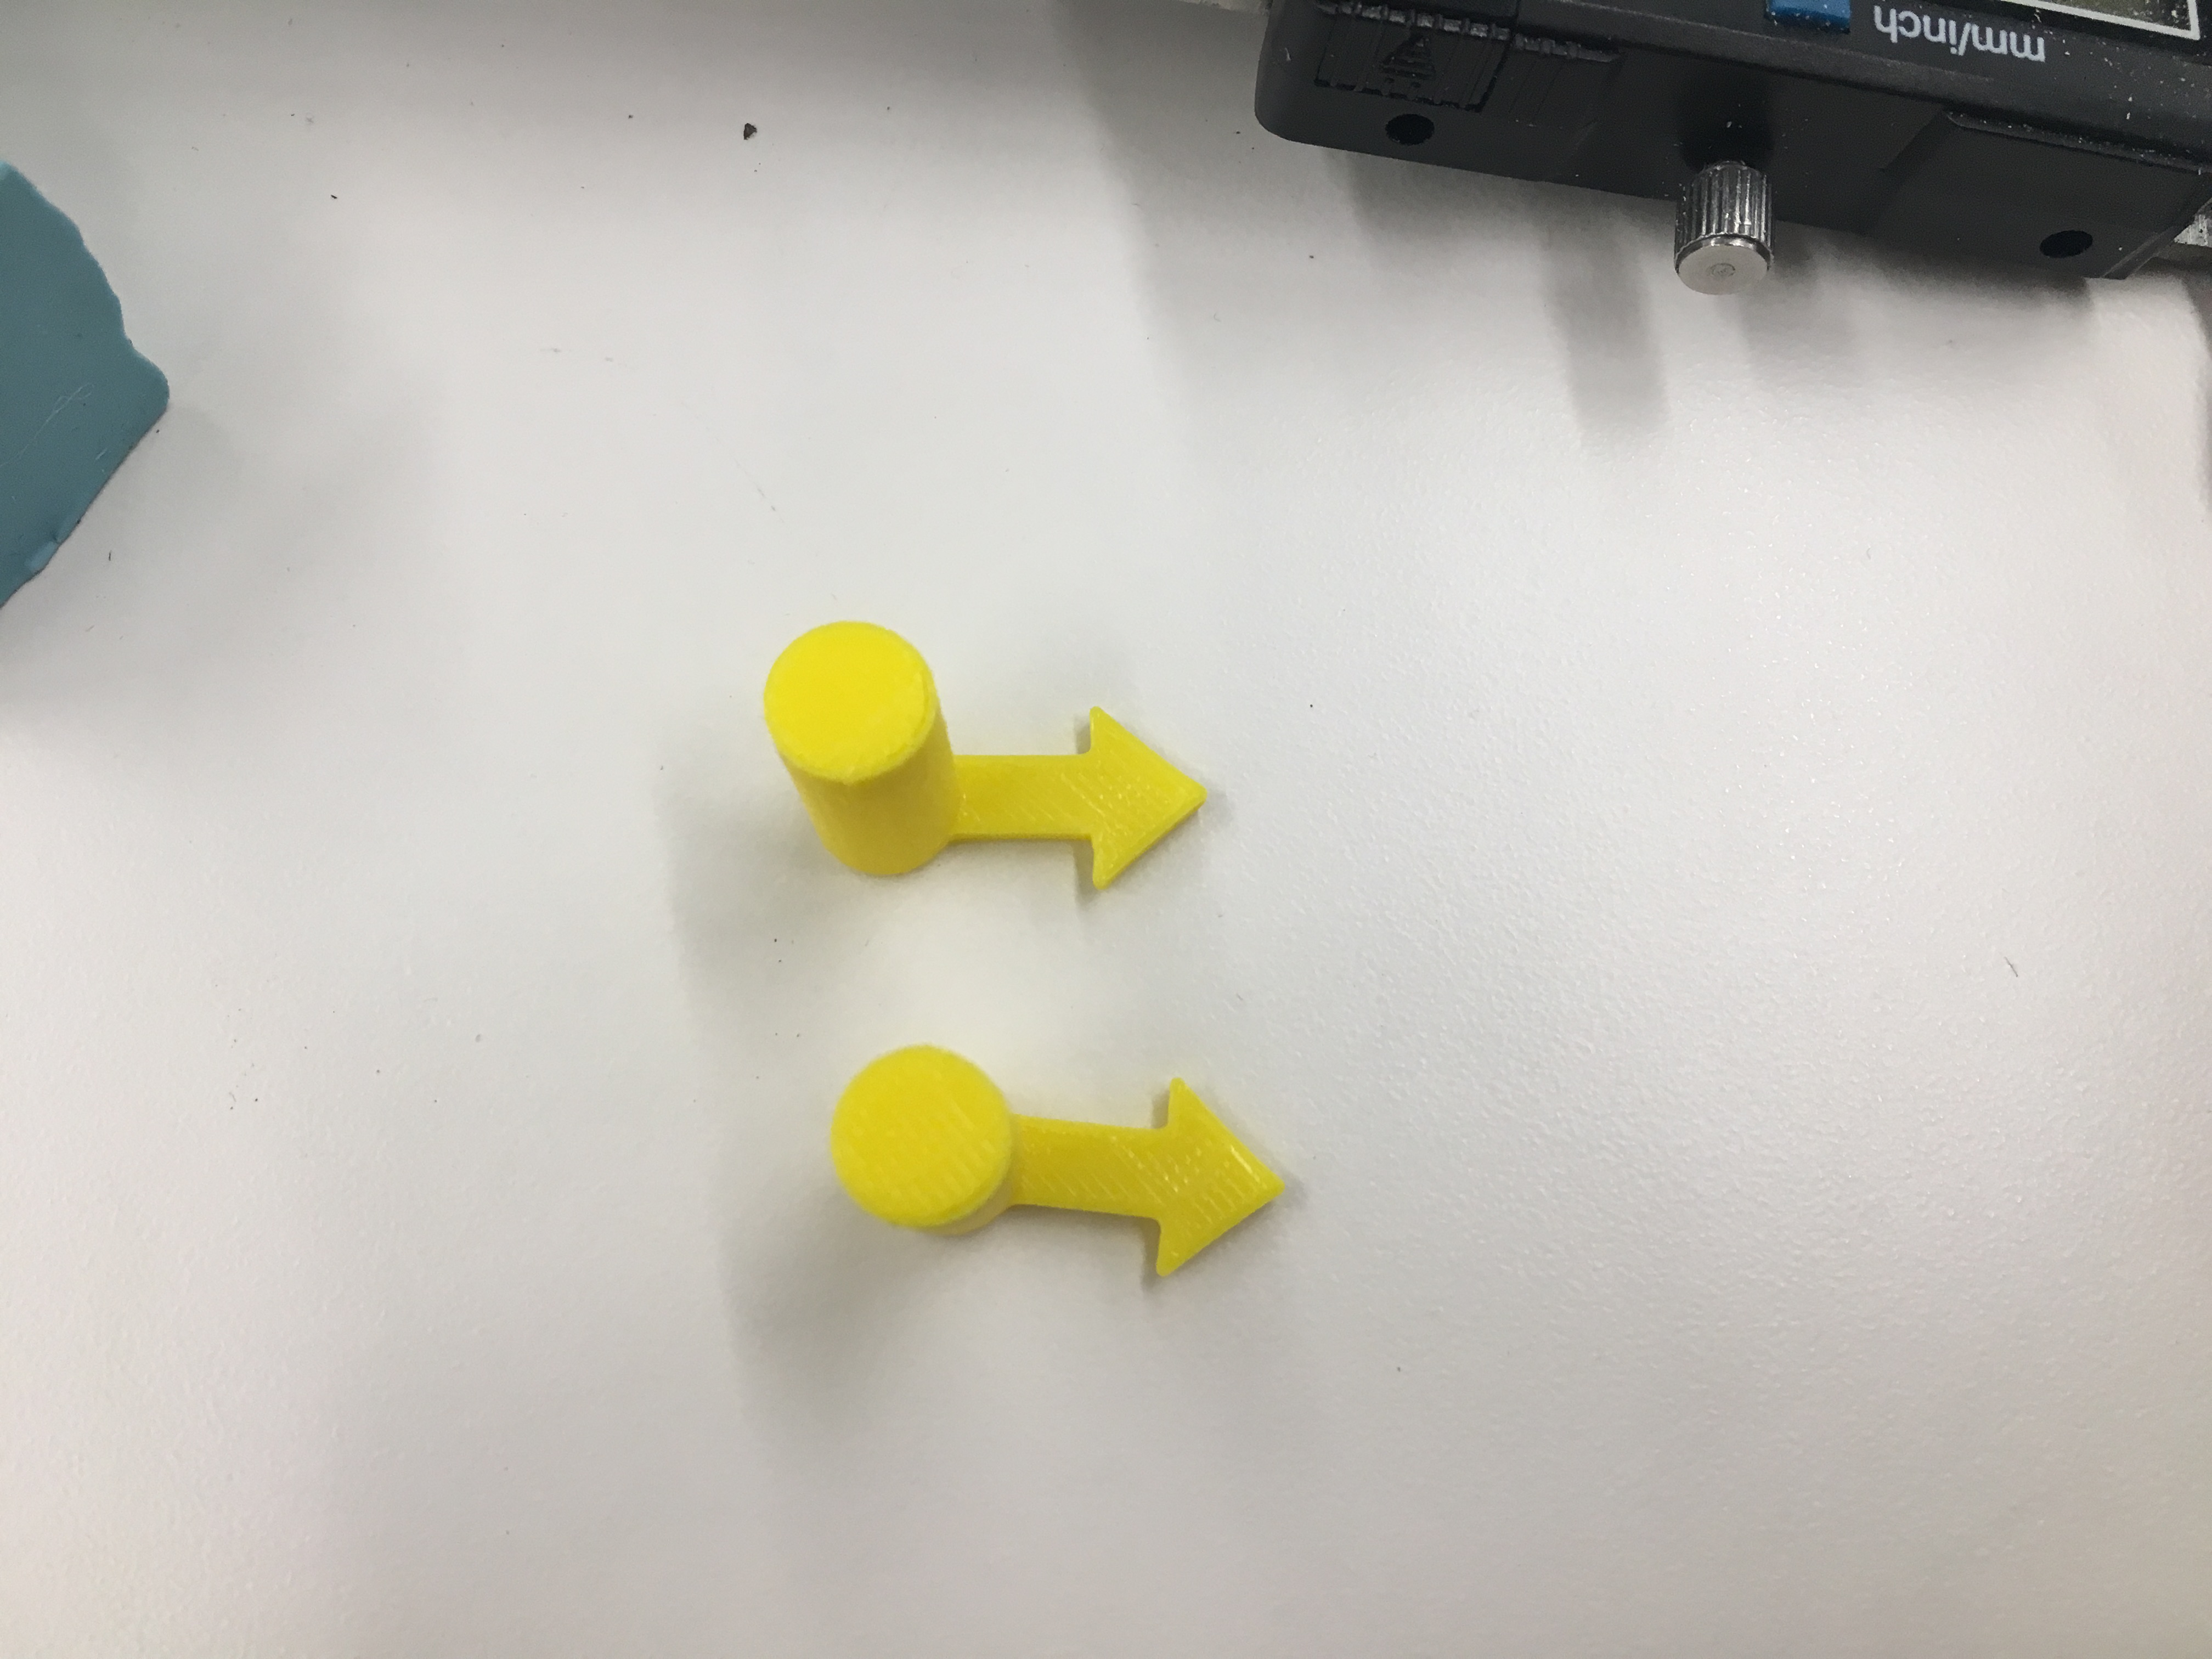
After laser cutting and making the circuitry, I tried fitting the circuits in the box, with the potentiometer sticking up through the hole on the top. Because the plywood was pretty thick (0.25 inches), the potentiometer ended up having hardly any space to twist with the fingers. So I decided to create a knob with an arrow on it to allow to turn the potentiometer easily and also to allow the student to see how far they have turned the potentiometric (they can see this with the arrow).
Design of the arrow-knob
I used TinkerCAD to create the arrow-knob. I created a cylinder and then attached a rectangle to it, and then I attached a triangle shape to the end of the rectangle. I created another cylinder as the hole and put that in the middle of the solid cylinder. I also elevated the arrow by a couple of mm to prevent scratching of the surface of the box. I measured the potentiometer knob’s diameter as 6.3mm and created the hole accordingly to that. I tried to 3D print it using the 3D Wox machine, but when I loaded the .stl file in the software, it was only going to make the arrow, not the cylinder! I discovered it was because the thickness of the wall of the cylinder was too fine. It was 0.7mm and I think it needs to be at least 1mm, so I changed the design so that the wall was 2mm thick instead. Someone also told me that I should add a semi-sphere to the top of the hole cylinder in the middle, so that the 3D printer wouldn’t add support structure inside the hole. Because the top of the hole was flat, the 3D printer would have to put up support structures to make the top of the hole flat, but it the top of the hole was curved, the 3D printer wouldn’t have to put support structures. So I added a semi-sphere to the top of the hole, and printed!
There were two problems with the 3D printed object: 1. The hole wasn’t large enough – it wasn’t fitting into the potentiometer knob. 2. The 3D printer added support structure between the floor and the elevation of the arrow, and those support structures were extremely difficult to remove and didn’t look nice. So I fixed both of these problems: I made the hole larger (7mm) and then I made the arrow on the same plane as the bottom of the cylinder (no elevation). I 3D printed again and it was much better. Everything was fine. But then, I thought it would be better to get the most optimal fit for the 3D printed arrow-knob, because the tighter the knob, the better it would be controlling the potentiometer knob. So with trial and error, the best diameter of the knob was 6.7mm.
When I added the logo ‘ClassRate’ to the top of the box, I realized that the arrow was too long because it collided with the logo, so I 3D printed the object again but with a shorter arrow
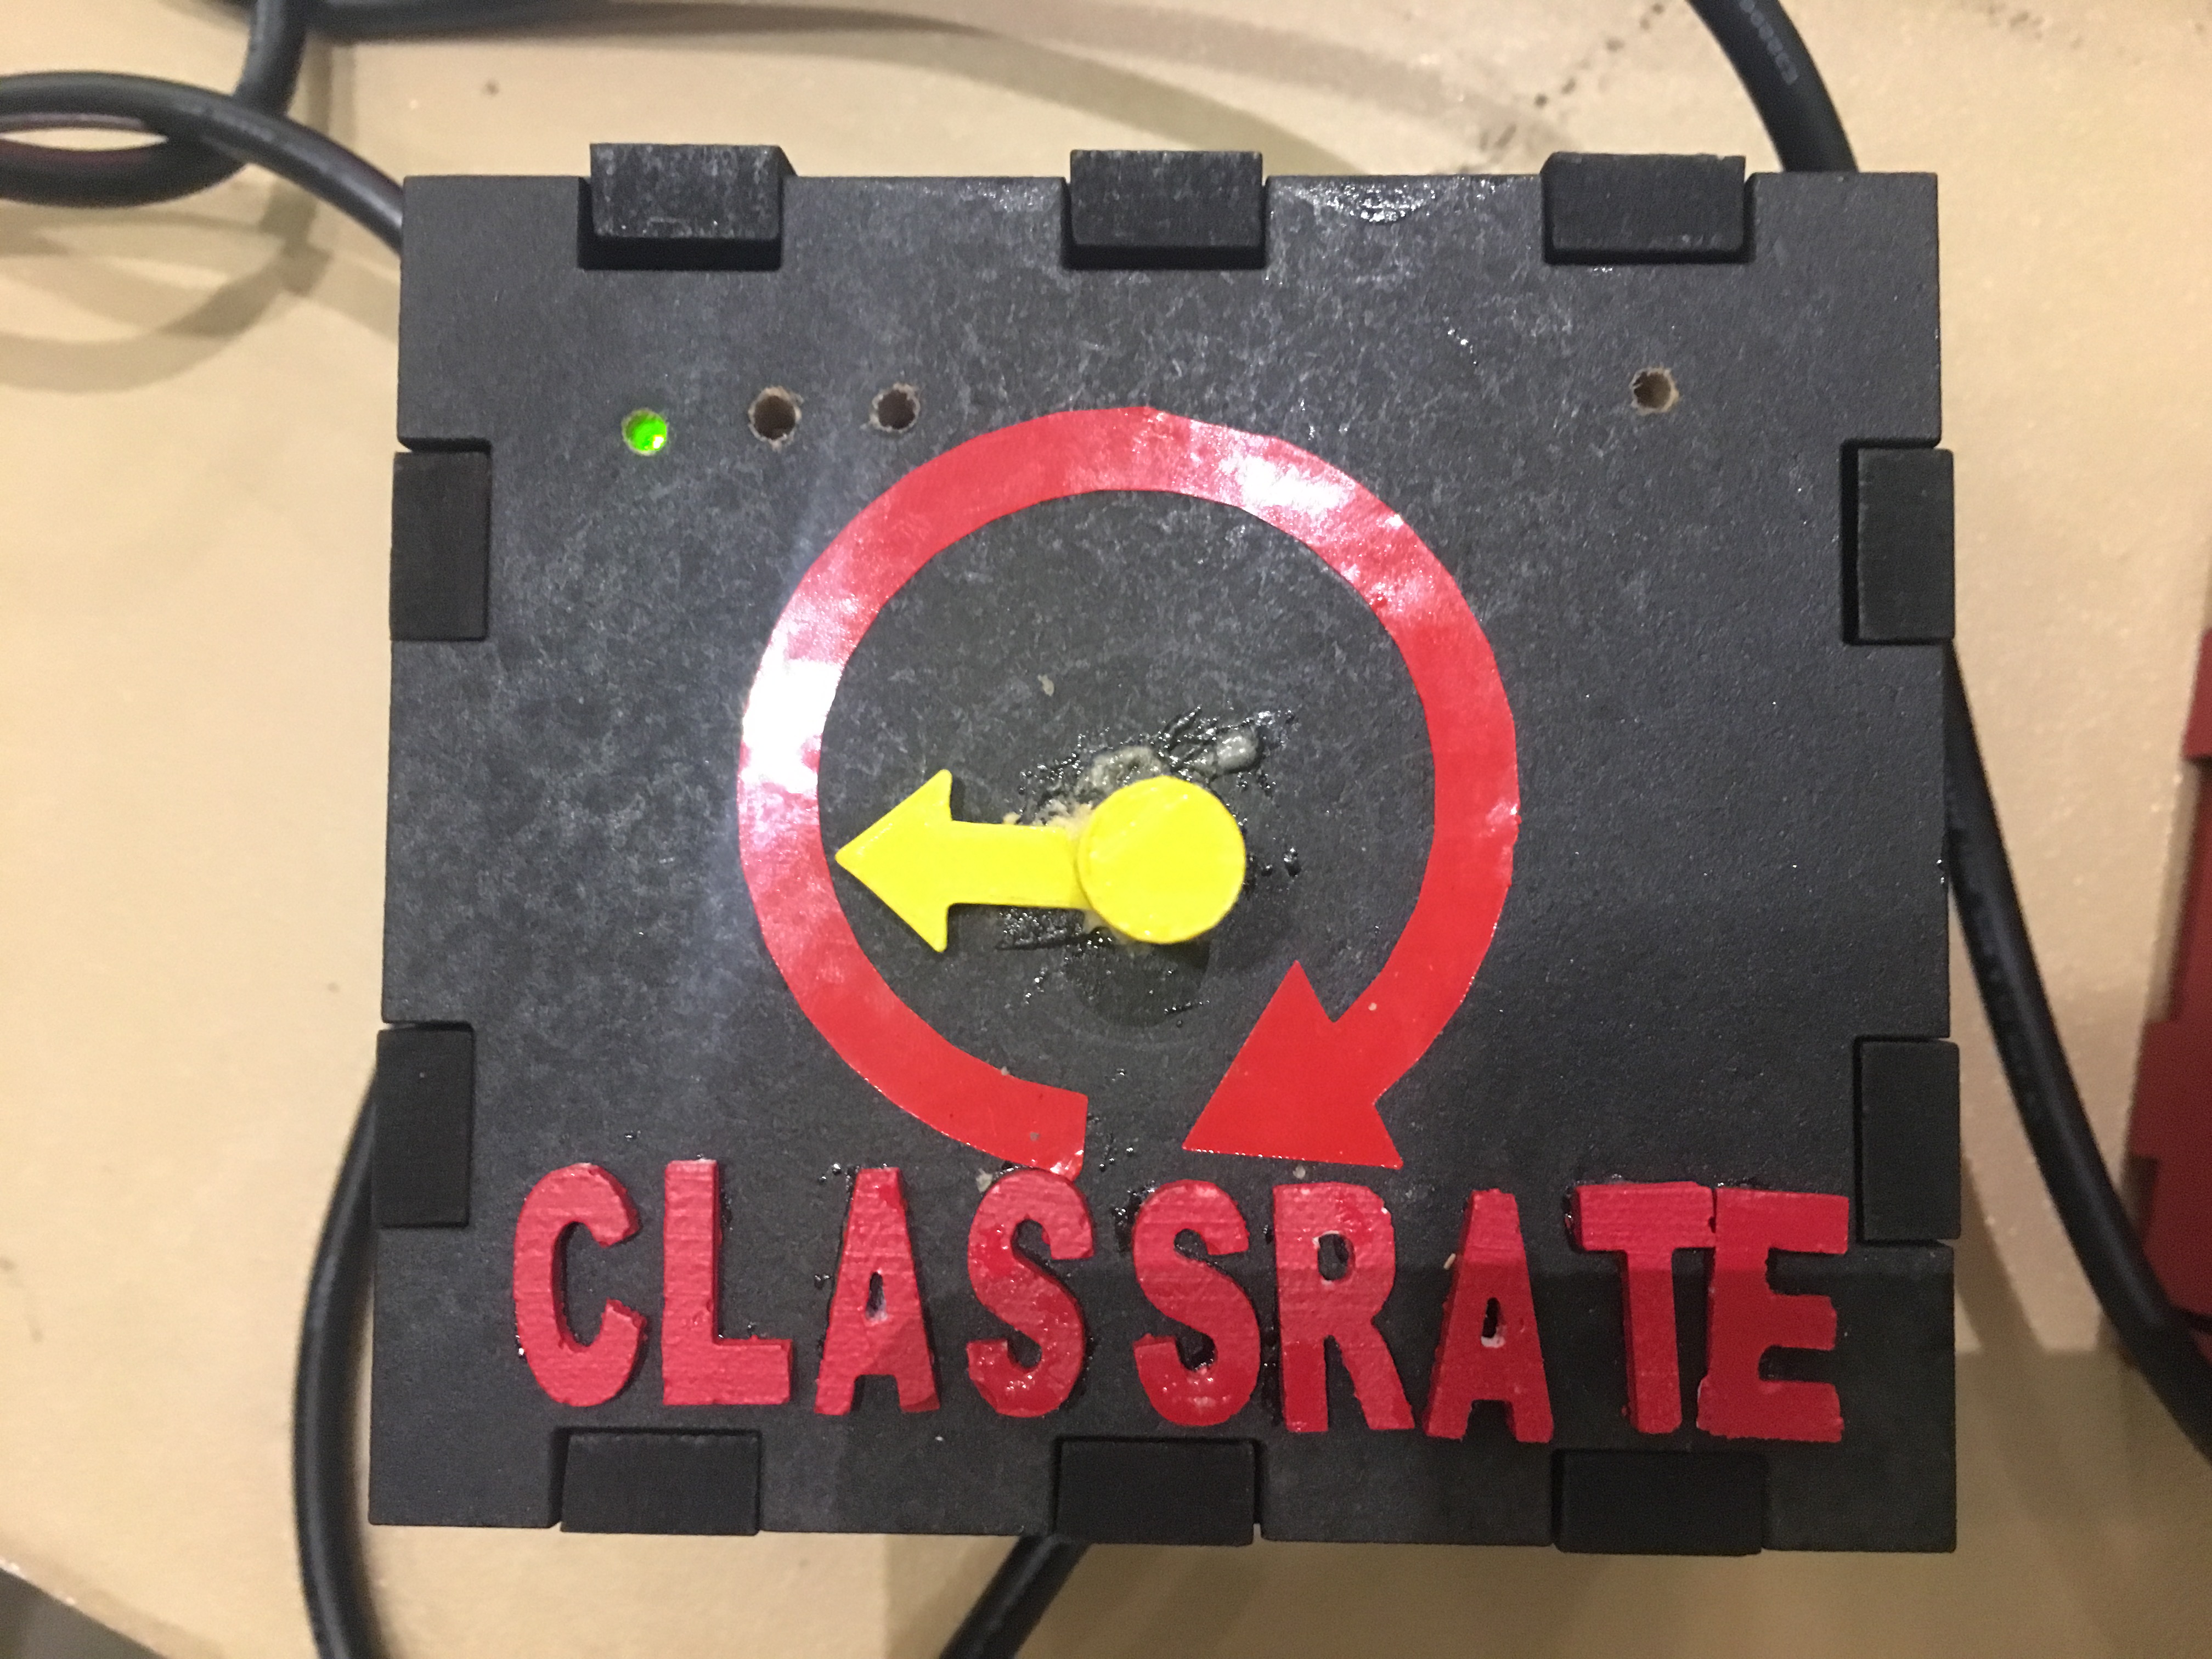
I wanted to show what direction the knob could be turned, so I used the vinyl cutter to create a vinyl sticker. I found a curved arrow image on the internet and used the vinyl cutter to cut it. I was running into weird errors with the command. The default command that was there did not work, but I managed to find the following command that did work:
print \\PHYS:
Putting it all together
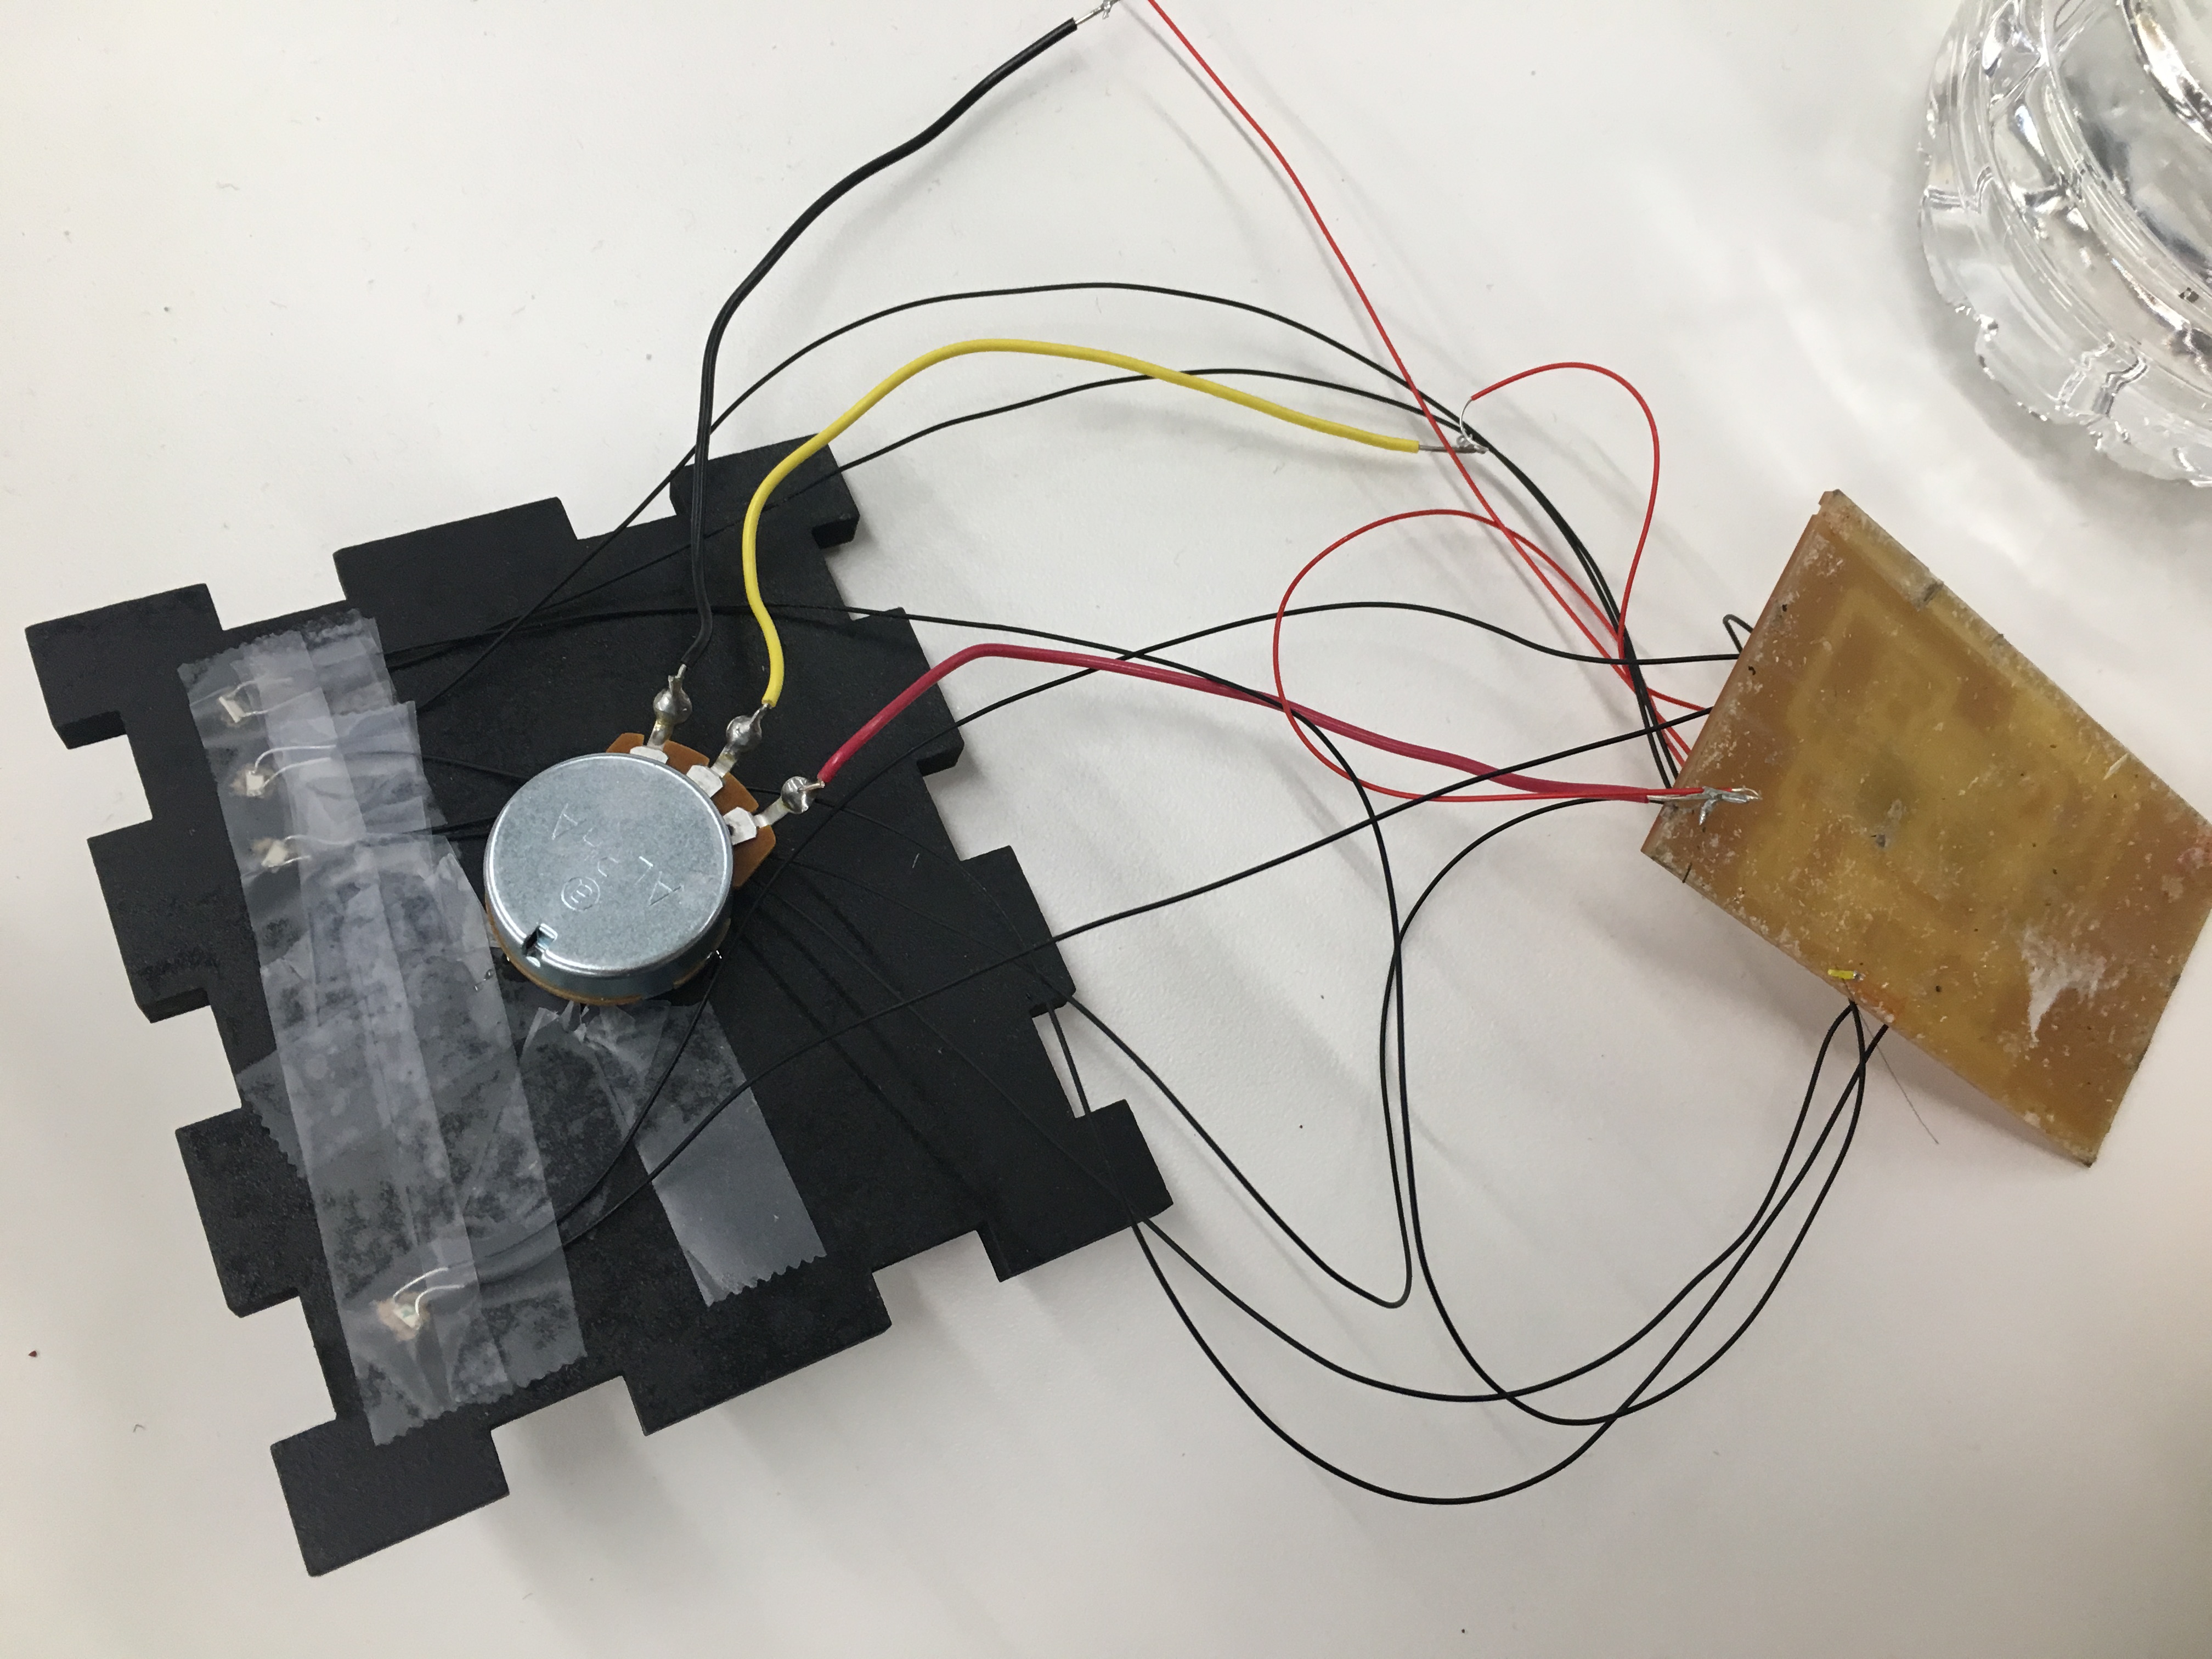
I discovered that the LEDs on the board wouldn’t show without showing the other parts of the circuit, so I decided to add other LEDs in parallel. I added a green light in parallel with the green light, an orange light in parallel with the orange light, a red light in parallel with the red light and a blue light in parallel with the blue light. I then drilled holes in the top of the box and stuck the lights so that they shined through the holes.
I used superglue to make everything stick! I didn’t glue the laser cut box so that the circuits would be re-programmed or modified in the future, and because the laser cut box fit snuggly. I super-glued the molded and casted logo onto the top of the box. I super-glued the metal potentiometer knob to the plastic 3D arrow-knob I printed. I super-glued the potentiometer to the underneath of the top of the box, so that it would stay in the same spot when the knob is turned (and not turn itself).
The final product
Questions
What tasks have been completed, and what tasks remain?
As mentioned earlier in this tracking page, I had certain tasks to be completed for the MVP. I completed all the tasks for the MVP. I also had 'reach' tasks that would be nice to have. I was able to complete some of them, including: creating multiple 'Rating boxes' and creating a nice web application. In the future, I would like to expand this project by making the boxes wireless and making the boxes smaller so that they can fit on a small desk in a lecture room.
What has worked? what hasn't?
The input device (potentiometer), output devices (LEDs), interface application and programming all worked well. I was able to read the input from multiple classrate boxes and display the average rating on a web application. I tried to hook up multiple of the devices using a single serial port. I was able to get the networking and communications working; however, since they were sending data through the same serial port, the data got garbled and that did not work, so instead I used multiple serial ports.
What questions need to be resolved?
What is the best way to send data from multiple devices? Having multiple serial ports or sending through the same serial port?
What will happen when?
-
My plan for the final project was to:
- Read input from a potentiometer
- Connect two processors through networking and communications
- Add output devices (LEDs) to the circuits
- Make a nodejs app that gets the readings and displays the average
- If there is time, make it wireless
What have you learned?
I have learned a lot in this class, including:
- How to make physical things, including skills from laser cutting, computer-controlled machining, molding and casting and 3D printing
- How to make and program circuits, including input devices, output devices, networking and communication
- I've also learned to do the MVP first and iterate! I initially wanted to make my final project wireless, but when I talked with one of the lab staff, he told me to start with wires for the MVP. So I did that and was able to finish my final project. If I had started with wireless, I am not sure I would have finished in time - and I probably wouldn't have learned as much. Now that I have the wired version of this product, it is easier to understand how I should make it wireless.
- This class has given me a lot more confidence in my ability to make anything. Before, when I had an idea on how to make something, I had no idea where to start and I often lacked the resources. Now, I probably still have no idea how to make it, but I will know how to start and where to find the resources to start.
- I've been inspired by this class to just go out and make anything!
Here are the files: