Web Interface Overview
Interactive Rock Control Dashboard
I developed a web-based interface to monitor and control the interactive rock system in real-time. The interface provides visual feedback and debugging capabilities for the WiFi-connected ESP32-S3 system.
Interface Architecture
- Framework: Pure HTML/CSS/JavaScript (no dependencies)
- Communication: WebSocket connection for real-time data streaming
- Backend: Node.js server with Express and WebSocket support
- Design: Responsive layout with dark theme optimized for monitoring
Interface Features
1. Real-Time Status Monitoring
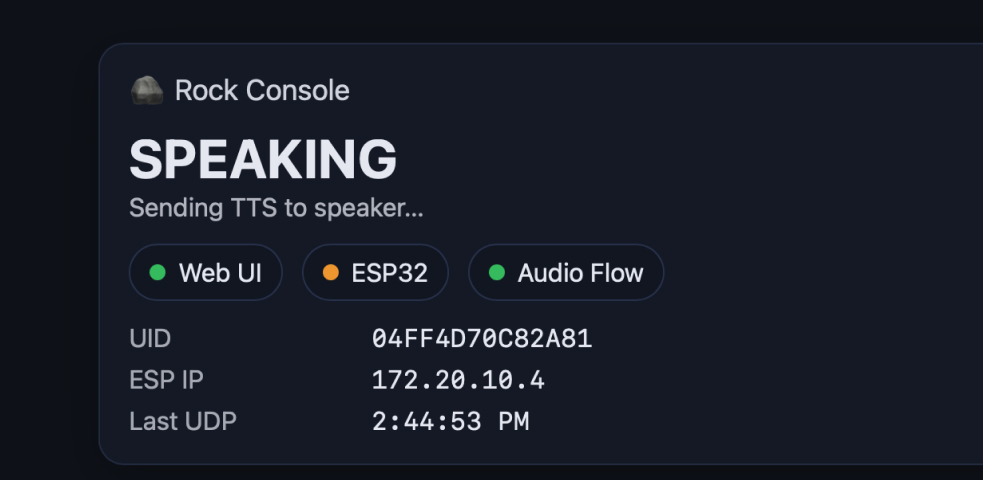
The interface displays live system status information:
- Connection Status: Visual indicator showing ESP32 WiFi connection state
- Current Rock: Displays which RFID tag is currently detected
- System State: Shows current operation mode (idle, listening, processing, speaking)
- LED Status: Real-time LED color and state visualization
2. RFID Tag Management
Visual representation of detected RFID tags with personality mapping:
const rockPersonalities = {
    "tag_id_1": {
        name: "Wise Rock",
        color: "#4A90E2",
        personality: "Philosophical and contemplative"
    },
    "tag_id_2": {
        name: "Playful Rock",
        color: "#E24A90",
        personality: "Fun and energetic"
    },
    "tag_id_3": {
        name: "Sarcastic Rock",
        color: "#90E24A",
        personality: "Witty and humorous"
    }
};
3. Audio Monitoring
The interface includes audio input visualization:
- Microphone Status: Shows when the system is listening
- Audio Level Meter: Real-time visualization of input volume
- Speech Recognition Status: Indicates when voice is being processed
4. AI Response Tracking
Display AI interaction details:
- Prompt Display: Shows the question sent to Gemini API
- Response Text: Displays AI-generated response before TTS conversion
- Processing Time: Shows latency for API calls
- Error Messages: Clear feedback if API calls fail
WebSocket Communication
Real-Time Data Protocol
The interface uses WebSocket for bidirectional communication between the ESP32 and the web dashboard:
Message Types
// Status Updates from ESP32
{
    type: "status",
    wifi: "connected",
    ip: "192.168.1.100",
    rfid: "tag_id_1",
    state: "listening"
}

// Audio Data
{
    type: "audio",
    level: 75,
    isListening: true
}

// AI Response
{
    type: "response",
    prompt: "What is the meaning of life?",
    response: "As a wise rock, I've pondered...",
    processingTime: 1250
}

// Error Handling
{
    type: "error",
    message: "API connection failed",
    code: "GEMINI_TIMEOUT"
}
Connection Management
const ws = new WebSocket('ws://localhost:3000');

ws.onopen = () => {
    console.log('Connected to rock system');
    updateConnectionStatus('connected');
};

ws.onmessage = (event) => {
    const data = JSON.parse(event.data);
    handleMessage(data);
};

ws.onerror = (error) => {
    console.error('WebSocket error:', error);
    updateConnectionStatus('error');
};

ws.onclose = () => {
    console.log('Disconnected from rock system');
    updateConnectionStatus('disconnected');
    // Attempt reconnection after 5 seconds
    setTimeout(() => connectWebSocket(), 5000);
};
Interface Design
Visual Layout
The interface uses a card-based layout for clear information hierarchy:
Main Components
- Header Bar: Shows system title and connection status
- Status Panel: Real-time system state indicators
- RFID Display: Current rock personality with color coding
- Audio Visualizer: Interactive waveform display
- Console Log: Scrolling event history with timestamps
- Control Panel: Manual trigger buttons for testing
Color Coding System
- Green (#4CAF50): Connected and operational
- Blue (#2196F3): Processing or listening
- Orange (#FF9800): Warning or waiting state
- Red (#F44336): Error or disconnected
- Purple (#9C27B0): AI response mode
Responsive Design
The interface adapts to different screen sizes:
/* Desktop Layout */
@media (min-width: 1024px) {
    .dashboard {
        display: grid;
        grid-template-columns: 1fr 2fr 1fr;
        gap: 20px;
    }
}

/* Tablet Layout */
@media (max-width: 1023px) and (min-width: 768px) {
    .dashboard {
        grid-template-columns: 1fr 1fr;
    }
}

/* Mobile Layout */
@media (max-width: 767px) {
    .dashboard {
        grid-template-columns: 1fr;
    }
}
Debugging Features
Usage for Debugging
The interface includes several features specifically designed for system debugging and testing:
1. Live Console
Real-time event logging with detailed information:
- Timestamp: Precise time for each event
- Event Type: Categorized logs (INFO, ERROR, DEBUG, API)
- Message Details: Full error messages and API responses
- Auto-scroll: Automatically follows new messages
- Export Function: Save logs to file for analysis
2. Manual Controls
Test buttons for triggering specific functions:
- Simulate RFID: Test different rock personalities without physical tags
- Test Audio: Send sample questions to API
- Reset System: Clear state and restart connection
- Toggle LED: Manually control LED for hardware testing
3. Network Diagnostics
Monitor network performance and connectivity:
function displayNetworkStats() {
    return {
        wsLatency: calculatePingTime(),
        apiLatency: lastApiResponseTime,
        reconnectAttempts: reconnectCount,
        messagesReceived: messageCount,
        droppedPackets: dropCount
    };
}
4. API Call Monitoring
Track all API interactions:
- Request Inspector: View full API request payload
- Response Viewer: Examine raw API responses
- Error Details: HTTP status codes and error messages
- Timing Analysis: Measure response times for optimization
Server Implementation
Node.js Backend
The interface is served by a lightweight Node.js server that handles WebSocket connections and serial communication with the ESP32:
const express = require('express');
const http = require('http');
const WebSocket = require('ws');
const SerialPort = require('serialport');

const app = express();
const server = http.createServer(app);
const wss = new WebSocket.Server({ server });

// Serve static files
app.use(express.static('public'));

// WebSocket connection handler
wss.on('connection', (ws) => {
    console.log('Client connected');

    ws.on('message', (message) => {
        // Handle commands from web interface
        handleCommand(JSON.parse(message));
    });

    ws.on('close', () => {
        console.log('Client disconnected');
    });
});

// Serial port communication with ESP32
const port = new SerialPort('/dev/ttyUSB0', {
    baudRate: 115200
});

port.on('data', (data) => {
    // Broadcast serial data to all connected clients
    wss.clients.forEach((client) => {
        if (client.readyState === WebSocket.OPEN) {
            client.send(data.toString());
        }
    });
});

server.listen(3000, () => {
    console.log('Server running on port 3000');
});
Key Features
- Bidirectional Communication: Send commands to ESP32 and receive status updates
- Multiple Clients: Support concurrent connections for team debugging
- Automatic Reconnection: Handles serial port disconnections gracefully
- CORS Support: Enable cross-origin requests for development
Appendix
Files
Setup Instructions
# Install dependencies
npm install express ws serialport

# Start the server
node server.js

# Open browser to
http://localhost:3000