11. INTERFACE & APPLICATION PROGRAMMING
Softwares: p5.js

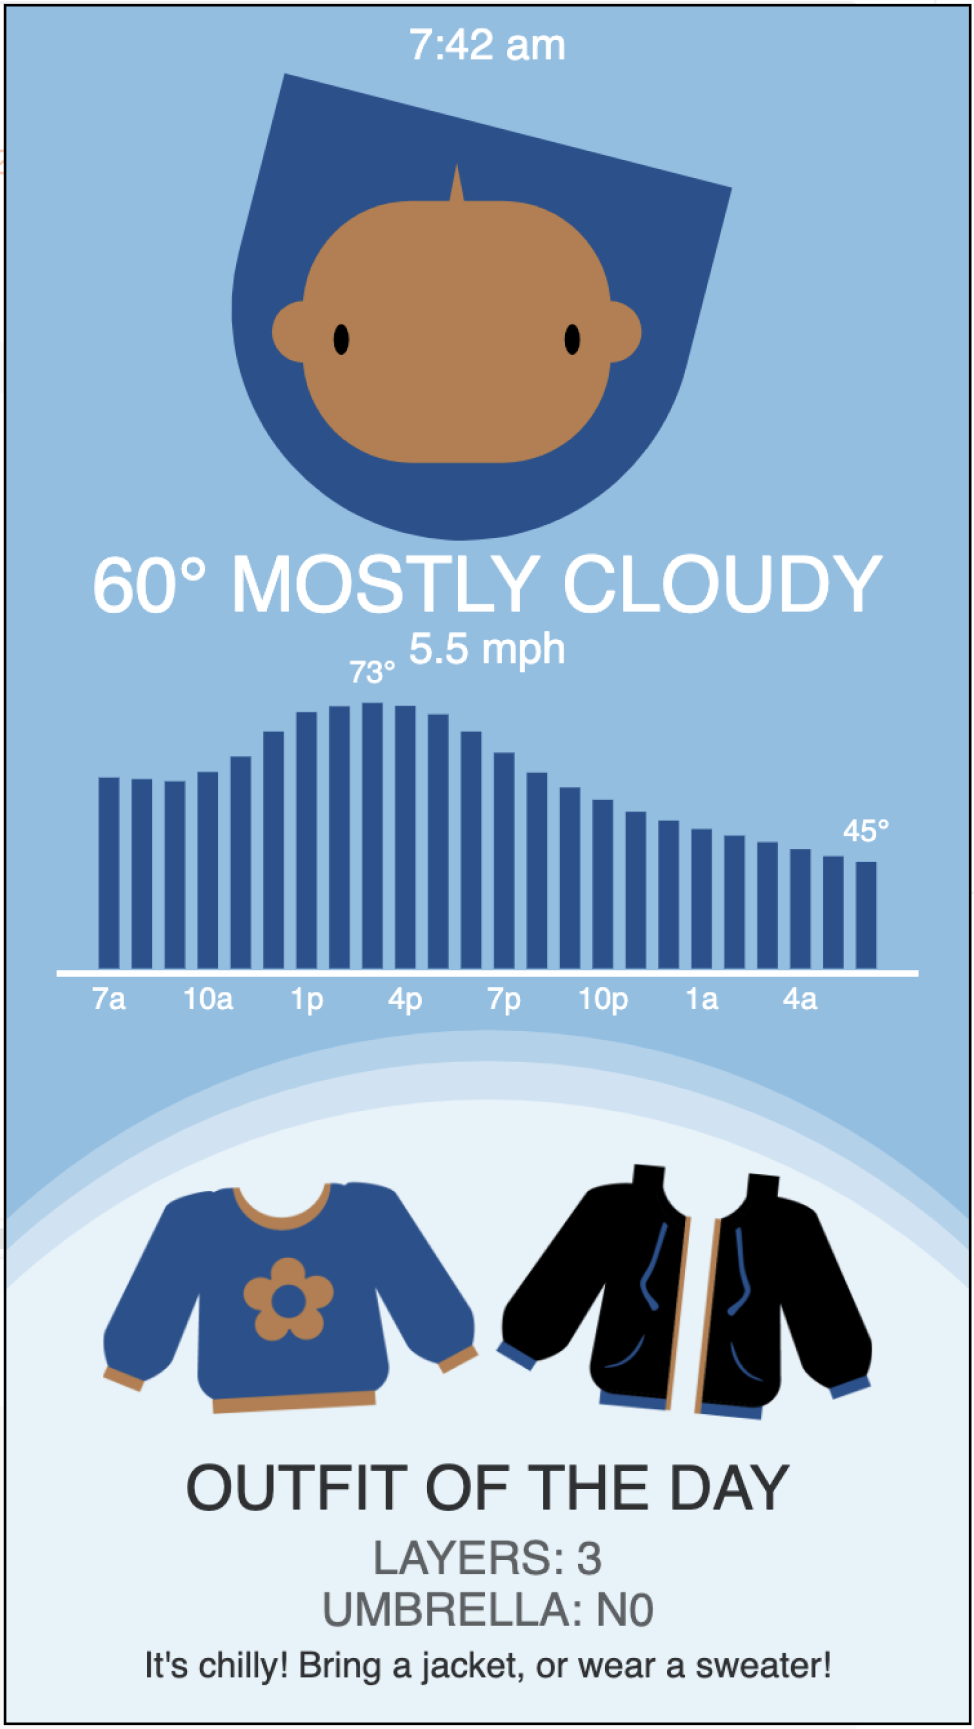
This week, I worked on revamping a previous P5JS weather app project that I
did last year. In the original app, it would pull the daily weather from a
weather API with a command called “requestWeather(x,y)”, display a cartoon
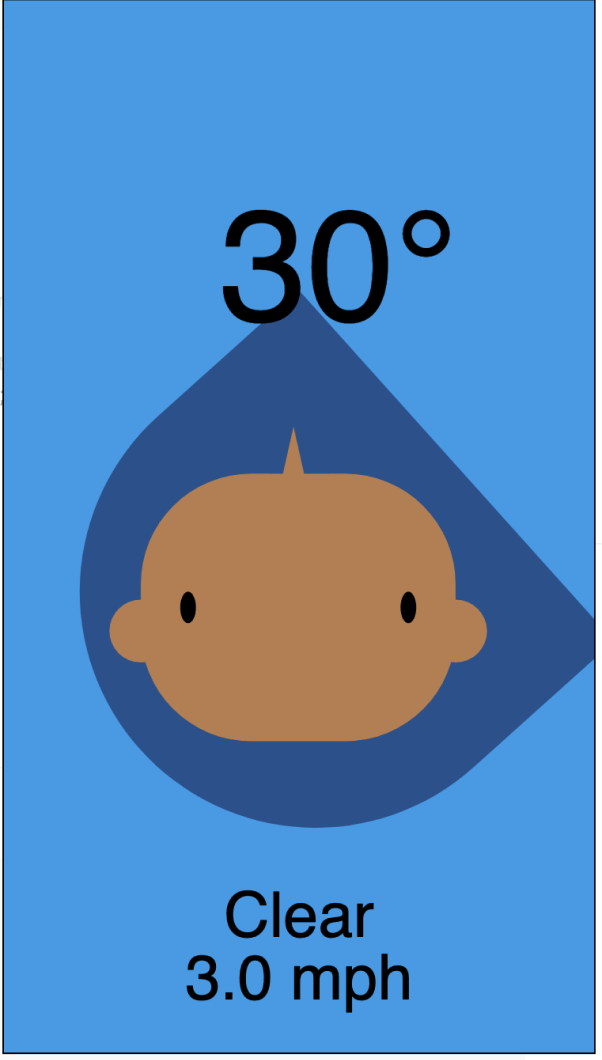
version of myself, the temperature, and wind speed, with the hair moving and
blowing in the wind at varying rates dependent on the wind speed.
For the next version, I wanted to include more information, such as the
daily temperature, and something that could indicate what type of outfit to
wear to not be too cold or hot.
The main updates I made was adding the temperature bars, which with the
class’s repository, was easy to create, and the “Outfit of the Day” bottom
portion.
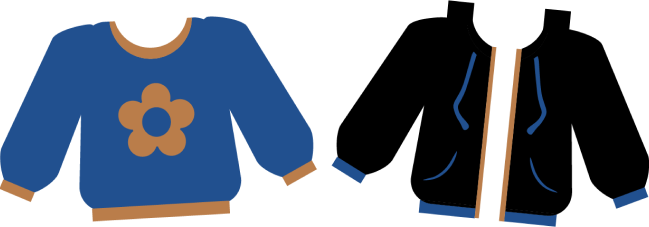
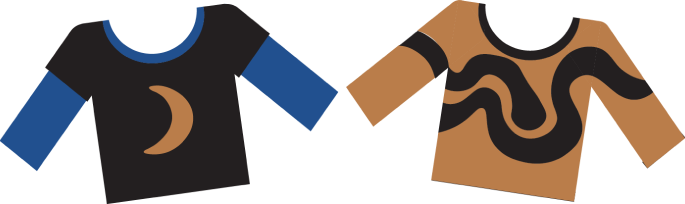
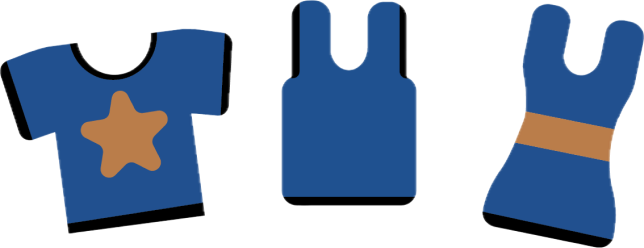
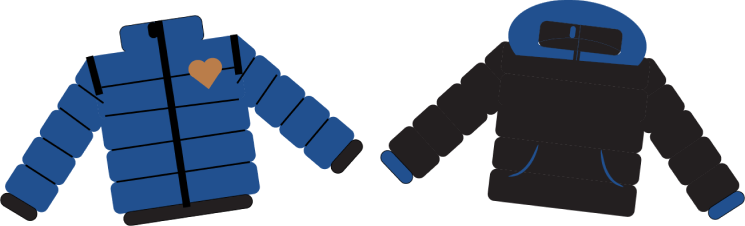
To create the “outfit of the day” portion, I modeled the outfits on Illustrator and saved them as images that would appear at a specific temperature ranges based on what ranges people preferred online (most information was garnered from international debates on Reddit threads).
I also used the “map()” function to vary the color of the background by the cloud coverage of the day to reveal more weather information.
// this will store all the weather data
let w;
let clearSky = '#098fe8';
let overcastSky = '#bad1e3';
let backgroundcolor;
let layer;
//images - made in illustrator
let clotheslayer1;
let clotheslayer2;
let clotheslayer3;
let clotheslayer4;
let clothes;
function load(){
clotheslayer1 = loadImage('warmweatherclothes.png');
clotheslayer2 = loadImage('midweatherclothes.png');
clotheslayer3 = loadImage('chillyweatherclothes.png');
clotheslayer4 = loadImage('winterweatherclothes.png');
}
function setup() {
size(375, 667);
//w = requestWeather(42.36031, -71.09414);
w = requestWeather(30.2672,-97.7431);
}
function draw() {
fill('black');
noStroke();
textAlign(CENTER);
textSize(14);
if (w.ready) {
let cloudpercent = w.getCloudCover();
let currentemp = w.getTemperature();
backgroundcolor = lerpColor(clearSky, overcastSky, cloudpercent);
clear(backgroundcolor);
drawWeather();
} else {
// if the forecast isn't ready yet, show a message at the bottom of the screen
drawMessage("Loading...");
}
}
// show a message at the bottom of the screen
function drawMessage(what) {
text(what, width/2, 20);
}
function drawWeather() {
// when was this forecast updated?
let forecastTime = w.getTime();
fill('white');
// show the time at the bottom of the screen
//drawMessage(forecastTime.hourMinuteLong());
FashionAdvice();
// draw the chart of temperatures
drawTemperatures();
let windspeed = w.getWindSpeed();
// stop animating
if (windspeed !=0){
let direction = w.getWindDirection();
//let direction = 50
//let direction = 0;
push();
scale(.6);
translate(105, 60); // half of 200x300, and negative so it will center everything at 0,0
// your drawing commands
push();
translate(width/2,150);
rectMode(CENTER);
let amount = 5;
let speed = 0.15;
let sway = amount * sin(frameCount * speed);
rotate(radians(direction + sway));
drawHair();
//drawWindBlowing();
pop();
drawHead();
pop();
}
//rect(width/2, 500,300, 100);
textSize(30);
fill('white');
// get the temperature, round it, and add the degree symbol
let readout = formatDegrees(w.getTemperature());
// show the temperature in degrees
text(readout+ " " + formatText(w.getConditionText()), width/2, 235);
textSize(17);
text(nfd(windspeed, 1) + " mph", width/2, 255);
drawMessage(forecastTime.hourMinuteLong());
}
function drawTemperatures() {
let temps = w.getTemperature('hours'); // provides hours for the next 10 days
let times = w.getTime('hours');
const count = 24; // we'll use 24 hours
const start = w.nearestOffset('hours'); // find the nearest hour
temps = temps.slice(start, start + count); // grab the next 24 temperatures
times = times.slice(start, start + count); // and the times for those temps
stroke('white');
strokeWeight(8);
strokeCap(SQUARE);
fill('black');
textSize(12);
// text("jacket needed", 300, 440);
// fill('white');
//text("jacket not needed", 300,455);
fill("#21508f");
let minTemp = min(temps);
let maxTemp = max(temps);
// subtract 10 so that the lowest number isn't zero
let lowTemp = roundDown(minTemp) - 10;
let highTemp = roundUp(maxTemp);
let chartLeft = 40;
let chartRight = width - chartLeft;
let chartTop = 260;
let chartBottom = 370;
for (let i = 0; i < count; i++) {
let x = remap(i, 0, count-1, chartLeft, chartRight);
let y = remap(temps[i], lowTemp, highTemp, chartBottom, chartTop);
// if (temps[i] < 50){
stroke("#21508f");
line(x, y, x, chartBottom);
noStroke;
rectMode(CENTER);
rectMode(CORNER);
fill('white');
noStroke();
rect(20, 375, 335, 2);
noStroke();
// draw the hour for every third hour
if (i % 3 == 0) {
text(times[i].hourShort(), x, chartBottom + 20);
}
// if this is the min or max temp, draw it
if (temps[i] == minTemp || temps[i] == maxTemp) {
text(formatDegrees(temps[i]), x, y - 12);
}
}
}
// round down by 10s, e.g. anything from 31 through 39 becomes 30
function roundDown(value) {
var r = value % 10;
return value - r;
}
// round a number up to the next 10, e.g. anything from 61 to 69 becomes 70
function roundUp(value) {
var r = value % 10;
return value + (10 - r);
}
// round the number and add the degree symbol to the end
function formatDegrees(amount) {
// the degree symbol, or \u00B0
return round(amount) + '°';
}
// take a number from 0..1 and format it as a percentage (no decimal points)
function formatPercent(amount) {
return round(amount * 100) + "%";
}
function formatText(text) {
return text.toUpperCase();
}
function FashionAdvice(){
noStroke();
fill(255,255,255,.3);
circle(width/2, 673, 550);
fill(255,255,255,.4);
circle(width/2, 685, 550);
fill(255,255,255,.5);
circle(width/2, 700, 550);
noStroke();
textSize(24);
fill(0,0,0,.8);
text("OUTFIT OF THE DAY",width/2, 585);
let currentTemp = (w.getTemperature());
// let currentTemp = (w.getTemperature());
//text(currentTemp, width/2, 300);
//let currentTemp = 70;
if (currentTemp > 67){
layer = (1);
}
if (50 < currentTemp || currentTemp < 67){
layer = (2);
}
if (40 < currentTemp || currentTemp < 50){
layer = (3);
}
if (currentTemp < 40){
layer = (4);
}
drawClothes(layer);
textSize(18);
fill(0,0,0,.6);
text("LAYERS: "+ layer ,width/2, 610);
let UmbrellaChance = w.getPrecipitationIntensity();
//let UmbrellaChance = 2
if( UmbrellaChance > 0.0984252){
textSize(18);
text("UMBLRELLA: YES", width/2, 630);
} else {
textSize(18);
text("UMBRELLA: N0", width/2, 630);
}
}
function drawClothes(layer){
push();
textSize(14);
translate(width/2, 650);
if (layer == 1){
clothes = clotheslayer1;
clothingItems(clothes);
text("It's warm! Wear a t-shirt, tank top, or dress.",0,0);
}
if (layer == 2){
clothes = 'clotheslayer2';
clothingItems(clothes);
text("It's mid, try wearing long sleeves, or layering lightly!",0,0);
}
if (layer == 3){
clothes = clotheslayer3;
clothingItems(clothes);
text("It's chilly! Bring a jacket, or wear a sweater!",0,0);
}
if (layer == 4){
clothes = clotheslayer4;
clothingItems(clothes);
text("It's COLD! Bring a winter jacket or dont go outside!",0,0);
}
pop();
}
function clothingItems(){
image(clothes,0,-150,300,100);
//rect(width/2, 500,300, 100);
}
function drawHead(){
push();
translate(width/2, 150);
rectMode(CENTER);
fill("#ba7d4a");
roundRect(0,0, 200, 170, 70, 70, 70, 70);
noStroke();
fill("#ba7d4a");
circle(-100, 0, 40);
circle(100,0, 40);
triangle(-5, -84,5, -84, 0, -110);
fill(gray(100));
ellipse(-75, 5, 10,20);
ellipse(75, 5, 10,20);
pop();
}
function drawHair(){
fill("#21508f");
roundRect(0, 0, 300, 270,150,150,0,0);
rectMode(CENTER);
}
FINAL VERSION + CODE
VIDEO